Week - 4 - Crash Box Simulation
Aim:
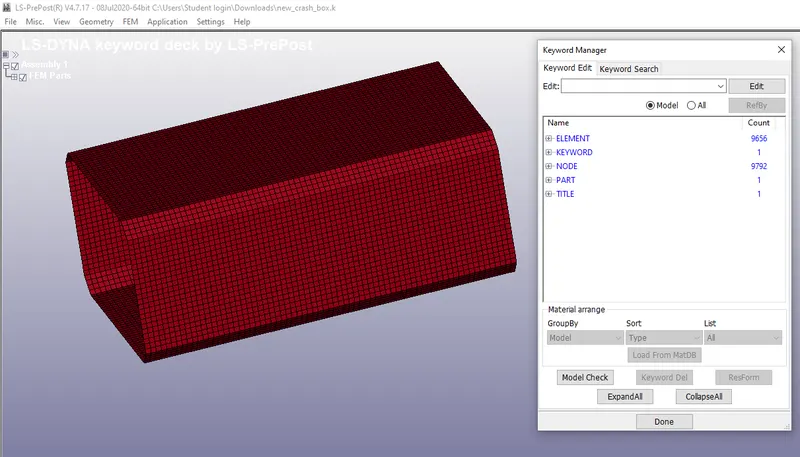
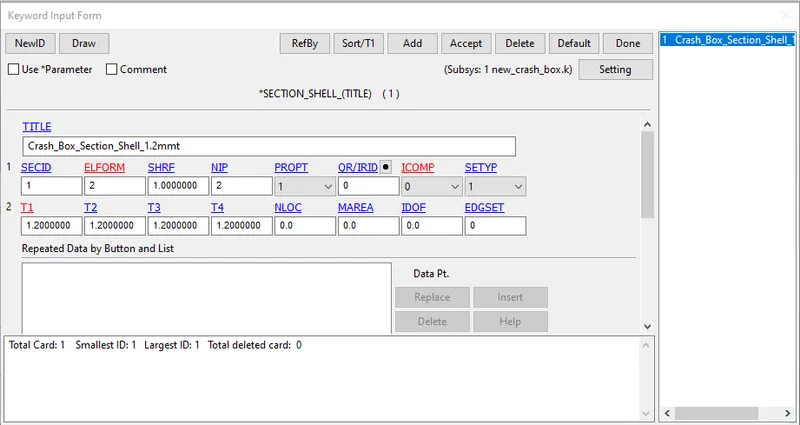
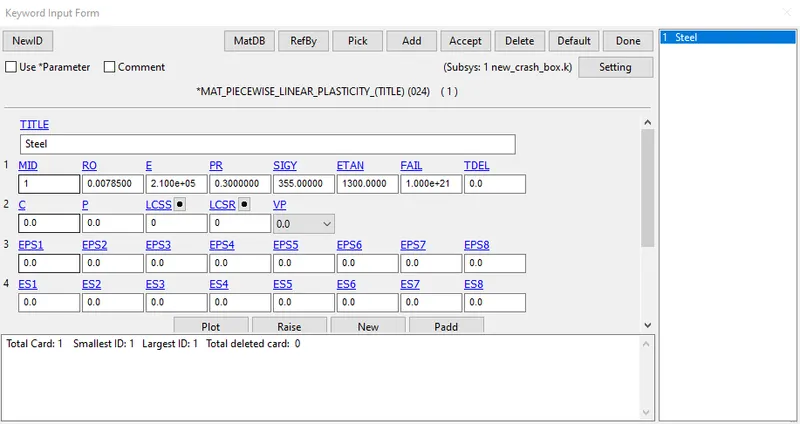
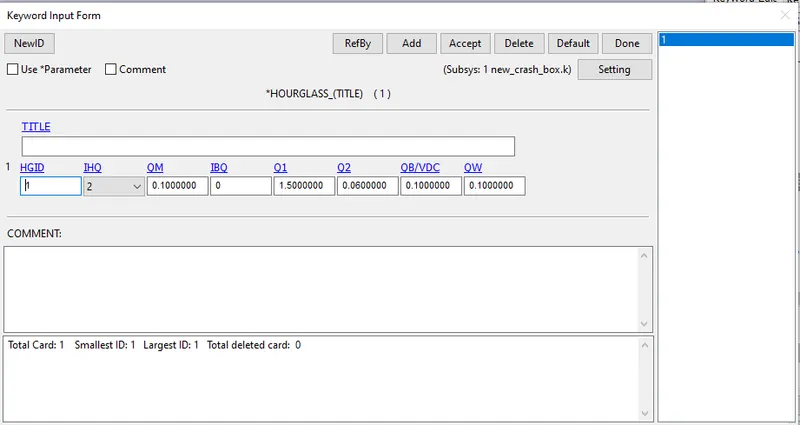
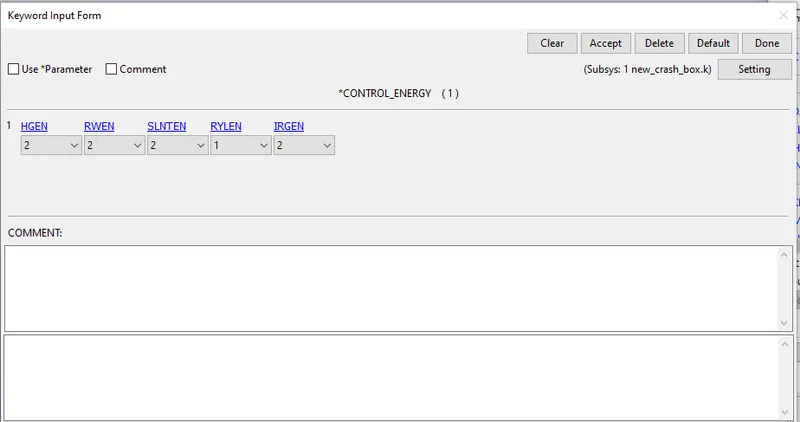
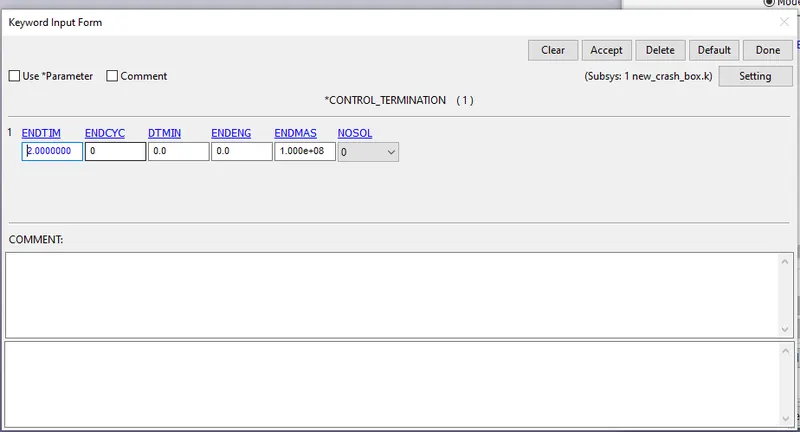
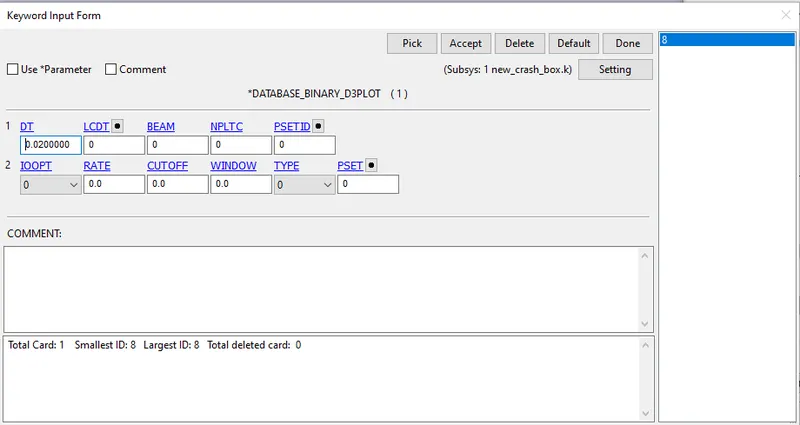
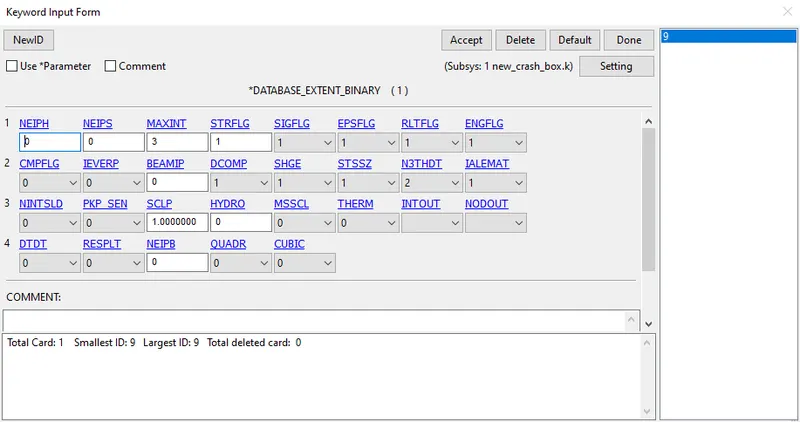
To create a fullfilled simulation file for the crash analysis of the given model by having two different thicknesses of 1.2mm and 1.5mm from the
given FE model and produce the following outputs.
Outputs:-
ACCELERATION PLOT OF A NODE IN THE MIDDLE OF THE CRASH BOX
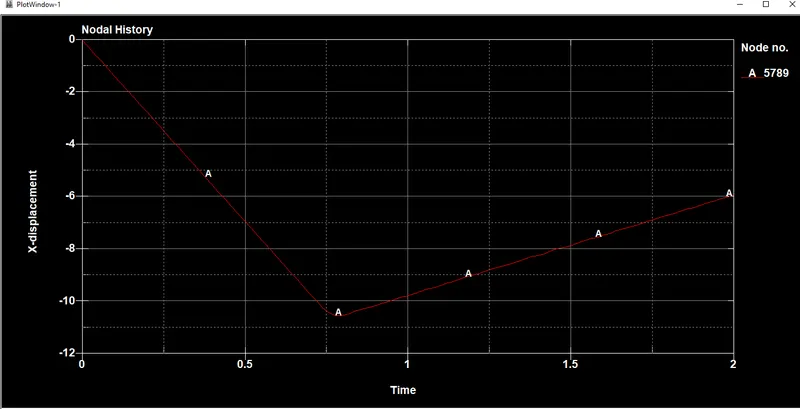
Fig(a), shows the x-acceleration plot of node 5789 for a crash box having 1.2 mm thickness
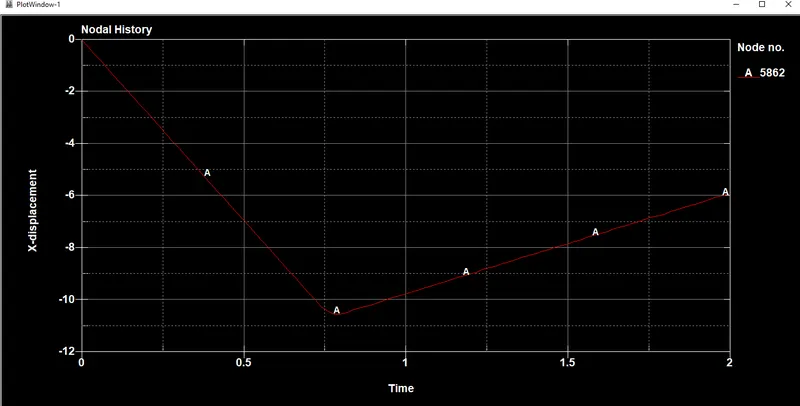
Fig(b), shows the x-acceleration plot of node 5862 for a crash box having 1.5 mm thickness
From figures (a) & (b), it is observed that the deacceleration occurs during the impact at 1.5ms and it is evident the crash box having a thickness of 1.5 mm thickness deaccelerated at a faster rate than the crash box having the thickness of 1.2mm. This is due to increases in the thickness of the
crash box increases the deacceleration rate in a faster manner during the impact. After, the impact rebounce happens, and the crash box accelerates and deaccelerates until the end time.
MAXIMUM DIRECTIONAL STRESS :
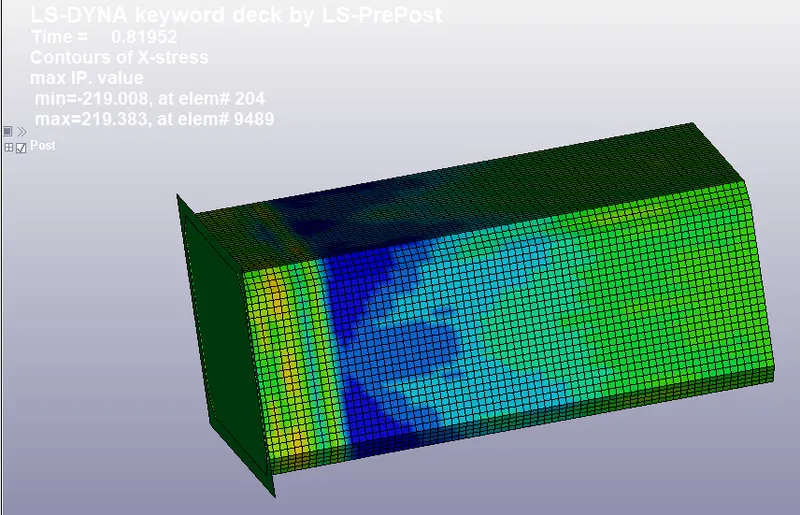
Fig (a) shows the Maximum directional stress in the x-direction for the crash box having 1.2 mm thickness
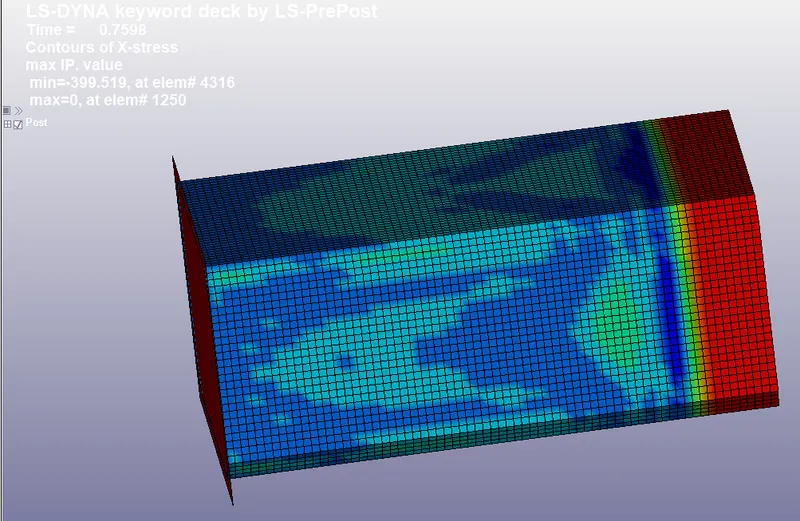
Fig (b) shows the Maximum directional stress in the x-direction for the crash box having 1.5mm thickness
From, the above figures (a) & (b), it is observed that the maximum directional stress for the crash box with a thickness of 1.5 mm having x stress value of 399.519 MPa is lower than the crash box with a thickness of 1.2mm which has (219.383 MPa). The value of stress in the crash box with a
thickness of 1.5mm reduced since there is an increase in the thickness which also increases the cross-section. As we, know that the increase in cross-section area decreases the stress value.
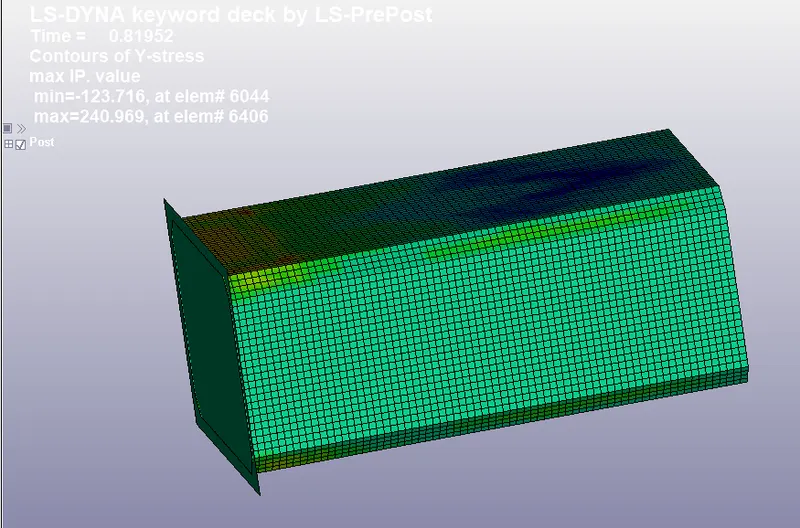
Fig (a) shows the Maximum directional stress in the Y-direction for the crash box having 1.2 mm thickness
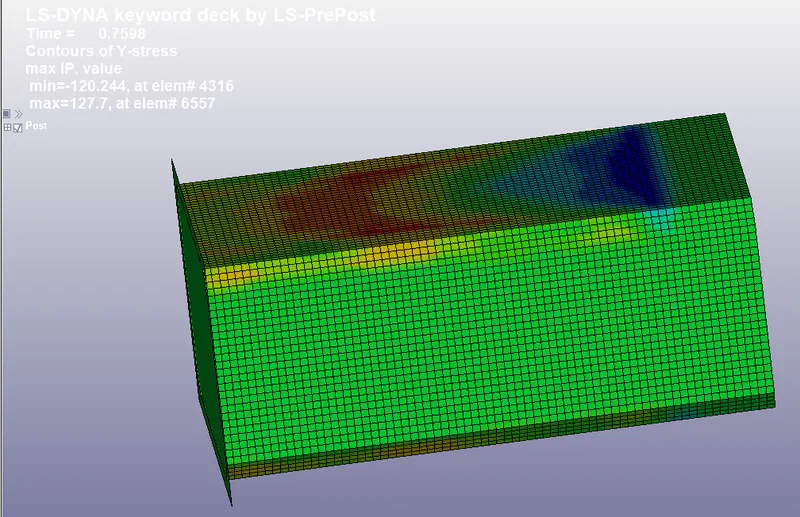
Fig (b) shows the Maximum directional stress in the Y-direction for the crash box having 1.5 mm thickness
From, the above figures (a) & (b), it is observed that the maximum directional stress for the crash box with a thickness of 1.5 mm having a Y stress value of 127.7 MPa is lower than the crash box with a thickness of 1.2mm which has (240.969). The value of stress in the crash box with a
thickness of 1.5mm reduced since there is an increase in the thickness which also increases the cross-section. As we, know that the increase in cross-section area decreases the stress value.
MAXIMUM DIRECTIONAL STRAIN (X & Y)
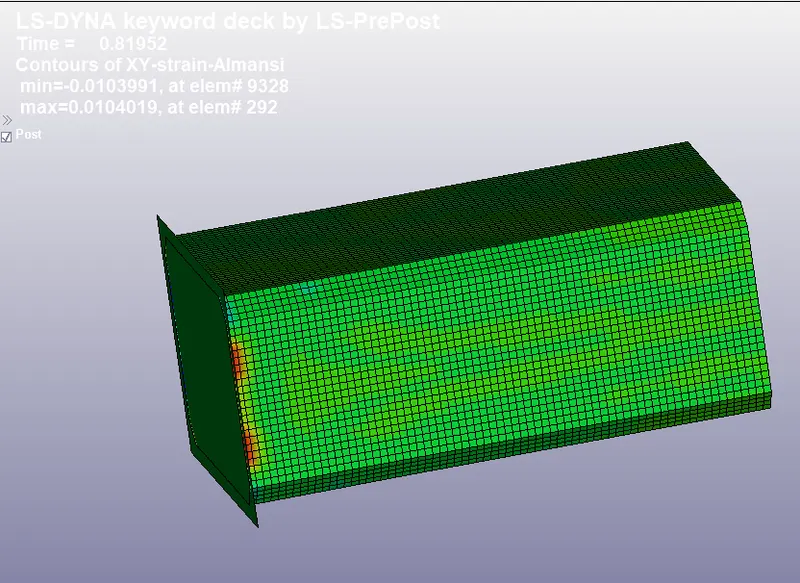
Fig (a) shows the Maximum directional strain in the X-direction for the crash box having 1.2 mm thickness
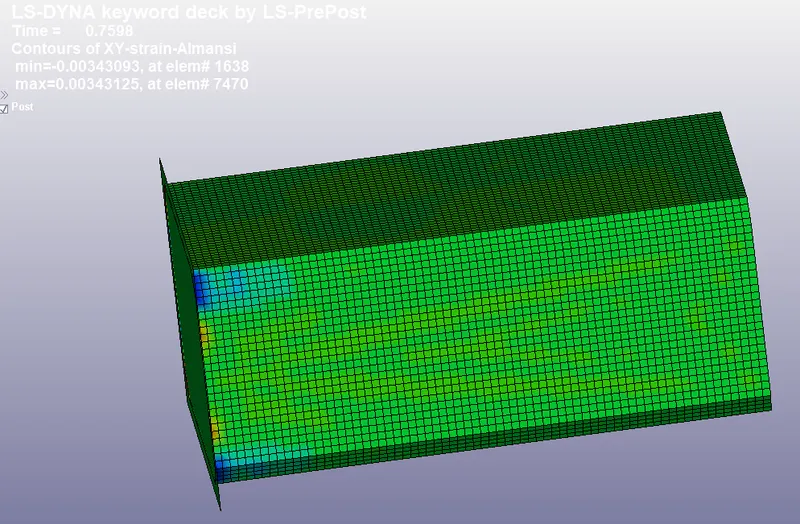
Fig (b) shows the Maximum directional strain in the x direction for the crash box having 1.5 mm thickness
From, Fig (a) and (b), it is observed that the x strain of both crash boxes is almost the same since there is only a slight change in the thickness for the crash boxes.
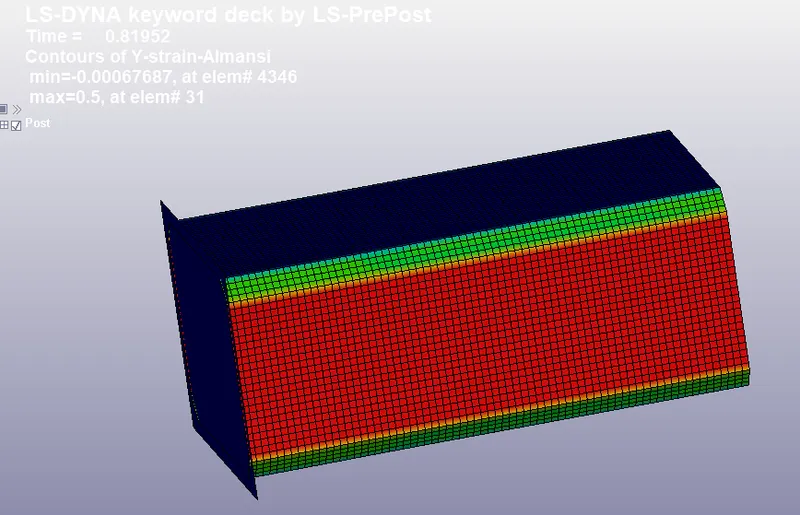
Fig (a) shows the Maximum directional strain in the Y direction for the crash box having 1.2 mm thickness
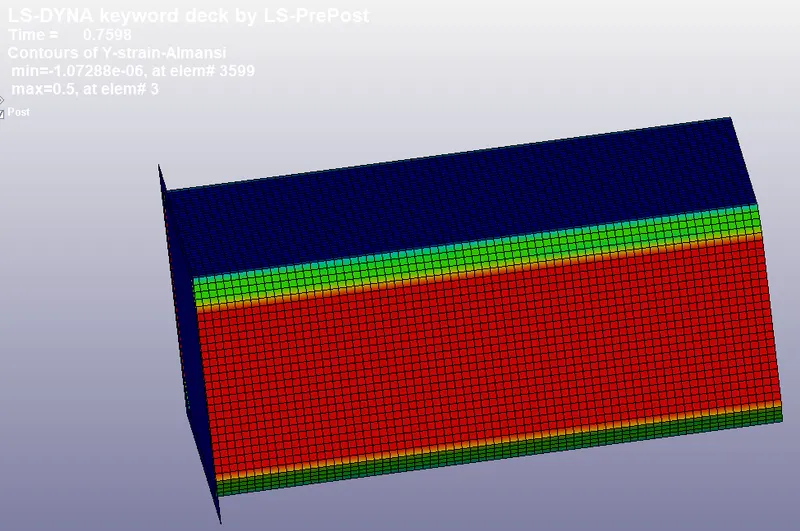
Fig (b) shows the Maximum directional strain in the Y direction for the crash box having 1.5 mm thickness
From, Fig (a) and (b), it is observed that the Y strain of both crash boxes is almost the same since there is only a slight change in the thickness for the crash boxes.
PLOT OF ALL ENERGIES:
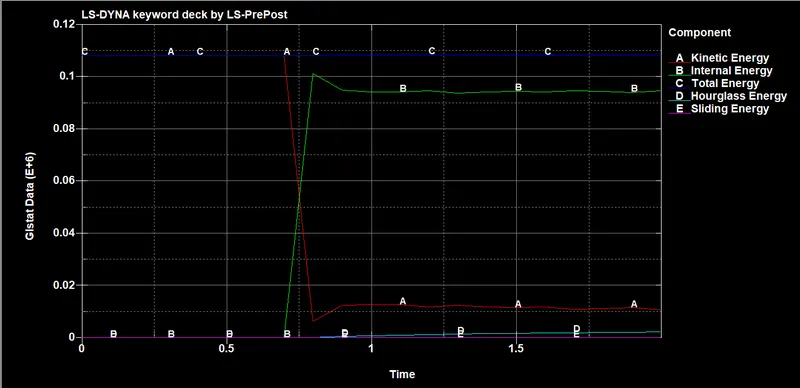
Fig (a) , represents, GLSTAT DATA Plot for the crash box (1.2mm thickness)
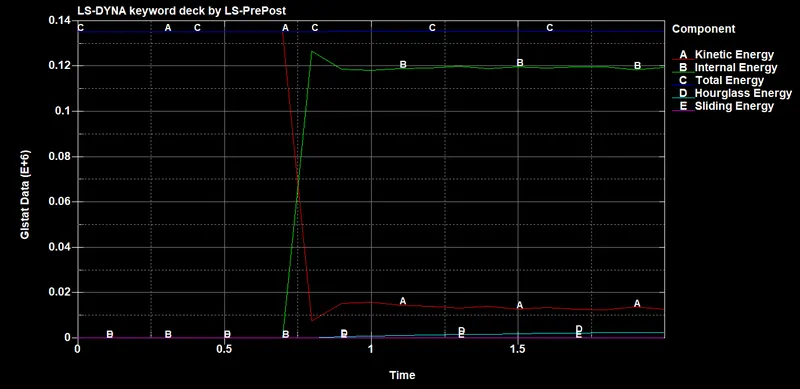
Fig(b), represents GLSTAT DATA Plot for the crash box (1.2mm thickness)
STRESS PLOT:
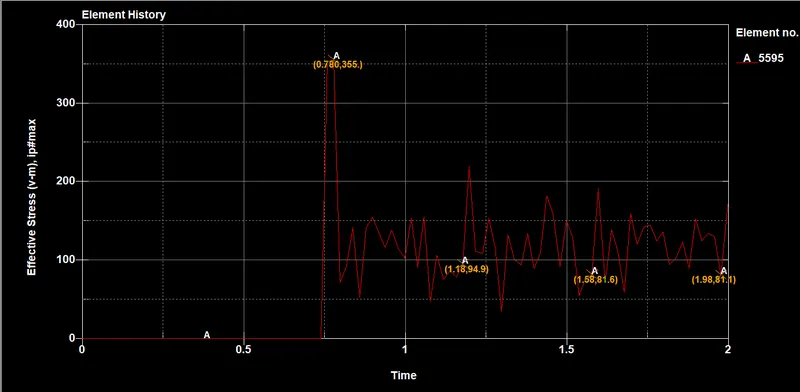
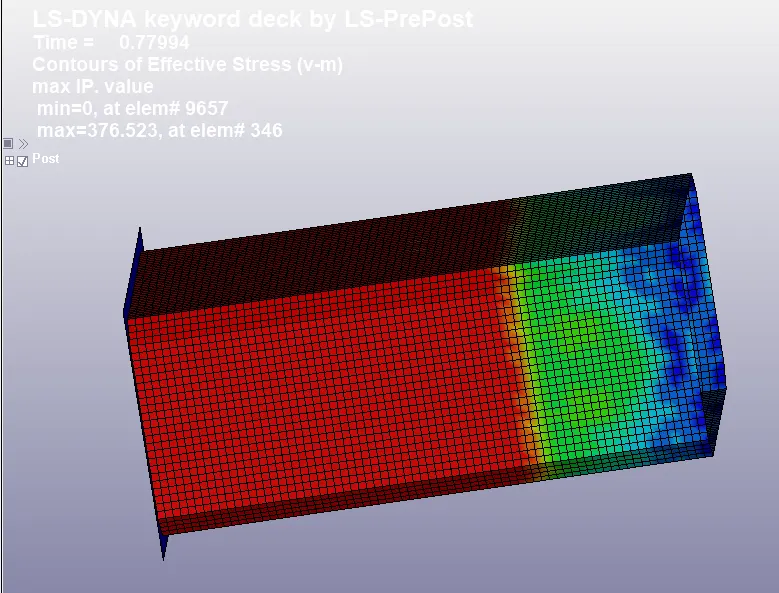
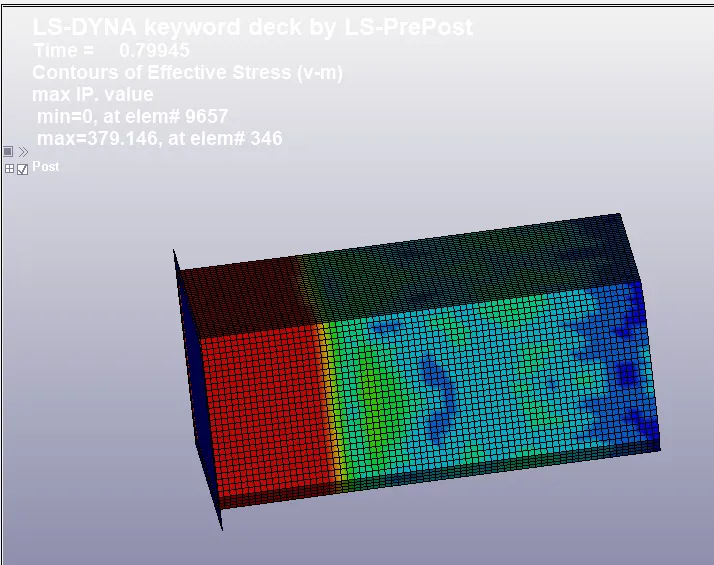
Fig(a), represents the Effective (v-m) of the crash box having 1.2 mm thickness
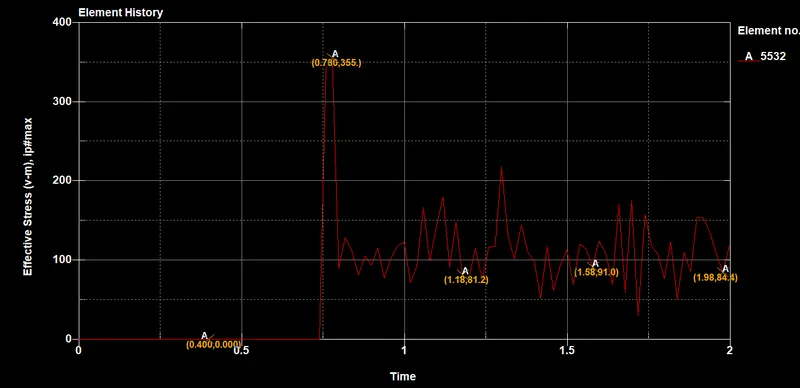
Fig(b), represents the Effective (v-m) of the crash box having 1.5 mm thickness
STRAIN PLOT
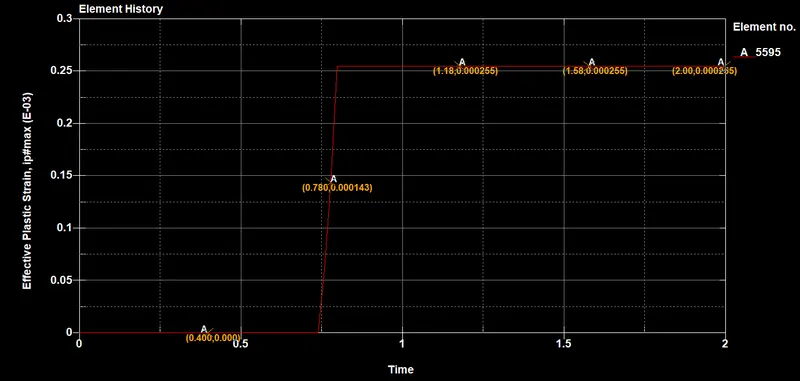
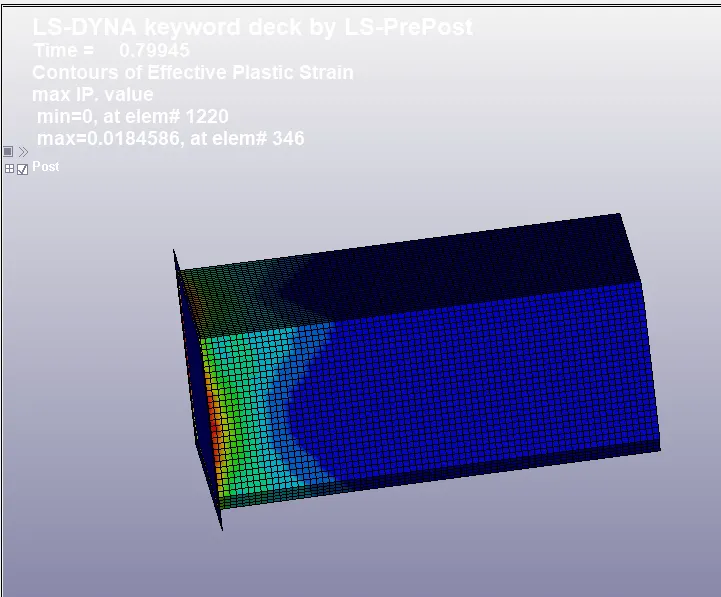
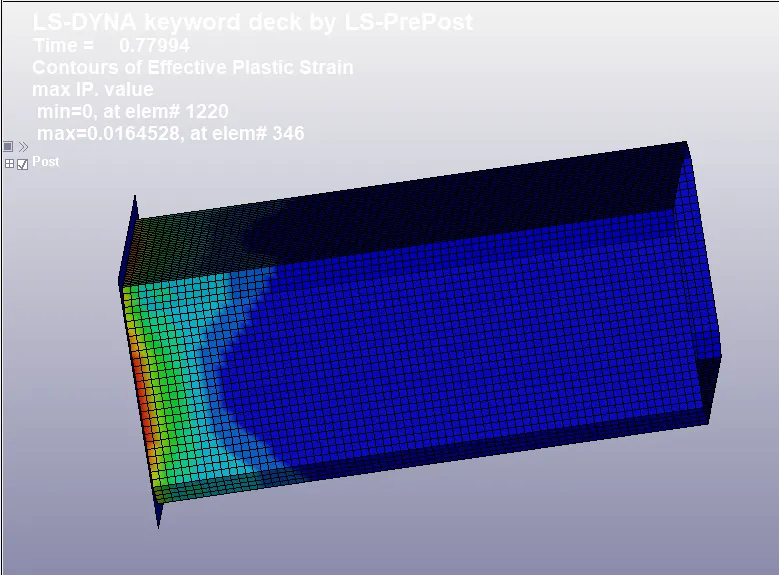
Fig(a), represents the effective plastic strain plot of the crash box having 1.2 mm thickness
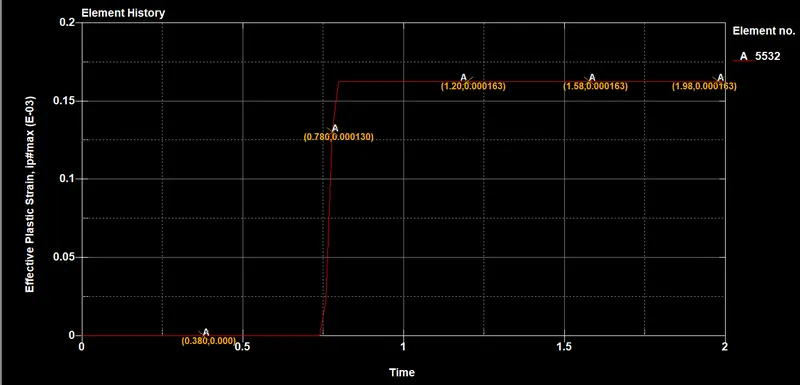
Fig(a), represents the effective plastic strain plot of the crash box having 1.5 mm thickness
CONCLUSION:
Thus, the crash test for the crash box is simulated with different crash box thickness, along with the given material properties, boundary
conditions, and required output data are delivered, plotted, and compared successfully.