Tension and Torsion test challenge
Aim:
To perform the tension and torsion test on the specimen provided in explicit dynamics.
Objective:
For the tension test, displace one end of the specimen to 18 mm while keeping the other fixed. You will need to find out the total deformation, equivalent stress and temperature of the specimen and attach appropriate images to show your results.
For the torsion test, you will need to displace one end of the specimen to an angle of 1200 degree. Find out the total deformation, equivalent stress and temperature of the specimen and attach images to show your results.
Procedure:
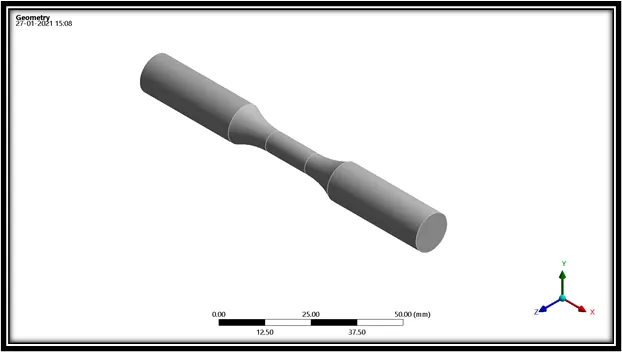
At first, we will be importing the model into ANSYS-WORKBENCH and check for geometrical errors.
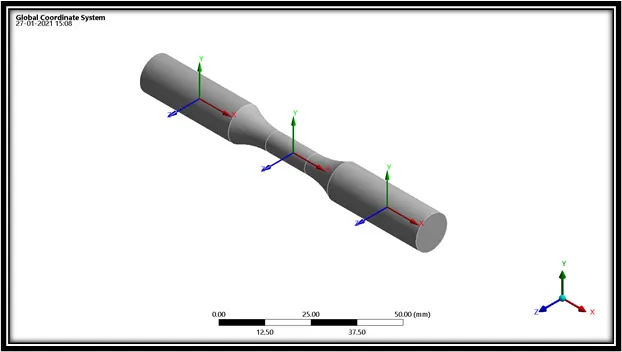
Since, these tests require fixed support at one end and displacement at the other end, we will be creating two more user defined co-ordinate systems as shown in the image below to give proper mesh for the model and obtain accurate better results.
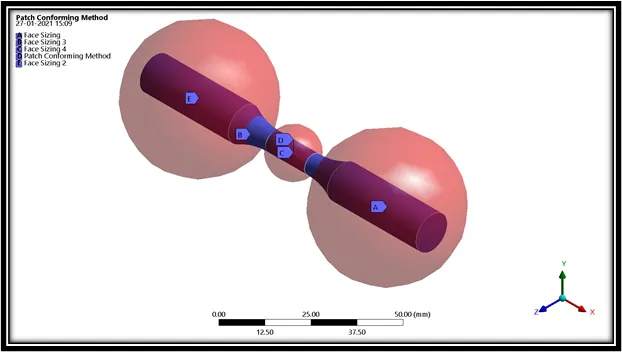
We will be providing sphere of influence and patch confirming method for the centre area where there will be tension taking place for the four areas as shown in the image below.
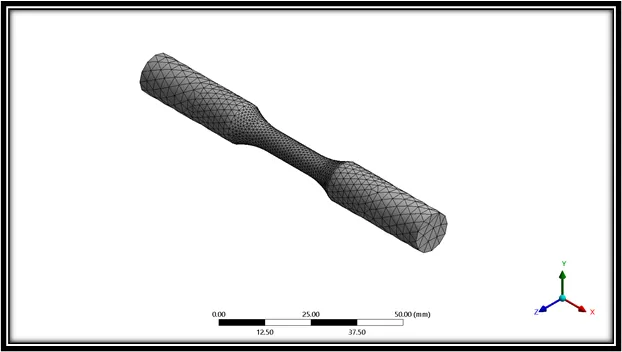
The final meshed model is obtained as shown in the image below.
Now, we will be providing boundary conditions for the case setup by fixed the setup at one end as shown in the image below.
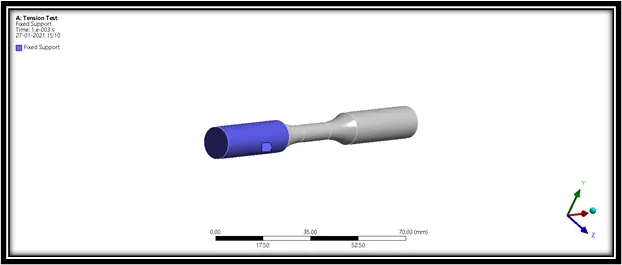
Then we will be providing displacement like pulling the setup model at the other end and we will be providing a displacement of 18 mm as shown in the image below.
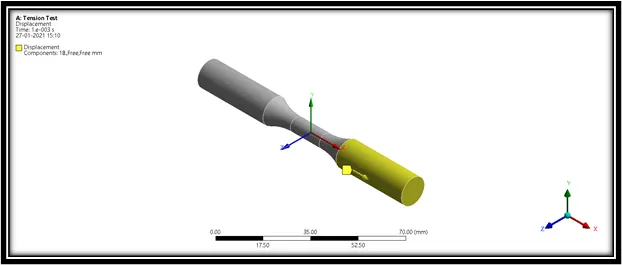
Keeping all the parameters same as that of tension test, we will be changing only the boundary condition displacement to degree with a new co-ordinate system created.
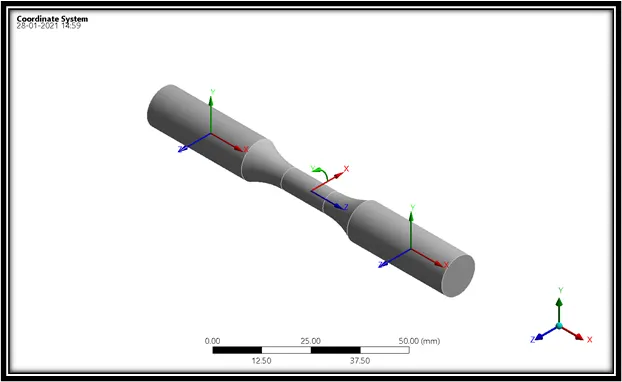
Similarly, for the tension test we will be creating another co-ordinate which we will help us to set the reference for the rotating displacement to happen during torsion test. The co-ordinate system obtained will be as shown in the image below.
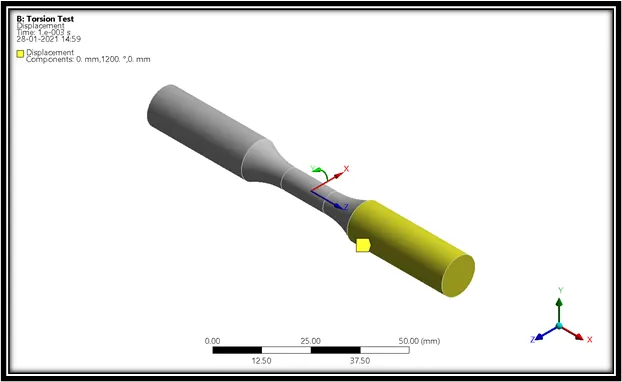
The rotating angle will be 1200 degree as shown in the image below.
Simulation:
Tension Test:
Total Deformation:
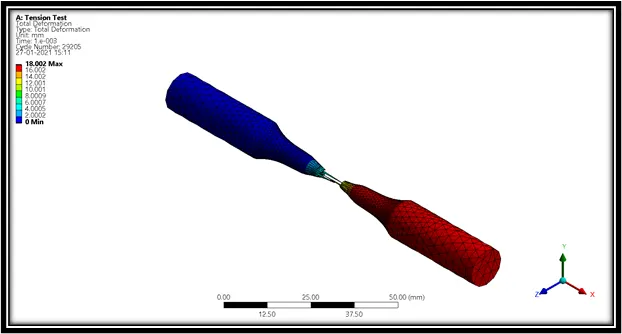
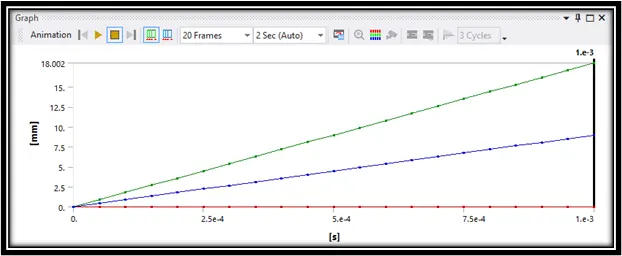
|
Time [s] |
Minimum [mm] |
Maximum [mm] |
Average [mm] |
|
|
1 |
1.18E-38 |
0 |
0 |
0 |
|
2 |
5.00E-05 |
0 |
0.90443 |
0.44255 |
|
3 |
1.00E-04 |
0 |
1.8069 |
0.89328 |
|
4 |
1.50E-04 |
0 |
2.7061 |
1.3449 |
|
5 |
2.00E-04 |
0 |
3.6024 |
1.7943 |
|
6 |
2.50E-04 |
0 |
4.5001 |
2.2432 |
|
7 |
3.00E-04 |
0 |
5.4008 |
2.6935 |
|
8 |
3.50E-04 |
0 |
6.3003 |
3.1434 |
|
9 |
4.00E-04 |
0 |
7.2007 |
3.5934 |
|
10 |
4.50E-04 |
0 |
8.1005 |
4.0428 |
|
11 |
5.00E-04 |
0 |
9.0003 |
4.4919 |
|
12 |
5.50E-04 |
0 |
9.9005 |
4.9411 |
|
13 |
6.00E-04 |
0 |
10.8 |
5.3901 |
|
14 |
6.50E-04 |
0 |
11.7 |
5.8394 |
|
15 |
7.00E-04 |
0 |
12.6 |
6.2888 |
|
16 |
7.50E-04 |
0 |
13.5 |
6.7385 |
|
17 |
8.00E-04 |
0 |
14.4 |
7.188 |
|
18 |
8.50E-04 |
0 |
15.3 |
7.6375 |
|
19 |
9.00E-04 |
0 |
16.201 |
8.0872 |
|
20 |
9.50E-04 |
0 |
17.101 |
8.5369 |
|
21 |
1.00E-03 |
0 |
18.002 |
8.9865 |
Simulation Video - https://drive.google.com/file/d/1ardZ0R23LC59Hw9uqTajE3bOluJXffEJ/view?usp=sharing
Equivalent Stress:
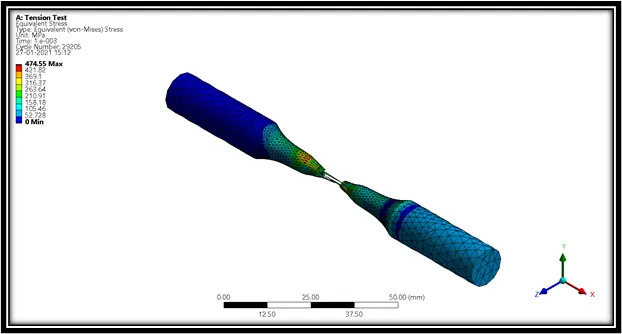
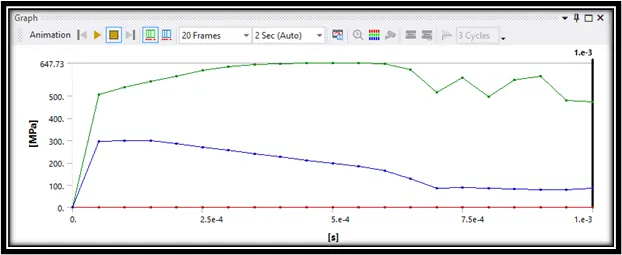
|
Time [s] |
Minimum [MPa] |
Maximum [MPa] |
Average [MPa] |
|
|
1 |
1.18E-38 |
0 |
0 |
0 |
|
2 |
5.00E-05 |
0 |
505.41 |
295.81 |
|
3 |
1.00E-04 |
0 |
538.93 |
299.97 |
|
4 |
1.50E-04 |
0 |
564.88 |
298.66 |
|
5 |
2.00E-04 |
0 |
589.7 |
286.16 |
|
6 |
2.50E-04 |
0 |
613.48 |
269.03 |
|
7 |
3.00E-04 |
0 |
630.76 |
254.82 |
|
8 |
3.50E-04 |
0 |
640.3 |
241.02 |
|
9 |
4.00E-04 |
0 |
645.77 |
225.87 |
|
10 |
4.50E-04 |
0 |
647.73 |
211.17 |
|
11 |
5.00E-04 |
0 |
647.58 |
196.92 |
|
12 |
5.50E-04 |
0 |
646.34 |
183.83 |
|
13 |
6.00E-04 |
0 |
643.68 |
165.67 |
|
14 |
6.50E-04 |
0 |
617.78 |
126.78 |
|
15 |
7.00E-04 |
0 |
516.85 |
86.284 |
|
16 |
7.50E-04 |
0 |
582.93 |
89.676 |
|
17 |
8.00E-04 |
0 |
497.72 |
84.894 |
|
18 |
8.50E-04 |
0 |
572.6 |
80.955 |
|
19 |
9.00E-04 |
0 |
589.49 |
77.609 |
|
20 |
9.50E-04 |
0 |
479.38 |
80.098 |
|
21 |
1.00E-03 |
0 |
474.55 |
84.533 |
Simulation Video - https://drive.google.com/file/d/163WYrcs03NeczRwA6e6u8VwQxBvyWHOm/view?usp=sharing
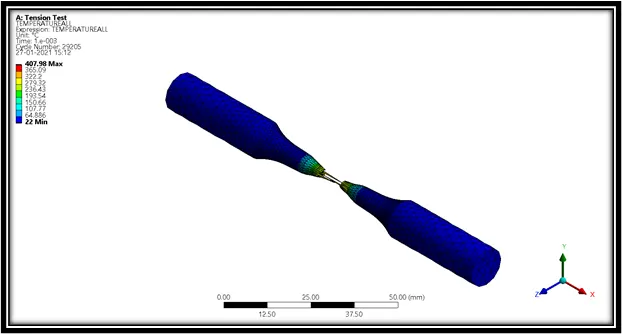
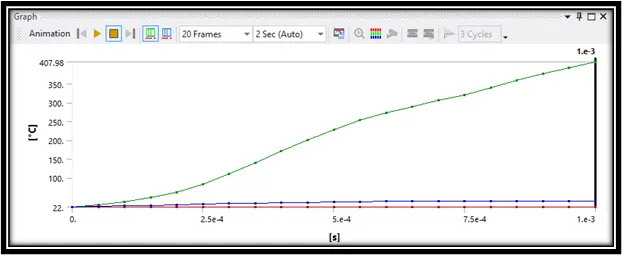
Temperature:
|
Time [s] |
Minimum [°C] |
Maximum [°C] |
Average [°C] |
|
|
1 |
1.18E-38 |
22 |
22 |
22 |
|
2 |
5.00E-05 |
22 |
28.005 |
23.422 |
|
3 |
1.00E-04 |
22 |
36.187 |
24.98 |
|
4 |
1.50E-04 |
22 |
46.679 |
26.54 |
|
5 |
2.00E-04 |
22 |
60.984 |
28.084 |
|
6 |
2.50E-04 |
22 |
81.788 |
29.593 |
|
7 |
3.00E-04 |
22 |
109.22 |
31.037 |
|
8 |
3.50E-04 |
22 |
139.34 |
32.375 |
|
9 |
4.00E-04 |
22 |
169.99 |
33.588 |
|
10 |
4.50E-04 |
22 |
200.59 |
34.676 |
|
11 |
5.00E-04 |
22 |
228.24 |
35.654 |
|
12 |
5.50E-04 |
22 |
252.85 |
36.541 |
|
13 |
6.00E-04 |
22 |
272.11 |
37.338 |
|
14 |
6.50E-04 |
22 |
287.5 |
37.966 |
|
15 |
7.00E-04 |
22 |
306.96 |
38.192 |
|
16 |
7.50E-04 |
22 |
319 |
38.276 |
|
17 |
8.00E-04 |
22 |
339.28 |
38.343 |
|
18 |
8.50E-04 |
22 |
358.37 |
38.399 |
|
19 |
9.00E-04 |
22 |
376.22 |
38.45 |
|
20 |
9.50E-04 |
22 |
393.03 |
38.494 |
|
21 |
1.00E-03 |
22 |
407.98 |
38.521 |
Simulation Video - https://drive.google.com/file/d/1Cz7BhjAiUfPE0M4aDspmWqQjZ6EvdfAD/view?usp=sharing
Torsion Test:
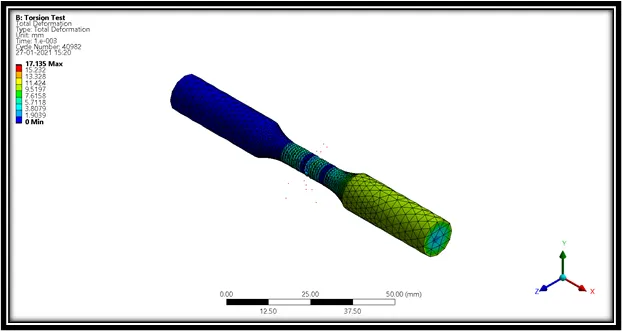
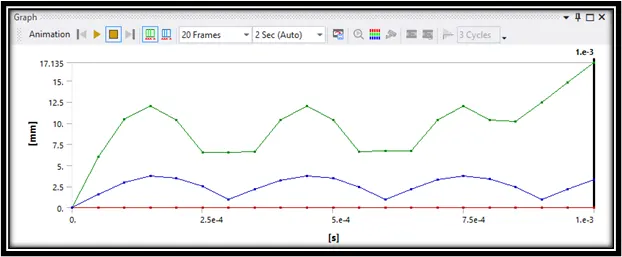
Total Deformation:
|
Time [s] |
Minimum [mm] |
Maximum [mm] |
Average [mm] |
|
|
1 |
1.18E-38 |
0 |
1.60E-15 |
3.28E-17 |
|
2 |
5.00E-05 |
0 |
6.0024 |
1.5598 |
|
3 |
1.00E-04 |
0 |
10.395 |
2.9813 |
|
4 |
1.50E-04 |
0 |
12 |
3.6994 |
|
5 |
2.00E-04 |
0 |
10.392 |
3.5098 |
|
6 |
2.50E-04 |
0 |
6.5433 |
2.4986 |
|
7 |
3.00E-04 |
0 |
6.5602 |
0.975 |
|
8 |
3.50E-04 |
0 |
6.5752 |
2.1351 |
|
9 |
4.00E-04 |
0 |
10.394 |
3.2417 |
|
10 |
4.50E-04 |
0 |
12 |
3.7327 |
|
11 |
5.00E-04 |
0 |
10.392 |
3.4486 |
|
12 |
5.50E-04 |
0 |
6.6195 |
2.4485 |
|
13 |
6.00E-04 |
0 |
6.6683 |
0.99802 |
|
14 |
6.50E-04 |
0 |
6.7165 |
2.1829 |
|
15 |
7.00E-04 |
0 |
10.393 |
3.2658 |
|
16 |
7.50E-04 |
0 |
12 |
3.7001 |
|
17 |
8.00E-04 |
0 |
10.392 |
3.3804 |
|
18 |
8.50E-04 |
0 |
10.211 |
2.3939 |
|
19 |
9.00E-04 |
0 |
12.434 |
0.99705 |
|
20 |
9.50E-04 |
0 |
14.767 |
2.2034 |
|
21 |
1.00E-03 |
0 |
17.135 |
3.2825 |
Simulation Video - https://drive.google.com/file/d/1eDBMzDnVcadD2XQS4zkdNCoTzVTbXgpp/view?usp=sharing
Equivalent Stress:
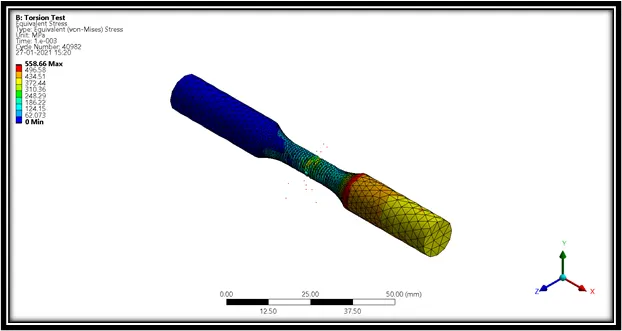
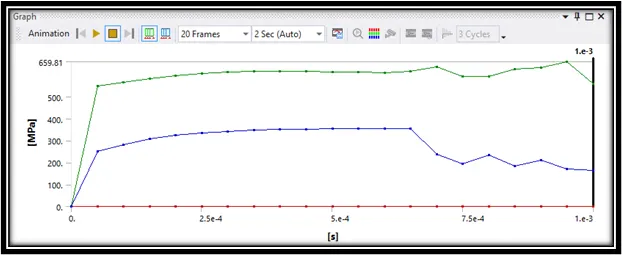
|
Time [s] |
Minimum [MPa] |
Maximum [MPa] |
Average [MPa] |
|
|
1 |
1.18E-38 |
0 |
0 |
0 |
|
2 |
5.00E-05 |
0 |
550.56 |
251.28 |
|
3 |
1.00E-04 |
0 |
566.19 |
281.9 |
|
4 |
1.50E-04 |
0 |
583.53 |
307.4 |
|
5 |
2.00E-04 |
0 |
597.53 |
324.64 |
|
6 |
2.50E-04 |
0 |
606.83 |
335.94 |
|
7 |
3.00E-04 |
0 |
612.16 |
342.26 |
|
8 |
3.50E-04 |
0 |
614.74 |
347.38 |
|
9 |
4.00E-04 |
0 |
614.8 |
350.43 |
|
10 |
4.50E-04 |
0 |
614.89 |
352.22 |
|
11 |
5.00E-04 |
0 |
613.84 |
354.11 |
|
12 |
5.50E-04 |
0 |
612.62 |
355.4 |
|
13 |
6.00E-04 |
0 |
610.1 |
355.41 |
|
14 |
6.50E-04 |
0 |
616.28 |
353.58 |
|
15 |
7.00E-04 |
0 |
635.65 |
238.96 |
|
16 |
7.50E-04 |
0 |
592.57 |
193.02 |
|
17 |
8.00E-04 |
0 |
592.4 |
233.24 |
|
18 |
8.50E-04 |
0 |
626.62 |
182.91 |
|
19 |
9.00E-04 |
0 |
633.06 |
210.33 |
|
20 |
9.50E-04 |
0 |
659.81 |
170.38 |
|
21 |
1.00E-03 |
0 |
558.66 |
163.99 |
Simulation Video - https://drive.google.com/file/d/1R0ssIbAs7yIRA-sOiHMoaZHkW42qKxCA/view?usp=sharing
Temperature:
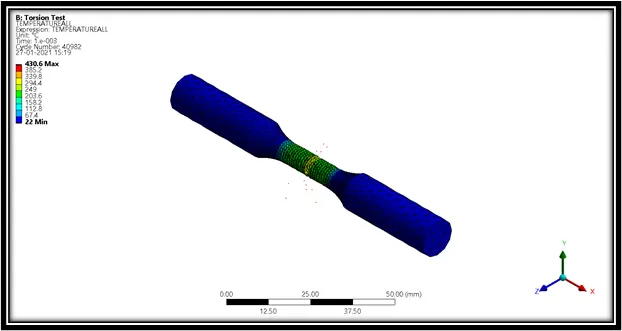
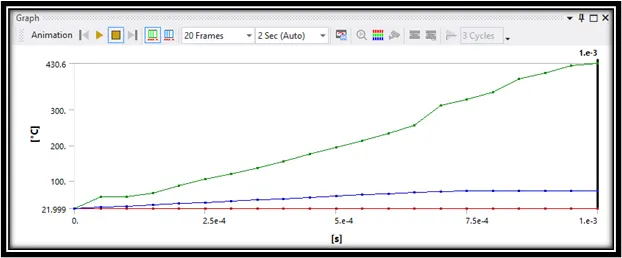
|
Time [s] |
Minimum [°C] |
Maximum [°C] |
Average [°C] |
|
|
1 |
1.18E-38 |
22 |
22 |
22 |
|
2 |
5.00E-05 |
22 |
54.627 |
26.165 |
|
3 |
1.00E-04 |
22 |
54.59 |
29.171 |
|
4 |
1.50E-04 |
22 |
66.058 |
32.321 |
|
5 |
2.00E-04 |
21.999 |
86.172 |
35.597 |
|
6 |
2.50E-04 |
22 |
104.24 |
38.966 |
|
7 |
3.00E-04 |
22 |
120.43 |
42.406 |
|
8 |
3.50E-04 |
22 |
137.1 |
45.905 |
|
9 |
4.00E-04 |
22 |
155.74 |
49.458 |
|
10 |
4.50E-04 |
22 |
174.88 |
53.061 |
|
11 |
5.00E-04 |
22 |
194.2 |
56.708 |
|
12 |
5.50E-04 |
22 |
213.55 |
60.401 |
|
13 |
6.00E-04 |
22 |
233.44 |
64.139 |
|
14 |
6.50E-04 |
22 |
257.35 |
67.901 |
|
15 |
7.00E-04 |
22 |
311.94 |
70.456 |
|
16 |
7.50E-04 |
22 |
329.19 |
71.156 |
|
17 |
8.00E-04 |
22 |
350.21 |
71.498 |
|
18 |
8.50E-04 |
22 |
387.16 |
71.793 |
|
19 |
9.00E-04 |
22 |
402.86 |
72.047 |
|
20 |
9.50E-04 |
22 |
424.84 |
72.221 |
|
21 |
1.00E-03 |
22 |
430.6 |
72.32 |
Simulation Video - https://drive.google.com/file/d/1oBe50R2MYgct8_P0nJKikWt2uSJg4Qsr/view?usp=sharing
Tabulation:
|
Tests |
Max. Total Deformation (mm) |
Max. Equivalent Stress (MPa) |
Max. Temperature (°C) |
|
Tension Test |
18.002 |
647.73 |
407.98 |
|
Torsion Test |
17.135 |
659.81 |
430.6 |
Conclusion:
In general, we can say that during Tension test there is breakage to the material, but in Tension test we can see that there is rupture in the material and not much of breakage in it for the given values.
From the Max. Total Deformation results we can conclude that there is more deformation during tension test than torsion test.
While considering Max. Equivalent Stress we can see that there is more stress experienced during torsion test as compared to tension test.
Finally, while comparing the results of Max. Temperature of the both the tests we can see there is more heat experienced during torsion test on the model than tension test.