Battery Characteristics using UDDS Drive Cycle
Aim:
To simulate the generic battery model charge and discharge using UDDS data in MATLAB.
Theory:
Drive Cycle:
A driving cycle is a series of data points representing the speed of a vehicle versus time.
Driving cycles are produced by different countries and organizations to assess the performance of vehicles in various ways, as for instance fuel consumption, electric vehicle autonomy and polluting emissions.
Fuel consumption and emission tests are performed on chassis dynamometers. Tailpipe emissions are collected and measured to indicate the performance of the vehicle.
Another use for driving cycles is in vehicle simulations. More specifically, they are used in propulsion system simulations to predict performance of internal combustion engines, transmissions, electric drive systems, batteries, fuel cell systems, and similar components.
Some driving cycles are derived theoretically, as it is preferred in the European Union, whereas others are direct measurements of a driving pattern deemed representative.
There are two types of driving cycles:
Transient driving cycles involve many changes, representing the constant speed changes typical of on-road driving.
Modal driving cycles involve protracted periods at constant speeds.
We will also study about the BATTERY-TECHNOLOGY and HEV in general.
UDDS:
UDDS stands for Urban Dynamometer Driving Schedule, and refers to a United States Environmental Protection Agency mandated dynamometer test on fuel economy that represents city driving conditions which is used for light duty vehicle testing.
It is also known as U.S. FTP-72 (Federal Test Procedure) cycle, LA-4 cycle, in Sweden as A10 or CVS (Constant Volume Sampler) cycle and in Australia as the ADR 27 (Australian Design Rules) cycle.
Though it was originally created as a reference point for fossil fuelled vehicles, it is also used to give estimates on how many miles an electric vehicle will travel on a single charge.
Model:
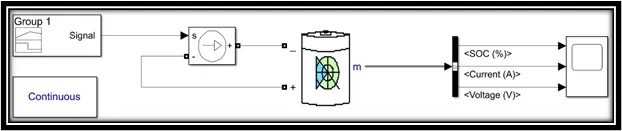
In this above model we use following blocks:
- Signal builder:
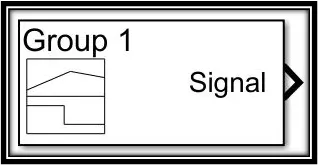
The Signal Editor block displays, creates, and edits interchangeable scenarios. You can also use the block to switch scenarios in and out of models.
The Signal Editor block supports MAT-files that contain one or more scalar Simulink data objects.
You can port Signal Builder block configurations to the Signal Editor block using the signal builder function.
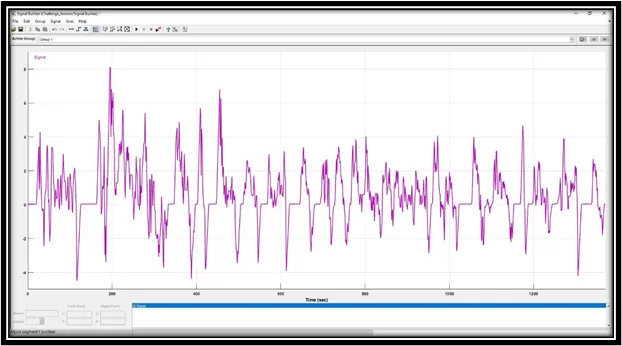
By using this block, we can give UDDS cycle current as input, for this we have to import the UDDS cycle into signal builder block.
Importing excel data of UDDS cycle:
The excel data cannot be directly imported into the signal builder block so, we must first import the values of UDDS drive cycle into the MATLAB base workspace under separate variables as time and current. Now, we must click the signal blocker block and we must click the option Signal ---> New ---> Custom and in the place of time values enter time and in the place of Y values enter current. After we enter these values the signal builder will be seen as follows,
- Controlled current source:
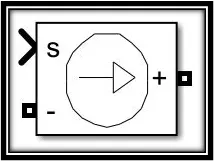
The Controlled Current Source block converts the Simulink® input signal into an equivalent current source. The generated current is driven by the input signal of the block. The positive current direction is as shown by the arrow in the block icon.
You can initialize the Controlled Current Source block with a specific AC or DC current. If you want to start the simulation in steady state, the block input must be connected to a signal starting as a sinusoidal or DC waveform corresponding to the initial values.
- Generic battery model:
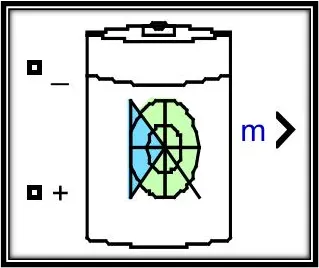
The Battery block implements a generic dynamic model that represents most popular types of rechargeable batteries.
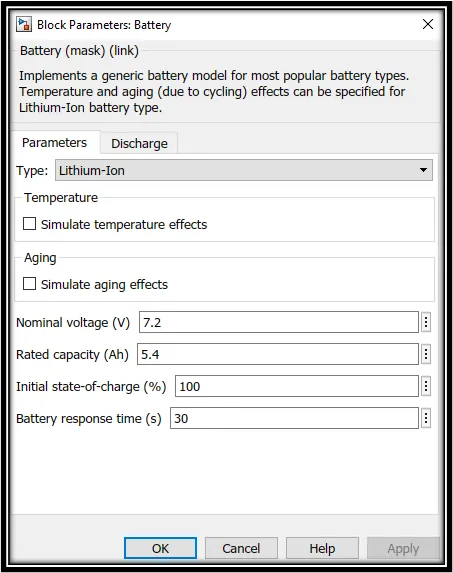
Here we will be using the lithium-ion battery and the specifications of the battery is as follows,
- Bus selector:
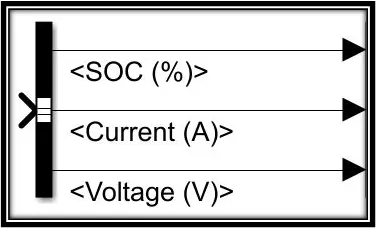
The Bus Selector block outputs the elements you select from the input bus. The block can output the selected elements separately or in a new virtual bus.
- Scope:
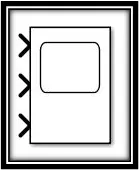
The Scope block displays its input with respect to simulation time. The Scope block can have multiple axes (one per port); all axes have a common time range with independent y-axes. The Scope allows you to adjust the amount of time and the range of input values displayed.
- Powergui:
The Powergui block is necessary for simulation of any Simulink model containing SimPowerSystems blocks. It is used to store the equivalent Simulink circuit that represents the state-space equations of the model.
Output:
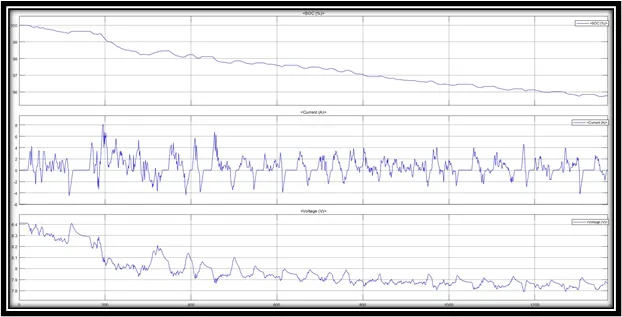
State of Charge of the battery:

The State of charge of the battery is as shown in the figure below. We have given initial SOC as 100%. The increase and decrease of SOC shows charging and discharging of battery.
Battery Current:

The above figure shows the battery current profile. The positive current shows battery discharge current during vehicle acceleration. The negative current shows battery charging current during vehicle braking.
Battery Voltage:

The above figure shows the battery voltage profile. The increase in the voltage occurs due to the battery charging during vehicle braking and the decrease in the voltage occurs due to the battery discharing during vehicle acceleration.
Result:
The simulation for the charge and discharge of the generic battery model was done using the UDDS drive cycle.