Project 1 - Parsing NASA thermodynamic data
AIM:
To determine the thermodynamical properties such as SPECIFIC HEAT,ENTROPY, and ENTHALPY and to calculate molecular weight of atoms through NASA thermodynamics data file.
DESCRIPTION:
Specific Heat:
The amount of heat required to rise temperature of 1 kg of a body through unit degree C.
Entropy:
The measure of disorder of a system
Enthalpy:
The measure of heat absorbed or heat rejected in a system
PROGRAM:
* clear all,close all,clc to give commands for close the variables,plots and command window respectively.
* Value of the UNIVERSAL GAS CONSTANT R is given as 8.314
* Give fopen for reading the thermodynamics data file and opening it.
* r is used for reading and w is used to write a text in the new file
* Header is used to read the 1st line.
* The 1st three lines are to be omitted and it is done through 'for loop'
* Give 'linspace' for using local temperature range between 300-1000, with 200 values.
* 'For loop' is used for reading of species is to be done.
* Next extracting of coefficieent of species is done
* 'strfind' is used to find the position of E
* 'str2num' is used for converting the numeric array.
* The first line represents species name and global temperature, the 1st 7 values are high temperature coefficients and other 7 values are low temperature coefficients.
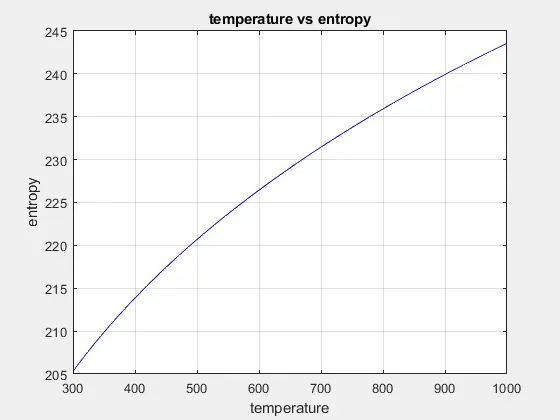
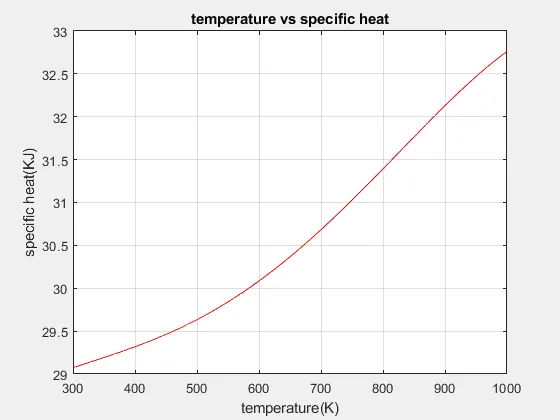
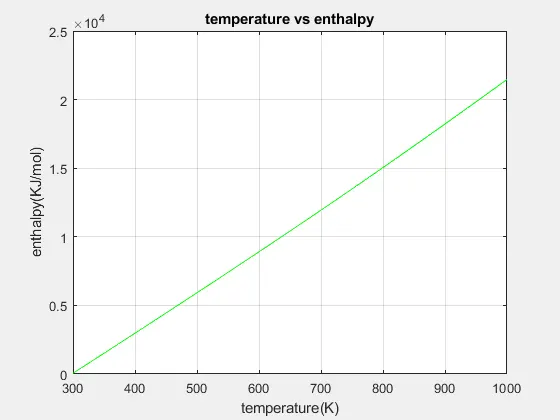
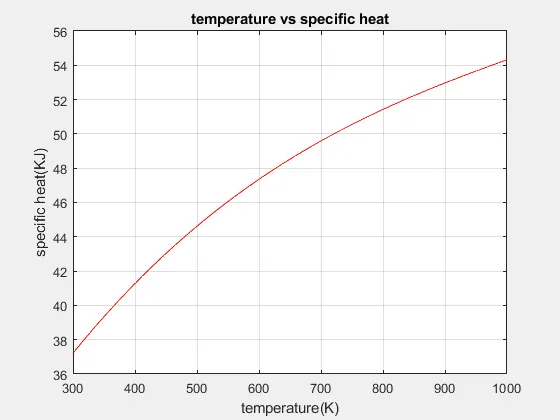
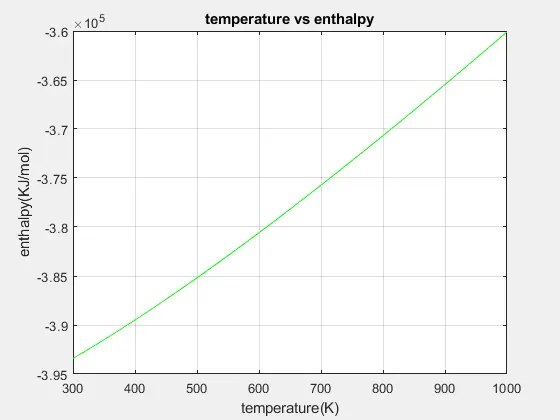
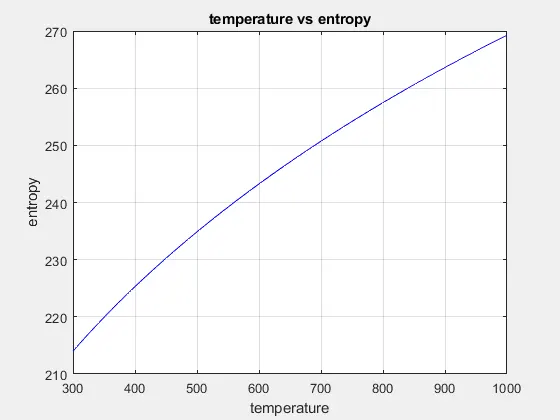
* Next the creation of folder and plotting the temperature vs CP,S,H are done by using plotting commands.

* This shows formulae used to find three values for plotting the graphs.
* if else' is used in generating the values for the properties. If t is greater than 1000, then the high temperatuew coefficients are used or else low temperature is used.
* Molecular weight is to be found and put in the separate folder. 'strcmpi' is used to compare the string case..
* MW=MW+atomic_weight(position)*(n-1);
* The main code for the program is given below.
clear all
close all
clc

%universal gas constant
R = 8.314

%opening data file and reading
f1=fopen('THERMO.dat','r')
f2=fopen('Mol weight.txt','w')
header=fgetl(f1)

%reading global temp
l1=fgetl(f1);

%omitting lines
for i=1:3
    l2=fgetl(f1)
end

T=linspace(300,1000,200)

for i=1:52
    l3=fgetl(f1);
    A=strsplit(l3,' ');

    species=strtok(l3,' ');

    %extracting the coefficient of species
    a=fgetl(f1);
    b=fgetl(f1);
    c=fgetl(f1);

    %finding position of E
    d=strfind(a,'E');
    e=strfind(b,'E');
    f=strfind(c,'E');

    %extracting high temp coef
    a1=str2num(a(1:d(1)+3));
    a2=str2num(a(d(1)+4:d(2)+3));
    a3=str2num(a(d(2)+4:d(3)+3));
    a4=str2num(a(d(3)+4:d(4)+3));
    a5=str2num(a(d(4)+4:d(5)+3));
    a6=str2num(b(1:e(1)+3));
    a7=str2num(b(e(1)+4:e(2)+3));

    %extracting low temp coef
    b1=str2num(b(e(2)+4:e(3)+3));
    b2=str2num(b(e(3)+4:e(4)+3));
    b3=str2num(b(e(4)+4:e(5)+3));
    b4=str2num(c(1:f(1)+3));
    b5=str2num(c(f(1)+4:f(2)+3));
    b6=str2num(c(f(2)+4:f(3)+3));
    b7=str2num(c(f(3)+4:f(4)+3));

    %specific heat,enthalpy,entropy,molecular weight
    [CP]=specificheat(a1,a2,a3,a4,a5,b1,b2,b3,b4,b5,T,R);
    [H]=enthalpy(a1,a2,a3,a4,a5,a6,b1,b2,b3,b4,b5,b6,T,R);
    [S]=entropy(a1,a2,a3,a4,a5,a7,b1,b2,b3,b4,b5,b7,T,R);
    [MW]=mol_wt(species);

    %creating folder for species
    mkdir(species);
    current_dir=pwd;
    cd(species)

    %plotting
    %temp vs specific heat
    figure(1)
    plot(T,CP,'color','r')
    xlabel('temperature(K)');
    ylabel('specific heat(KJ)');
    title('temperature vs specific heat');
    grid on
    image = getframe(gcf);
    imwrite(image.cdata,'T vs CP.png')
    saveas(1,'specific heat','jpg')

    %temp vs enthalpy
    figure(2)
    plot(T,H,'color','g')
    xlabel('temperature(K)');
    ylabel('enthalpy(KJ/mol)');
    title('temperature vs enthalpy');
    grid on
    image = getframe(gcf);
    imwrite(image.cdata,'T vs H.png')
    saveas(1,'enthalpy','jpg')


    % temp vs entropy
    figure(3)
    plot(T,S,'color','b')
    xlabel('temperature');
    ylabel('entropy');
    title('temperature vs entropy');
    grid on
    image = getframe(gcf);
    imwrite(image.cdata,'T vs S.png')
    saveas(1,'entropy','jpg')

    %changing the current folder

    cd(current_dir);
    fprintf(f2,'Molecular weight of %s is %f n',species);

end
    fclose(f2);
    fclose(f1);
* The codes for the respective functions are defined below:
For entropy:
function S = entropy(a1,a2,a3,a4,a5,a7,b1,b2,b3,b4,b5,b7,T,R)
t=1000

%calculating entropy
if T > t

    S=(a1.*log(T)+a2.*T+a3.*(T.^2)./2+a4.*(T.^3)./3+a5.*(T.^4)./4+a7).*R;
else
    S=(b1.*log(T)+b2.*T+b3.*(T.^2)./2+b4.*(T.^3)./3+b5.*(T.^4)./4+b7).*R;
end
For Enthalpy:
function H = enthalpy(a1,a2,a3,a4,a5,a6,b1,b2,b3,b4,b5,b6,T,R)
t = 1000
% calculating enthalpy
if T > t
    H=(a1.*T+(a2.*T.^2)./2+(a3.*T.^3)./3+(a4.*T.^4)./4+(a5.*T.^5)./5+a6).*R;
else
    H=(b1.*T+(b2.*T.^2)./2+(b3.*T.^3)./3+(b4.*T.^4)./4+(b5.*T.^5)./5+b6).*R;
end
For Specific Heat:
function CP = specificheat(a1,a2,a3,a4,a5,b1,b2,b3,b4,b5,T,R)
t=1000

%calculating specific heat
if T > t
    CP=(a1+a2.*T+a3.*T.^2+a4.*T.^3+a5.*T.^4).*R;
else
    CP=(b1+b2.*T+b3.*T.^2+b4.*T.^3+b5.*T.^4).*R;
end
For Molecular Weight:
%calculating molecular weight

function MW = mol_wt(species)
elements = ['H','O','C','N','A'];
atomic_weight = [1,16,12,14,40];
MW=0;

%addition of atomic number

for i=1:length(species)
    for j=1:length(elements)

        if strcmpi(species(i),elements(j))==1

        MW=MW+atomic_weight(j);
        position=j
        end
    end
    n=str2num(species(i));
    if n>1
        MW=MW+atomic_weight(position)*(n-1);
    end
end
disp(['Mol weight of',species,'is']);
disp(MW)
end
OUTPUT DATA:
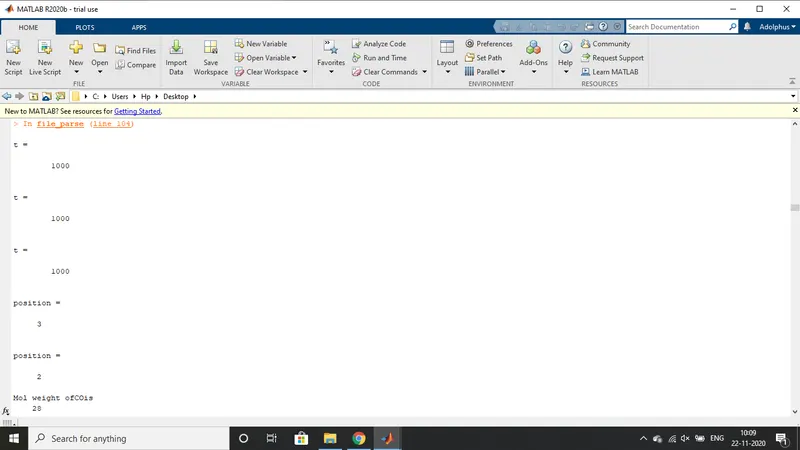
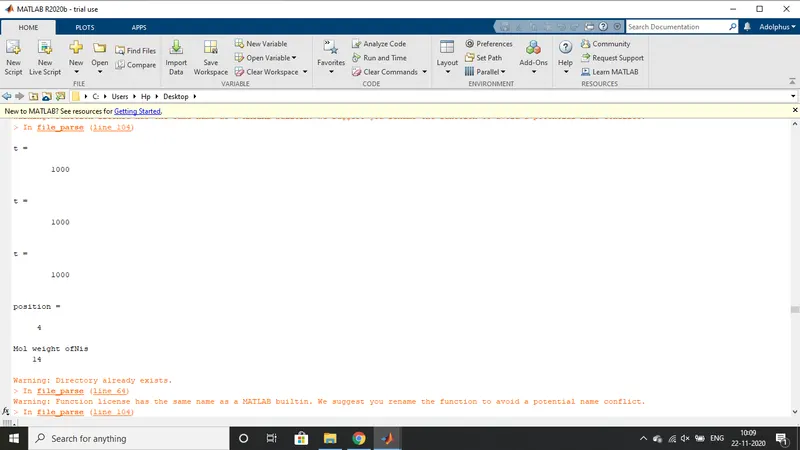
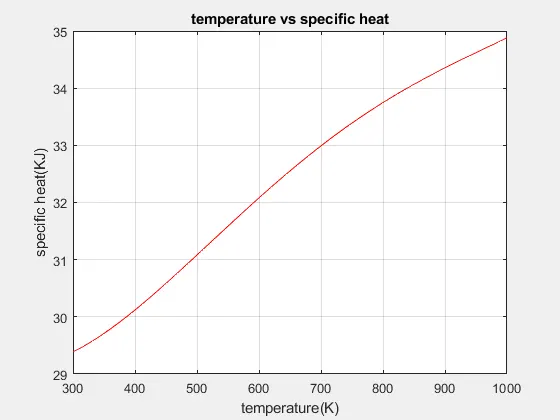
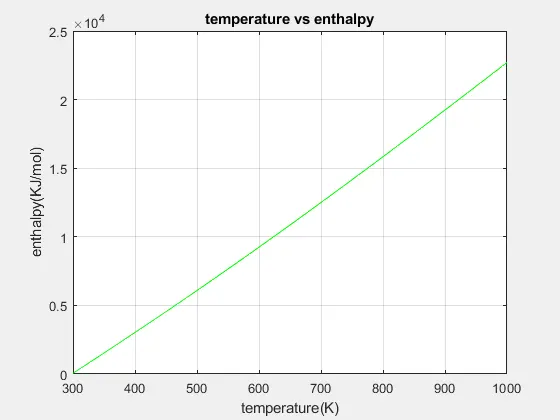
For O2:
For N2:
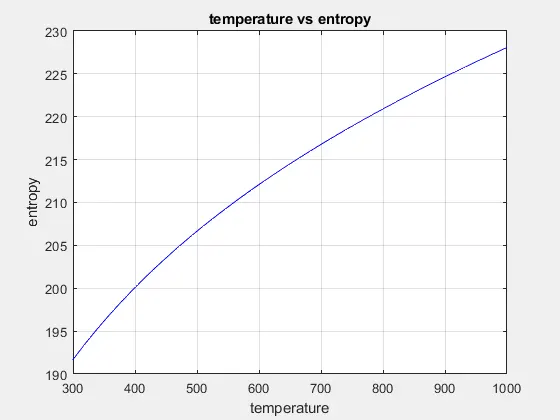
For CO2:
Folders containing in the window:
RESULT:
Hence, The file parsing is done.
The graph for N2,O2,CO2 is plotted.
Molecular weight of the elements are found
Files are created.