Week 11: FSAE Car Project
AIM
The aim is to simulate the Aerodynamics Behaviour of FSAE Car
OBJECTIVE
ABCD Racing company is looking to perform Aero Simulations for their FSAE vehicle and they have hired you to do the job. The suspension team wants a detailed report on the total downforce on individual components. They have two races in this upcoming season.
Race details are as follows
Race-1
- Racing track conditions - Lot of turns
- Average lap speeds - 45kmph
- 70% turns at 45 degrees
- 20% turns at 80 degrees
- 10% turns at 20 degrees
Race-2
- Racing track conditions - Straights
- Average lap speed - 75kmph
FSAE CAR
The following are the rules for FSAE Car
Engine
The engine must be a four-stroke, Otto-cycle piston engine with a displacement no greater than 710cc. An air restrictor of circular cross-section must be fitted downstream of the throttle and upstream of any compressor, with a diameter no greater than 20mm for gasoline engines, forced induction or naturally aspirated, or 19mm for ethanol-fueled engines. The restrictor keeps power levels below 100 hp in the vast majority of FSAE cars. Most commonly, production four-cylinder 600cc sport bike engines are used due to their availability and displacement. However, there are many teams that use smaller V-twin and single-cylinder engines, mainly due to their weight-saving and packaging benefits. Very rarely do teams build an engine from scratch, few examples include Western Washington University's 554cc V8 entry in 2001, University of Melbourne's "WATTARD" engine in 2003–2004, and University of Auckland's V twin.
Suspension
The suspension is unrestricted save for safety regulations and the requirement to have 50mm total of wheel travel. Most teams opt for four-wheel independent suspension, almost universally double-wishbone. Active suspension is legal.
Aerodynamics
Complex aerodynamic packages, while not required to compete at competition are common among the fastest teams at competition. With the low speeds of the FSAE competition rarely exceeding 60 mph (97 km/h), designs must be thoroughly justified in the design judging event through wind tunnel testing, computational fluid dynamics, and on track testing. Aerodynamic devices are regulated through maximum size and powered aerodynamic devices are outlawed.
Weight
There is no weight restriction. The weight of the average competitive Formula SAE car is usually less than 440 lb (200 kg) in race trim. However, the lack of weight regulation combined with the somewhat fixed power ceiling encourages teams to adopt innovative weight-saving strategies, such as the use of composite materials, elaborate and expensive machining projects, and rapid prototyping. In 2009 the fuel economy portion of the endurance event was assigned 100 of the 400 endurance points, up from 50. This rules change has marked a trend in engine downsizing in an attempt to save weight and increase fuel economy. Several top-running teams have switched from high-powered four-cylinder cars to smaller, one- or two-cylinder engines which, though they usually make much less power, allow weight savings of 75 lb (34 kg) or more, and also provide much better fuel economy. If a lightweight single-cylinder car can keep a reasonable pace in the endurance race, it can often make up the points lost in overall time to the heavier, high-powered cars by an exceptional fuel economy score.
- Example: At the 2009 Formula SAE West endurance event, third-place finishers Rochester Institute of Technology completed the endurance course in 22 minutes, 45 seconds with their four-cylinder car, while fourth-place finishers Oregon State University finished in 22 minutes, 47 seconds with their single-cylinder car; this gave RIT 290.6 of 300 points for the race portion of the event and OSU 289.2 points. However, OSU used the least fuel of any car (.671 US gal (2.54 l), or 20.3 mpg‑US (0.116 l/km) over the entire endurance race) and received the full 100 points for fuel economy, while RIT used 1.163 US gal (4.40 l) (11.75 mpg‑US (0.2002 l/km)) and was thus only awarded 23.9 of the available points. RIT went on to win the overall competition by only 8.9 points over OSU, having scored slightly better in all of the other dynamic events.
Safety
The majority of the regulations pertain to safety. Cars must have two steel roll hoops of designated thickness and alloy, regardless of the composition of the rest of the chassis. There must be an impact attenuator in the nose, and impact testing data on this attenuator must be submitted prior to competing. Cars must also have two hydraulic brake circuits, full five-point racing harnesses, and must meet geometric templates for driver location in the cockpit for all drivers competing. Tilt-tests ensure that no fluids will spill from the car under heavy cornering, and there must be no line-of-sight between the driver and fuel, coolant, or oil lines.
FSAE CAR SIMULATION STRAIGHT TRACK
Geometry File
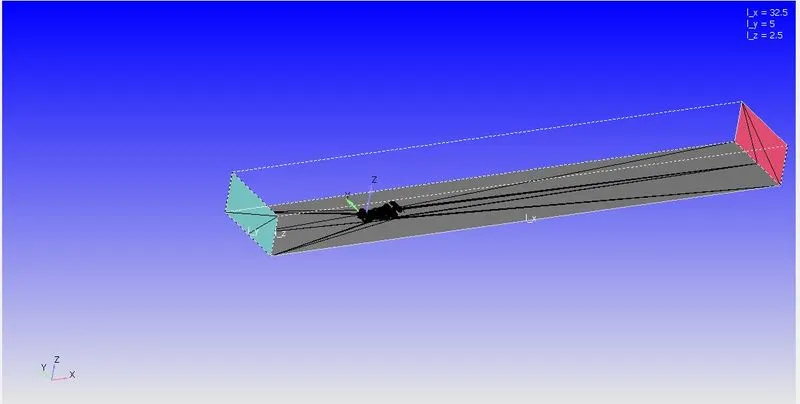
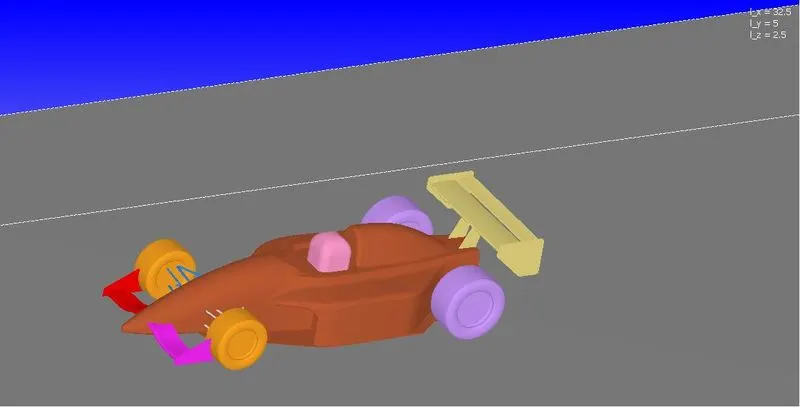
In this case, the FSAE car is placed in a straight track wind tunnel. The wind tunnel dimensions are shown in the first image.
Mesh
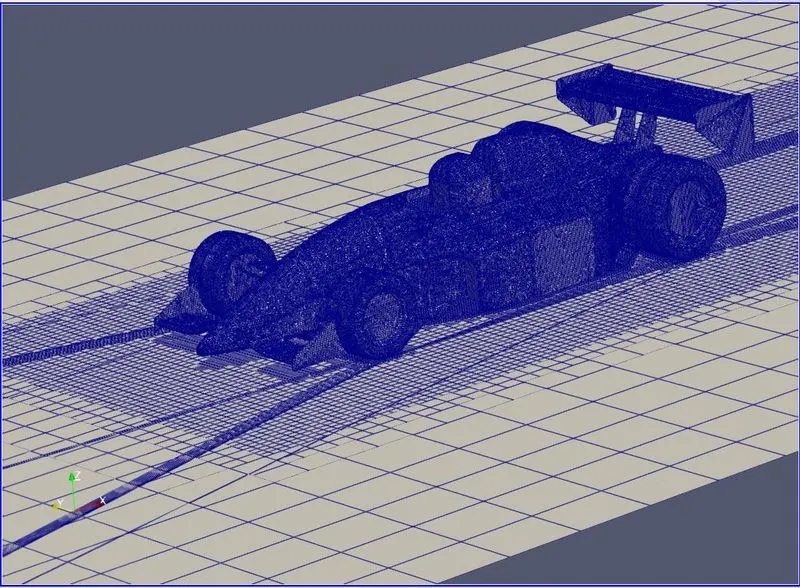
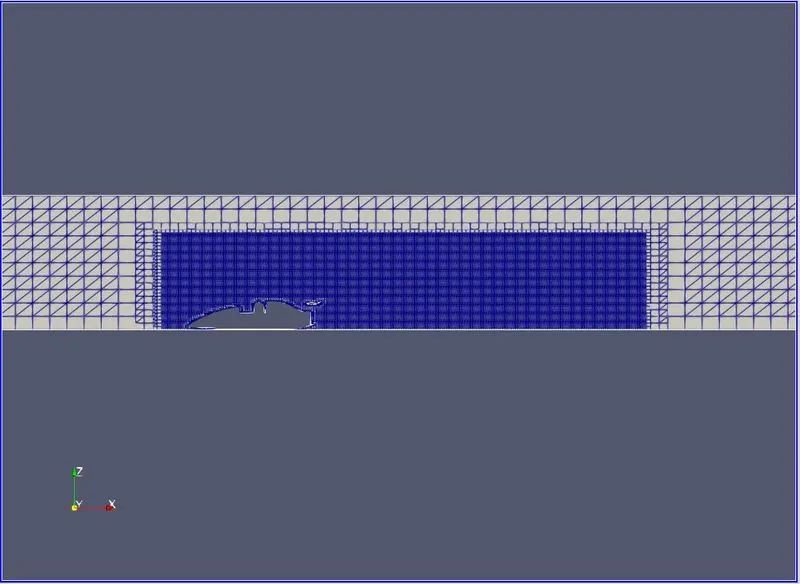
Setup
- Fluid - Air
- Species - N2 & O2
- Solver - Transient
- Start Time - 0 s
- End Time - 1.9s
- Turbulence Model - K - Omega SST
Boundary Conditions
Inlet
- Inlet - Inflow
- Velocity = 12.5 m/s
- Temperarture = 300 K
Outlet
- Outlet - Outflow
- Pressure = 101325 Pa
- Temperarture = 300 K
Car Components
- Law of wall
- Wall BC
Results
Velocity Contour
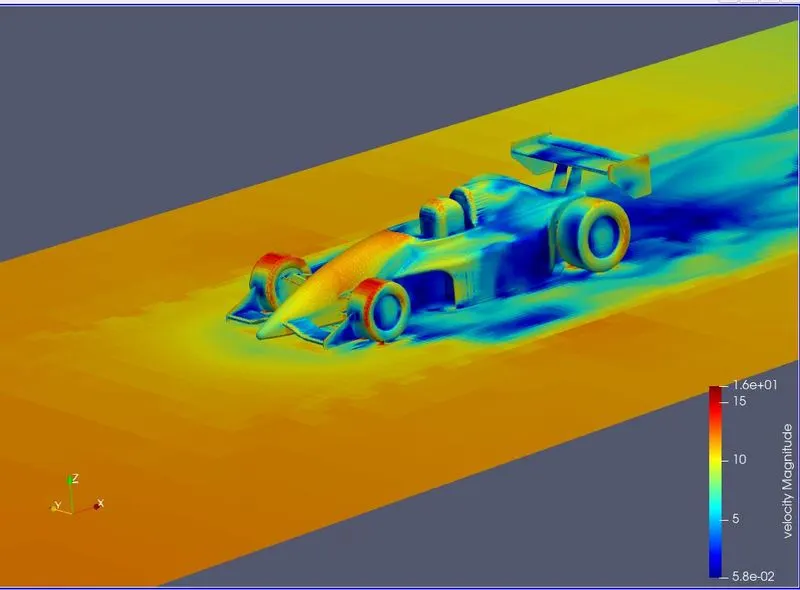
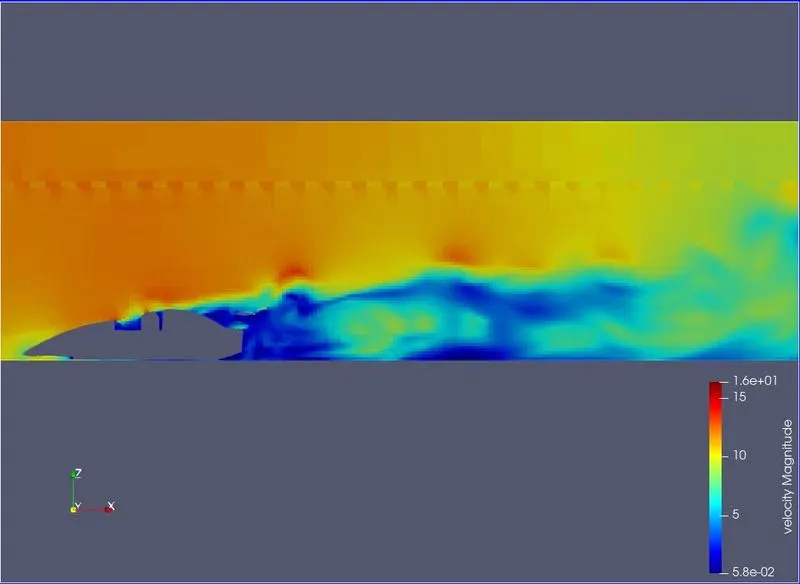
Forces Report Nomenclature
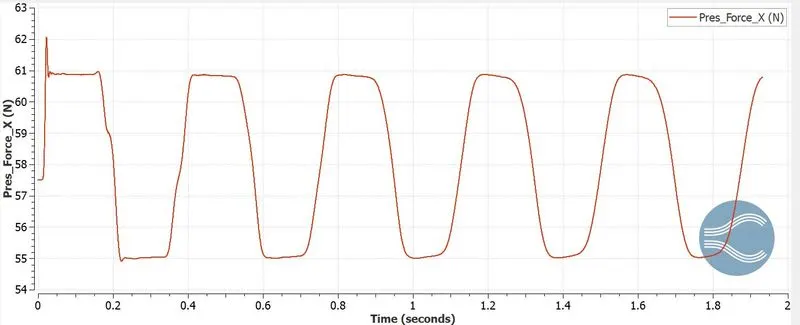
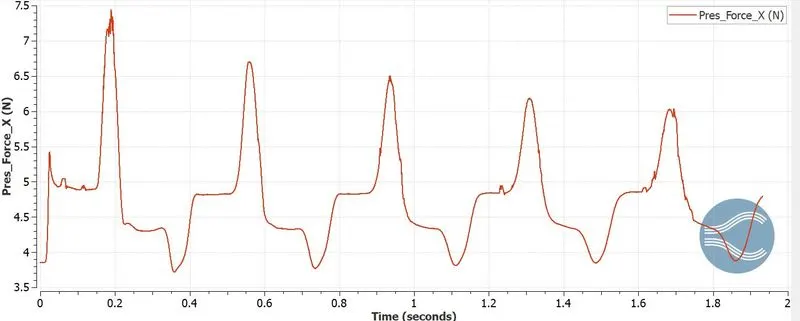
Pressure_force_X = Drag Force
Pressure_Force_Z - Downforce Force
Body
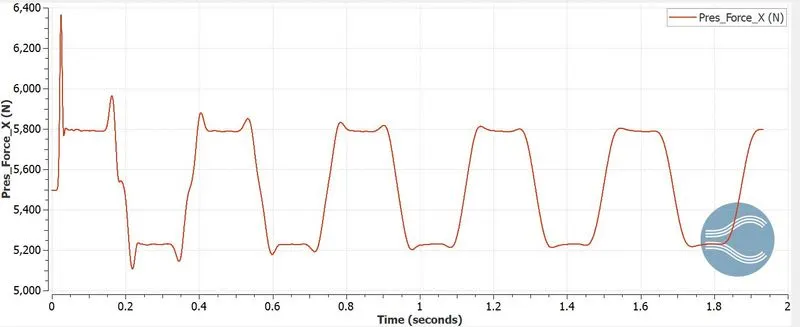
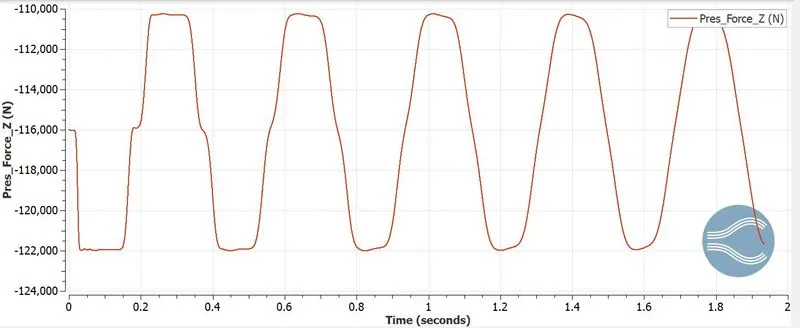
Rear Wing
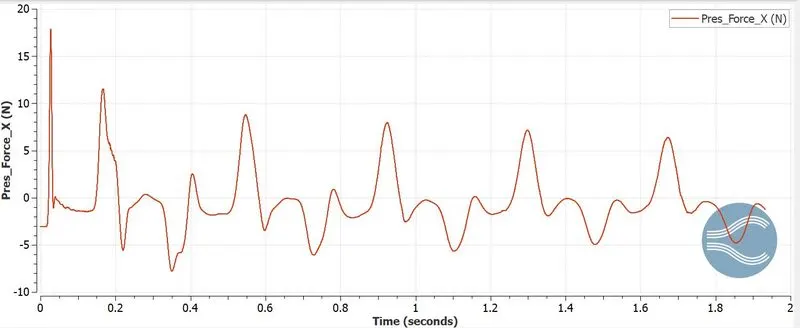
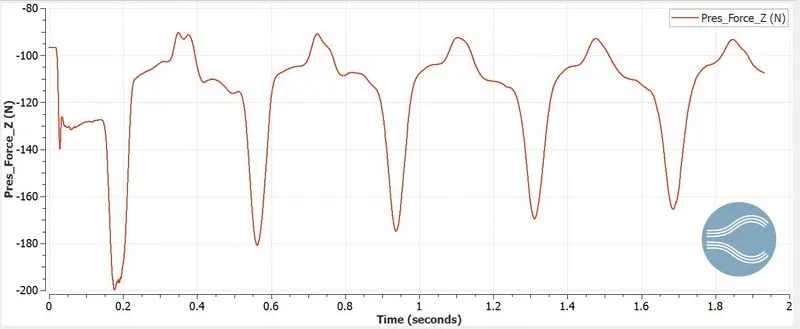
Front Wheels
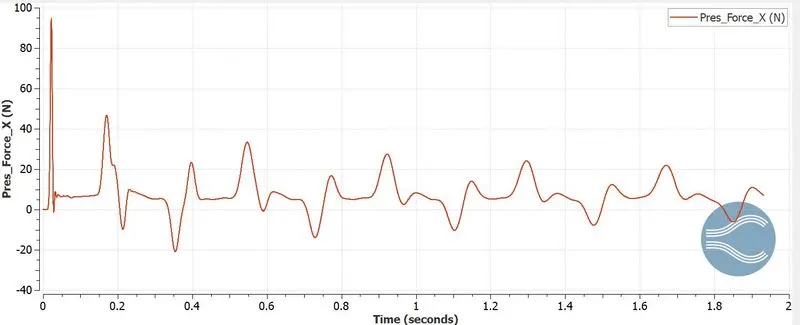
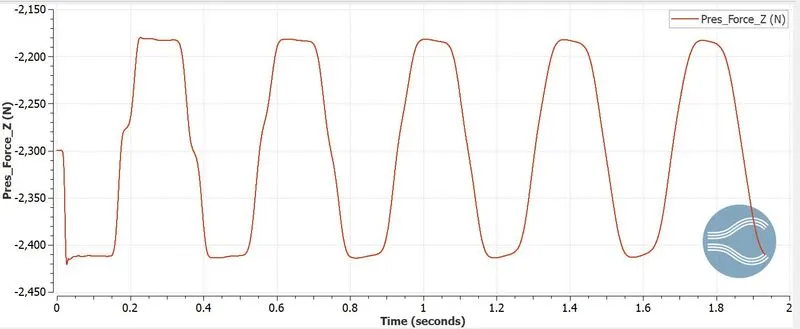
Rear Wheels
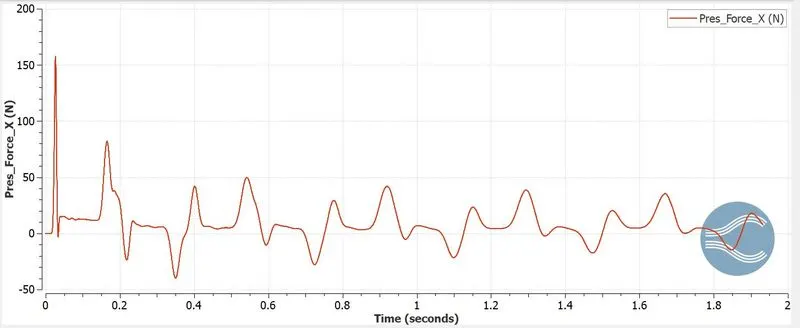
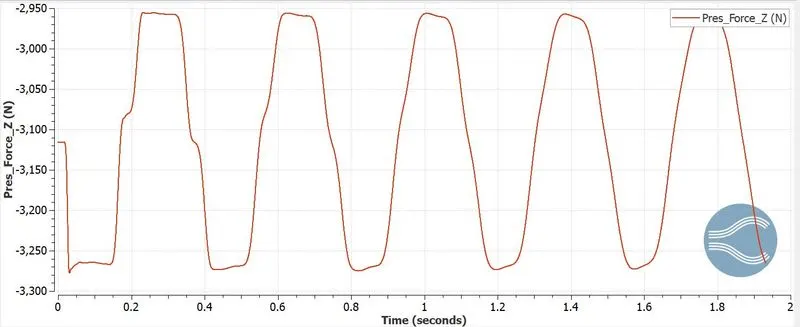
Front Wing
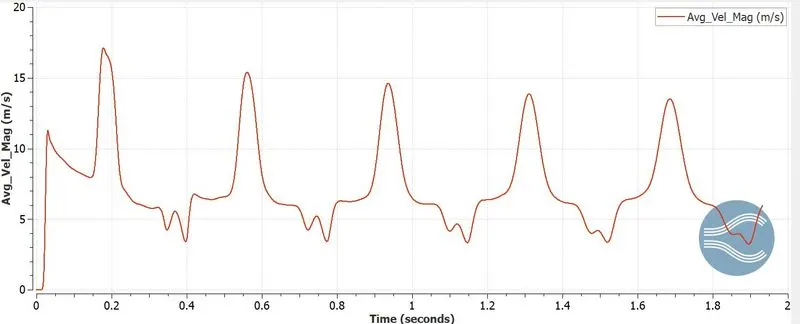
Velocity Plot
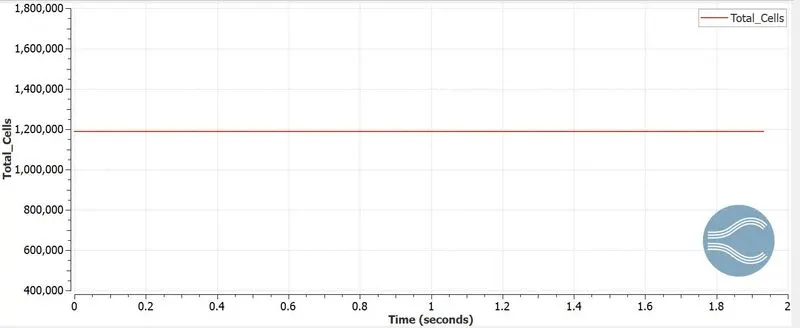
Cell Count
FSAE CAR SIMULATION TURNS CASE
Geometry File
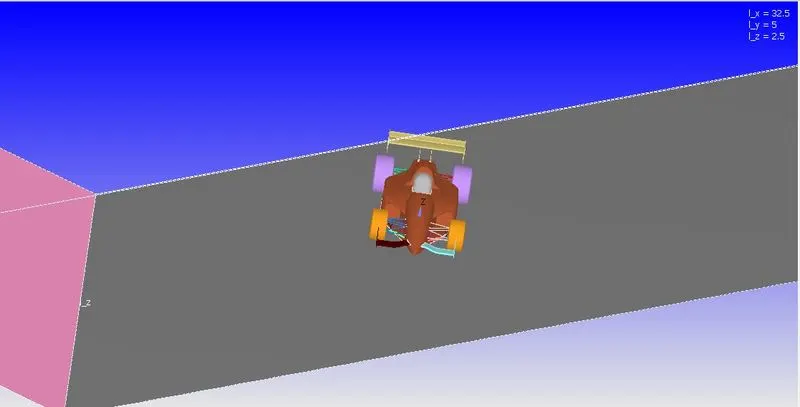
In this case, the FSAE car is placed in a wind tunnel. The wind tunnel dimensions are shown in the first image.
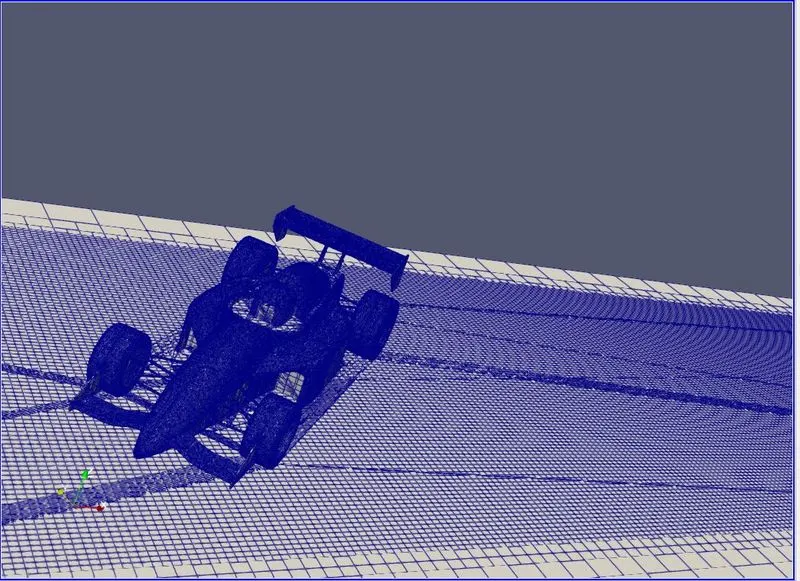
Mesh
Setup
- Fluid - Air
- Species - N2 & O2
- Solver - Transient
- Start Time - 0 s
- End Time - 1.9s
- Turbulence Model - K - Omega SST
Boundary Conditions
Inlet
- Inlet - Inflow
- Velocity = 20.63 m/s
- Temperature = 300 K
Outlet
- Outlet - Outflow
- Pressure = 101325 Pa
- Temperature = 300 K
Car Components
- Law of wall
- Wall BC
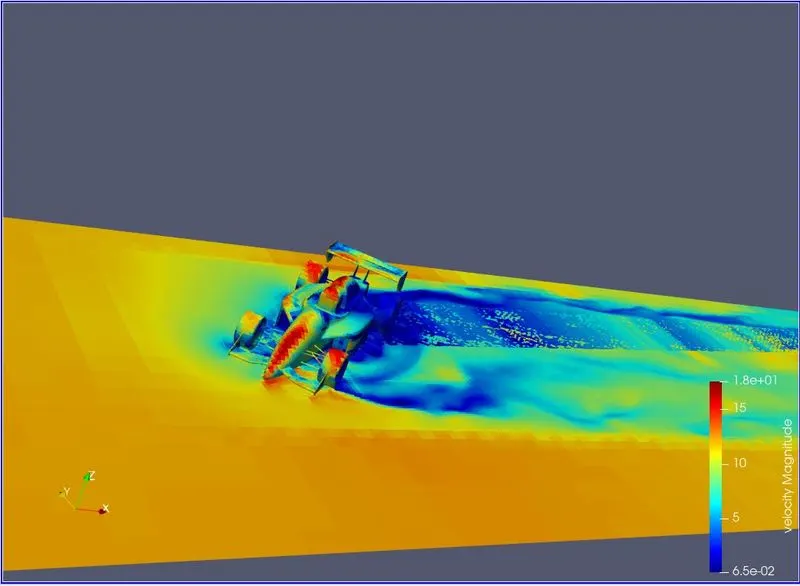
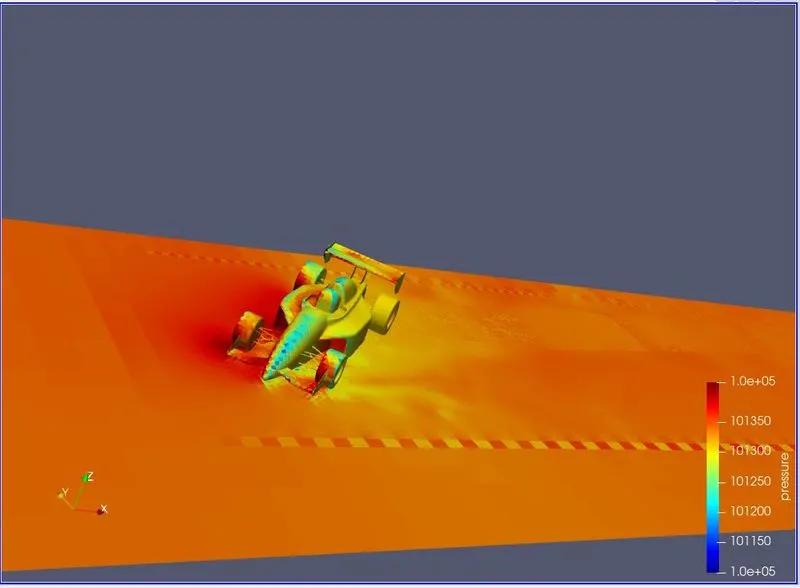
Results
Velocity Contour
Pressure Contour
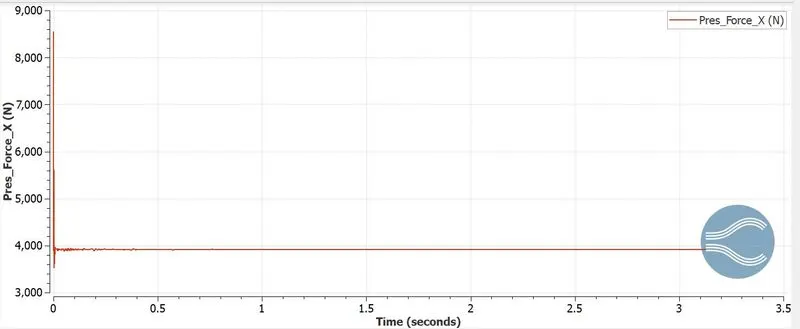
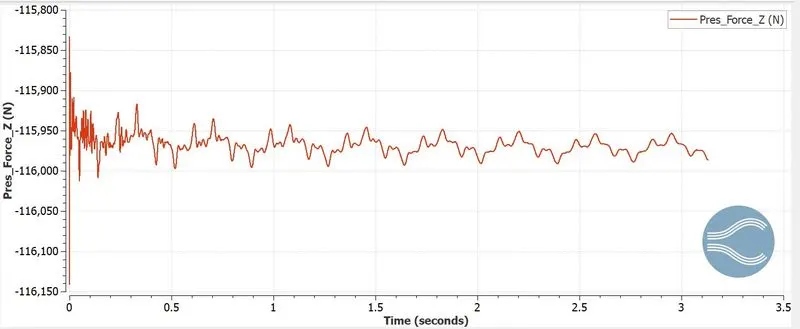
Forces Report Nomenclature
Pressure_force_X = Drag Force
Pressure_Force_Z - Downforce Force
Body
Rear Wing
Front Wheels
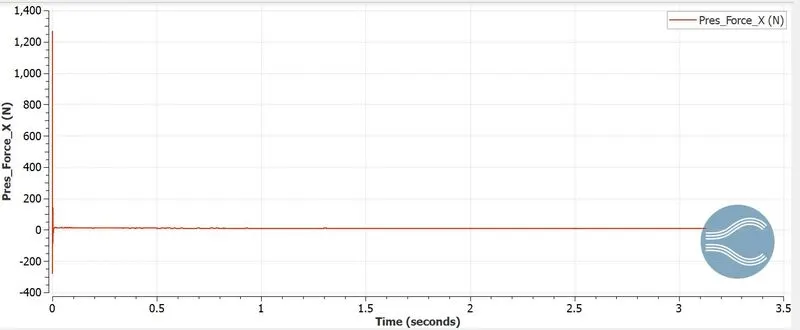
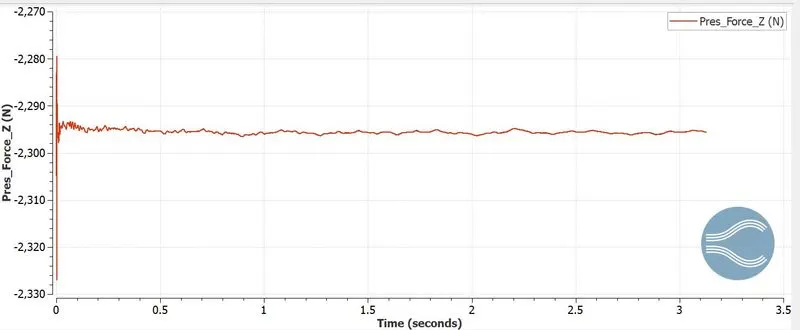
Rear Wheels
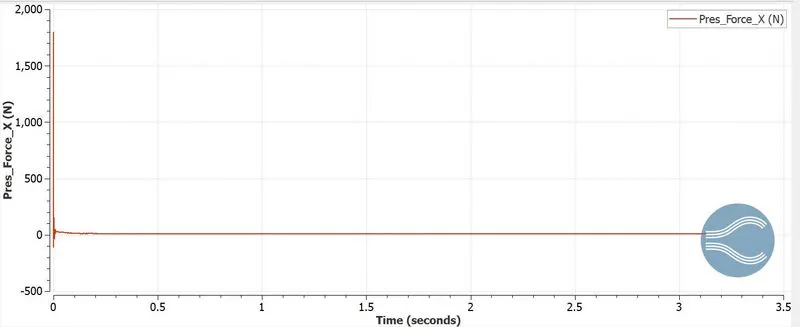
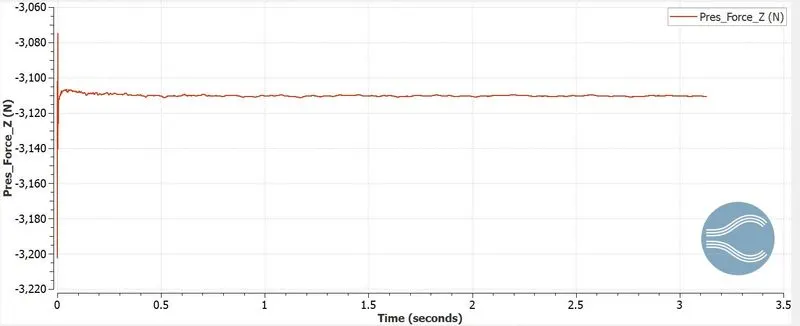
Front Wing
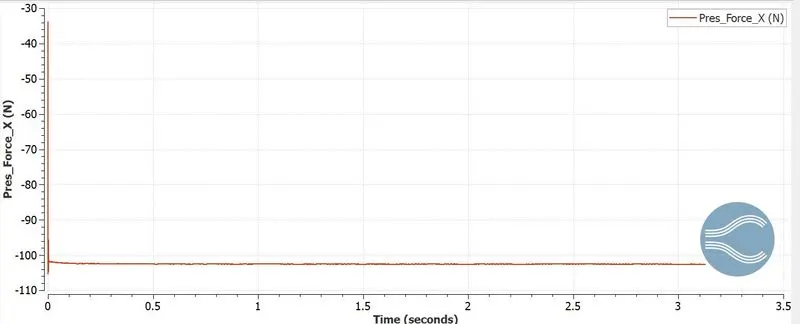
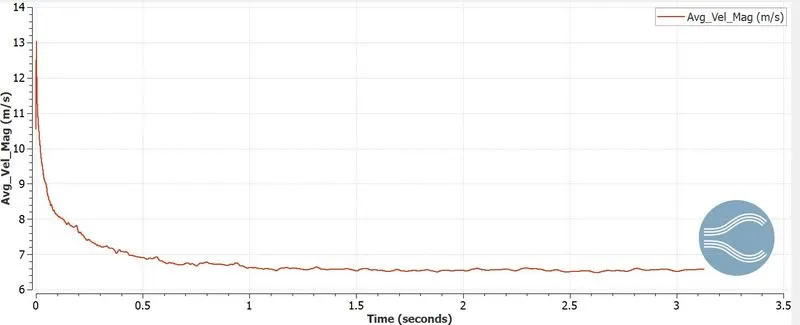
Velocity Plot
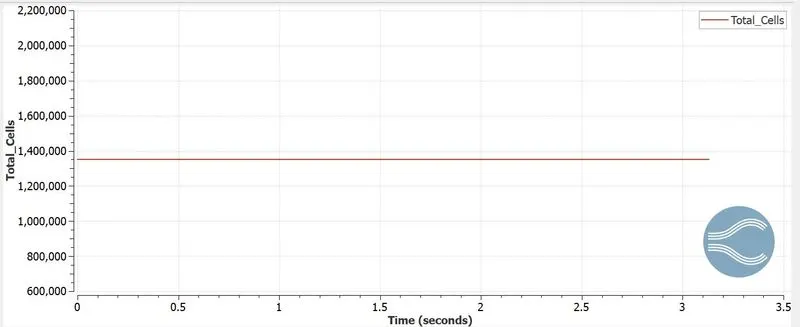
Cell Count
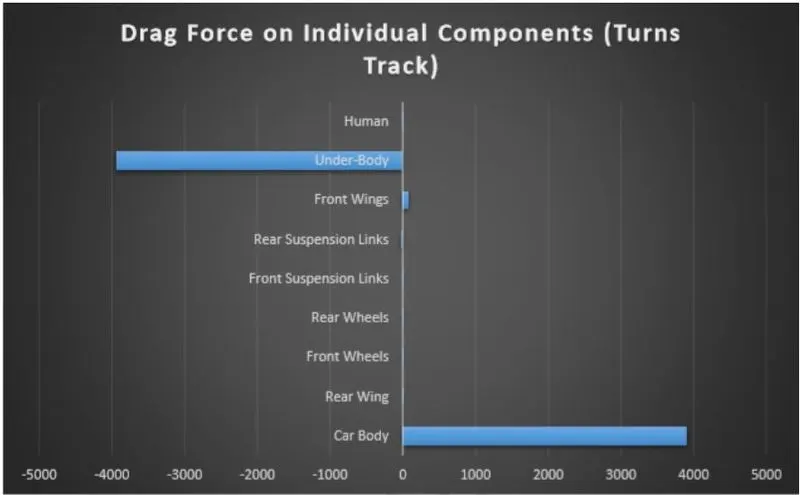
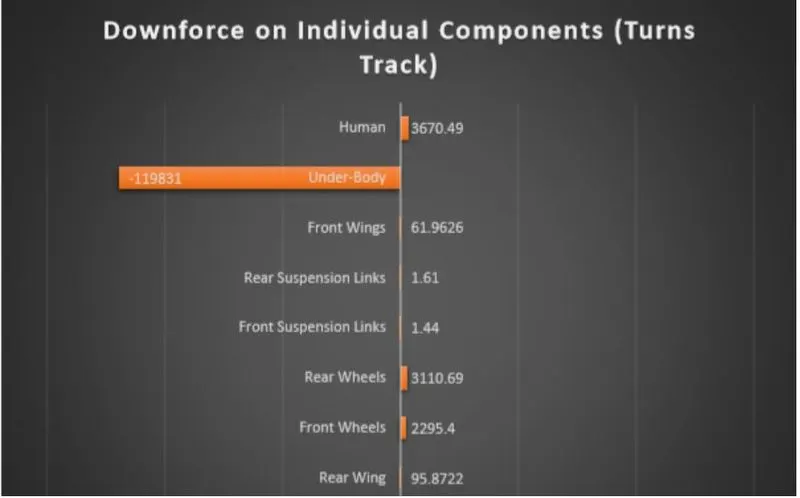
DRAG AND DOWNFORCE ON VARIOUS COMPONENTS
| Component | Down Force (N) | Drag Force (N) |
| Body | 115982 | 3914.6 |
| Rear Wing | 95.36 | 3.6 |
| Front Wheels | 2265.4 | 9.81 |
| Rear Wheels | 3100.6 | 7.6 |
| Front Suspension | 1.34 | 4.56 |
| Rear Suspension | 1.85 | 30.5 |
| Front Wings | 61.96 | 83.5 |
| Under body | -119381 | -3948.25 |
Now lets take a look at the plots for the downforce and drag force plots
CONCLUSION
- The aerodynamic analysis was carried out on FSAE car
- Various assumptions and optimization can be done from these type of simulations
- Drag and down forces on various components were reported