Super Charger Simulation Project
AIM
The aim is to simulate the flow of air inside the supercharger
OBJECTIVES
- Performance data of supercharger
- Obtainning the plot of total pressure v/s mass flow rate
- providing different pressure ratios as boundary conditions
- Conservation of mass of air from supercharger
SUPERCHARGER
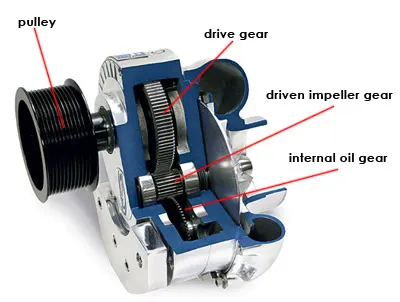
A supercharger is an air compressor that increases the pressure or density of air supplied to an internal combustion engine. This gives each intake cycle of the engine more oxygen, letting it burn more fuel and do more work, thus increasing the power output.Power for the supercharger can be provided mechanically by means of a belt, gear, shaft, or chain connected to the engine's crankshaft.
An ordinary four-stroke engine dedicates one stroke to the process of air intake. There are three steps in this process:
- The piston moves down.
- This creates a vacuum.
- Air at atmospheric pressure is sucked into the combustion chamber.
Once air is drawn into the engine, it must be combined with fuel to form the charge -- a packet of potential energy that can be turned into useful kinetic energy through a chemical reaction known as combustion. The spark plug initiates this chemical reaction by igniting the charge. As the fuel undergoes oxidation, a great deal of energy is released. The force of this explosion, concentrated above the cylinder head, drives the piston down and creates a reciprocating motion that is eventually transferred to the wheels.Getting more fuel into the charge would make for a more powerful explosion. But you can't simply pump more fuel into the engine because an exact amount of oxygen is required to burn a given amount of fuel. This chemically correct mixture -- 14 parts air to one part fuel -- is essential for an engine to operate efficiently. The bottom line: To put in more fuel, you have to put in more air.
That's the job of the supercharger. Superchargers increase intake by compressing air above atmospheric pressure, without creating a vacuum. This forces more air into the engine, providing a "boost." With the additional air in the boost, more fuel can be added to the charge, and the power of the engine is increased. Supercharging adds an average of 46 percent more horsepower and 31 percent more torque. In high-altitude situations, where engine performance deteriorates because the air has low density and pressure, a supercharger delivers higher-pressure air to the engine so it can operate optimally.
Unlike turbochargers, which use the exhaust gases created by combustion to power the compressor, superchargers draw their power directly from the crankshaft. Most are driven by an accessory belt, which wraps around a pulley that is connected to a drive gear. The drive gear, in turn, rotates the compressor gear. The rotor of the compressor can come in various designs, but its job is to draw air in, squeeze the air into a smaller space and discharge it into the intake manifold.To pressurize the air, a supercharger must spin rapidly -- more rapidly than the engine itself. Making the drive gear larger than the compressor gear causes the compressor to spin faster. Superchargers can spin at speeds as high as 50,000 to 65,000 rotations per minute (RPM). A compressor spinning at 50,000 RPM translates to a boost of about six to nine pounds per square inch (psi). That's six to nine additional psi over the atmospheric pressure at a particular elevation. Atmospheric pressure at sea level is 14.7 psi, so a typical boost from a supercharger places about 50 percent more air into the engine.
As the air is compressed, it gets hotter, which means that it loses its density and can not expand as much during the explosion. This means that it can't create as much power when it's ignited by the spark plug. For a supercharger to work at peak efficiency, the compressed air exiting the discharge unit must be cooled before it enters the intake manifold. The intercooler is responsible for this cooling process. Intercoolers come in two basic designs: air-to-air intercoolers and air-to-water intercoolers. Both work just like a radiator, with cooler air or water sent through a system of pipes or tubes. As the hot air exiting the supercharger encounters the cooler pipes, it also cools down. The reduction in air temperature increases the density of the air, which makes for a denser charge entering the combustion chamber.
Super Charger Simulation[pressure ratio of 1.1]
Geometry
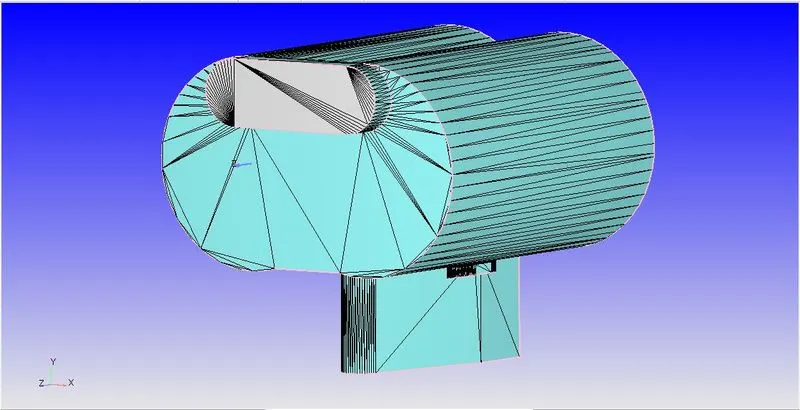
This file image contains 2 pairs of lobes inside the housing that compresses the air and sends it to the engine
Mesh

Now for the mesh size, we have used the 0.002m which shown clearly in the mesh picture above
Boundary Conditions
Left Lobe
- Wall Motion - Rotating
- Surface Movement - moving
- Rotation - About Z axis
- Rotation Rate = 2160000 Degress/sec = 2000rpm
- Temperature = 300 K
Right Lobe
- Wall Motion - Rotating
- Surface Movement - moving
- Rotation - About Z axis
- Rotation Rate = 2160000 Degress/sec = 2000rpm
- Temperature = 300 K
Casing
- Boundary type - wall
- Temperature = 300 K
- Wall Motion - Fixed
Inlet
- Inflow Boundary
- Pressure = 100000 bar
- Temperature = 300 K
- Species - Air
Outlet
- Inflow Boundary
- Pressure = 110000 bar
- Temperature = 300 K
- Species - Air
Results
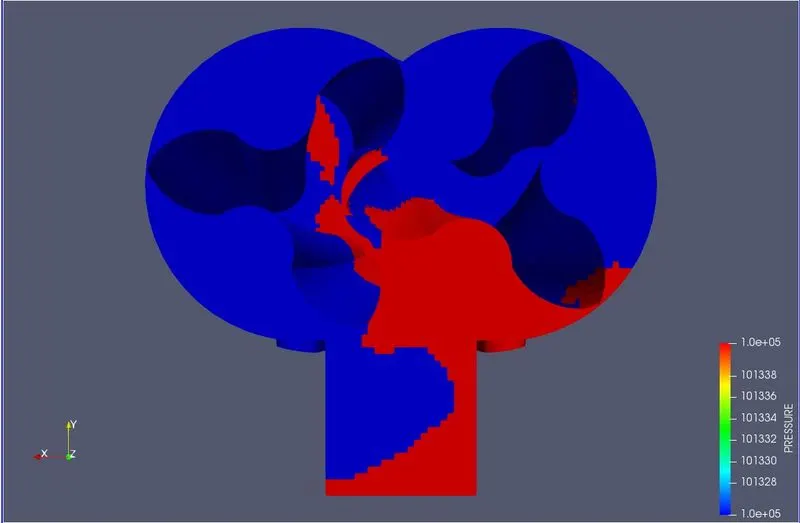
Pressure Contour
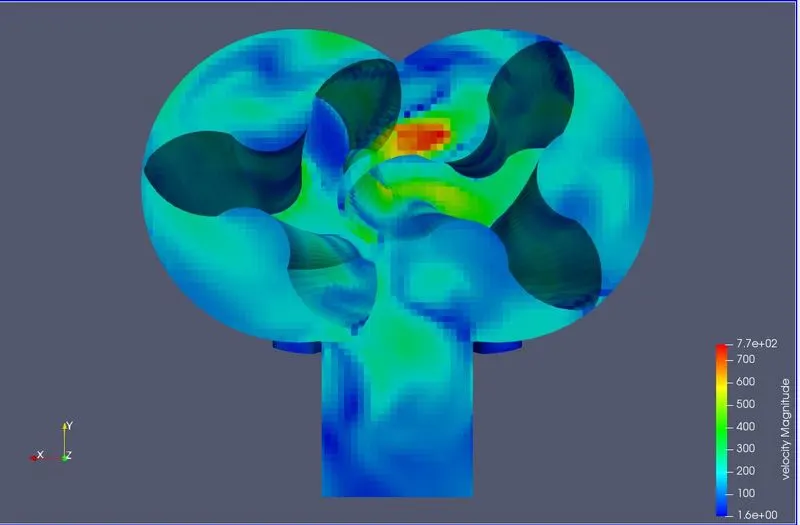
Velocity Contour
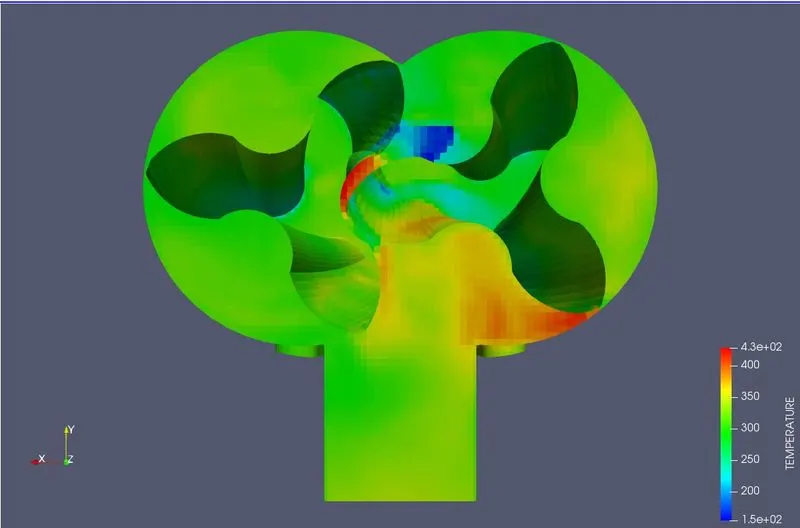
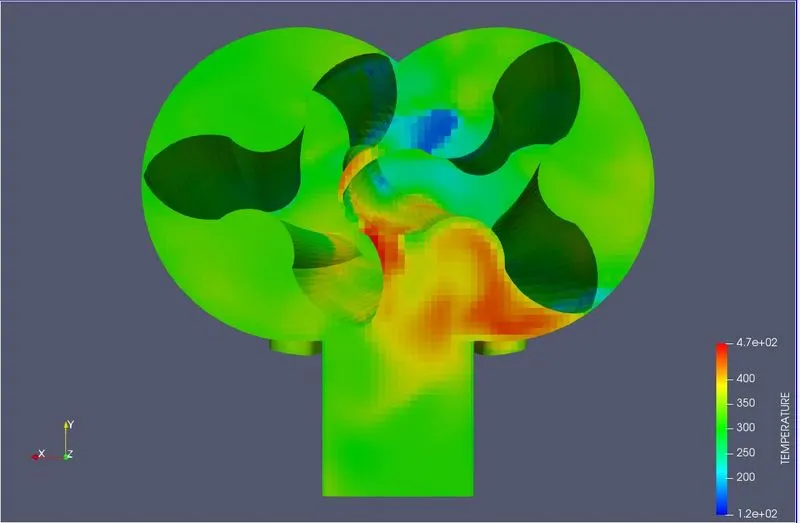
Temperature Contour
Mass Flow Rate Plot
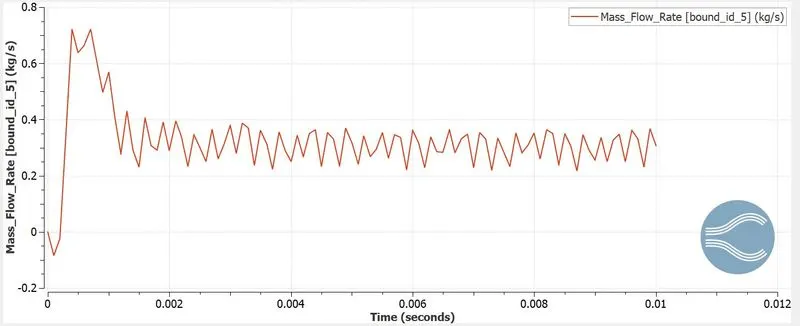
The mass flow rate has converged to value of 0.3121 kg/s, as there is a sudden raise in air inlet. After some time the air flow rate converges to steady state value.
Temperature Plot
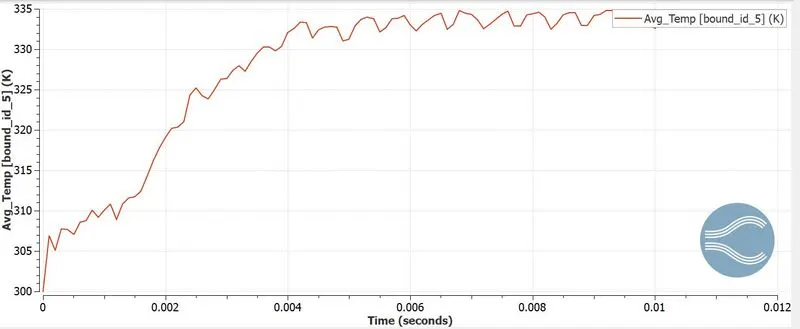
Initially at 300K and the temperature of the air eventually builds to around 335 K inside the supercharger
Velocity Plot
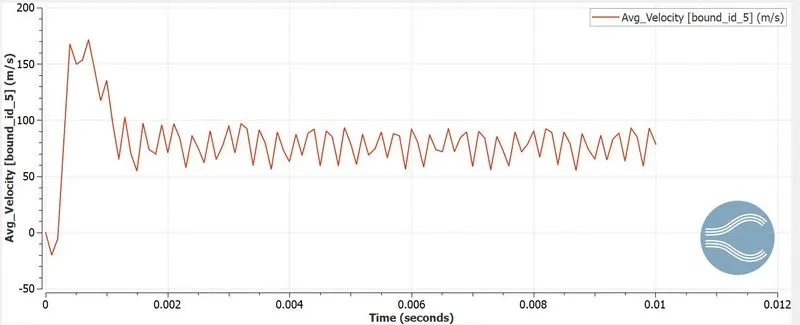
Velocity of air is approximately 100 m/s from a velocity of 0 m/s
Cell Count
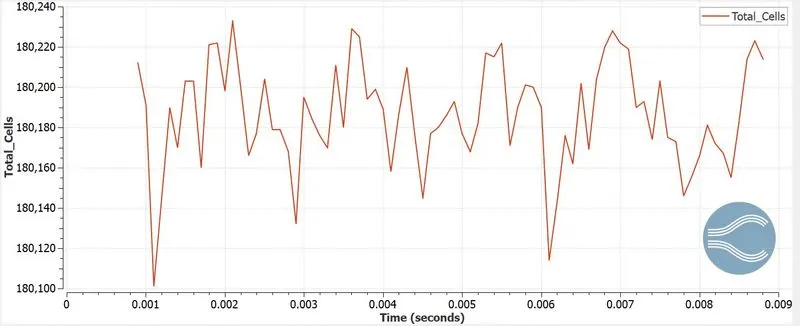
The case took 180220 cells to run the simulation and shows a unique trend of usage of cells in this simulation
Super Charger Simulation[pressure ratio of 1.5]
Geometry
This file image contains 2 pairs of lobes inside the housing that compresses the air and sends it to the engine
Mesh
Now for the mesh size, we have used the 0.002m which shown clearly in the mesh picture above
Boundary Conditions
Left Lobe
- Wall Motion - Rotating
- Surface Movement - moving
- Rotation - About Z axis
- Rotation Rate = 2160000 Degress/sec = 2000rpm
- Temperature = 300 K
Right Lobe
- Wall Motion - Rotating
- Surface Movement - moving
- Rotation - About Z axis
- Rotation Rate = 2160000 Degress/sec = 2000rpm
- Temperature = 300 K
Casing
- Boundary type - wall
- Temperature = 300 K
- Wall Motion - Fixed
Inlet
- Inflow Boundary
- Pressure = 100000 bar
- Temperature = 300 K
- Species - Air
Outlet
- Inflow Boundary
- Pressure = 150000 bar
- Temperature = 300 K
- Species - Air
Results
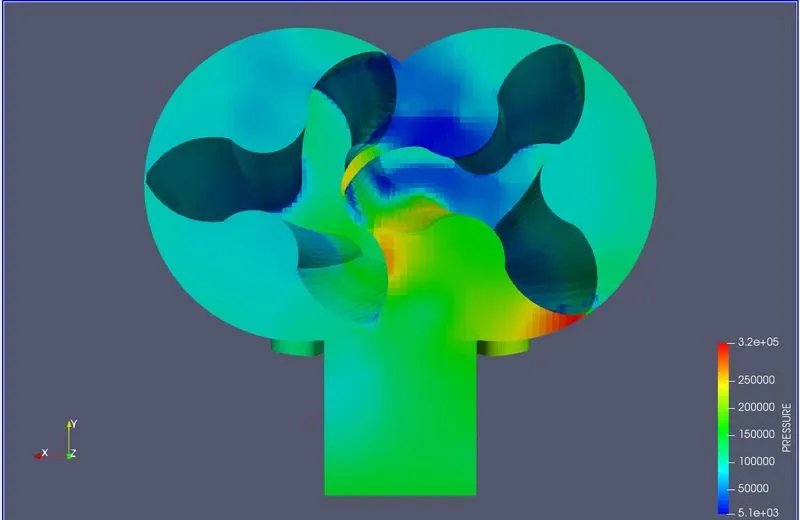
Pressure Contour
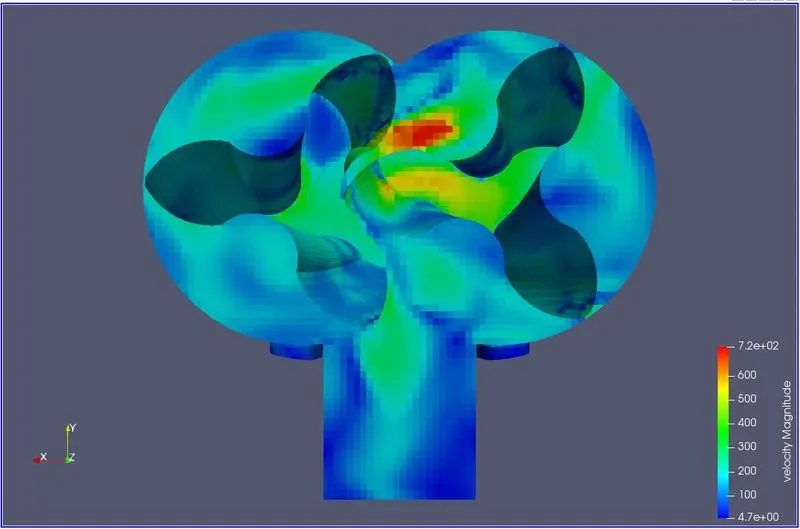
Velocity Contour
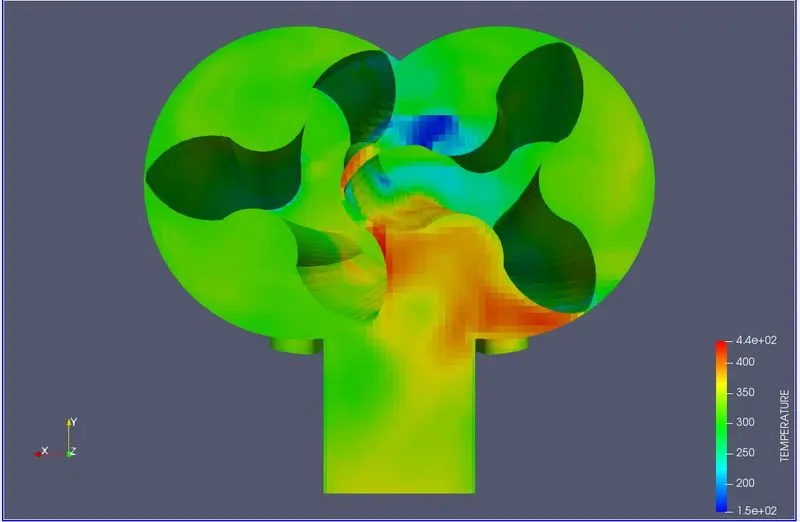
Temperature Contour
Mass Flow Rate Plot
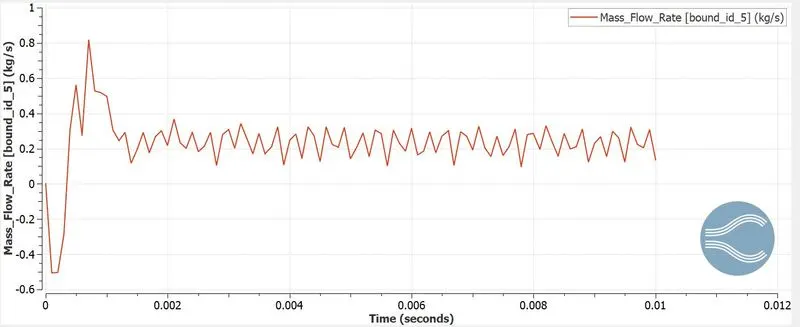
The mass flow rate has converged to value of 0.1626 kg/s, as there is a sudden raise in air inlet. After some time the air flow rate converges to steady state value.
Temperature Plot
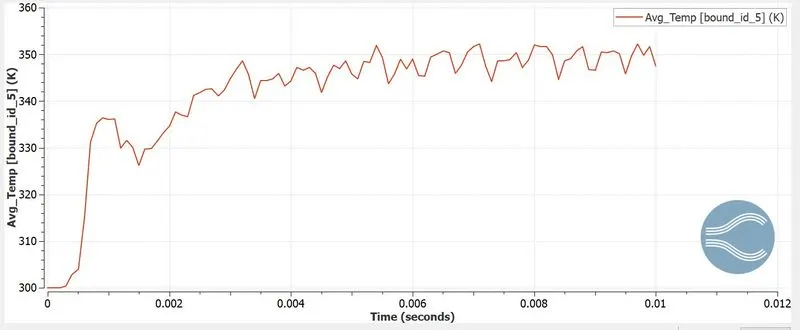
Initially at 300K and the temperature of the air eventually builds to around 335 K inside the supercharger
Velocity Plot
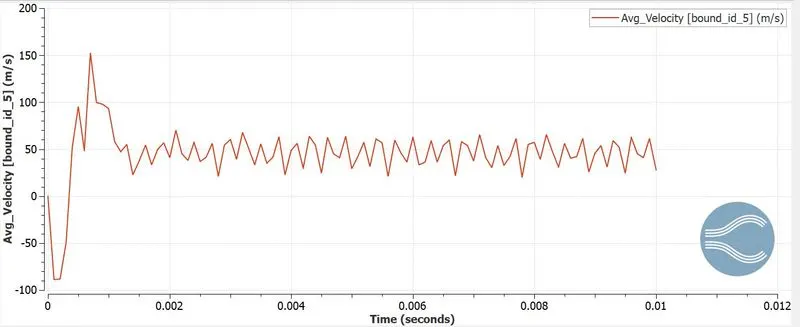
Velocity of air is approximately 30 m/s from a velocity of 0 m/s
Cell Count
The case took 180220 cells to run the simulation and shows a unique trend of usage of cells in this simulation
Super Charger Simulation[pressure ratio of 2]
Geometry
This file image contains 2 pairs of lobes inside the housing that compresses the air and sends it to the engine
Mesh
Now for the mesh size, we have used the 0.002m which shown clearly in the mesh picture above
Boundary Conditions
Left Lobe
- Wall Motion - Rotating
- Surface Movement - moving
- Rotation - About Z axis
- Rotation Rate = 2160000 Degress/sec = 2000rpm
- Temperature = 300 K
Right Lobe
- Wall Motion - Rotating
- Surface Movement - moving
- Rotation - About Z axis
- Rotation Rate = 2160000 Degress/sec = 2000rpm
- Temperature = 300 K
Casing
- Boundary type - wall
- Temperature = 300 K
- Wall Motion - Fixed
Inlet
- Inflow Boundary
- Pressure = 100000 bar
- Temperature = 300 K
- Species - Air
Outlet
- Inflow Boundary
- Pressure = 200000 bar
- Temperature = 300 K
- Species - Air
Results
Pressure Contour
Velocity Contour
Temperature Contour
Mass Flow Rate Plot
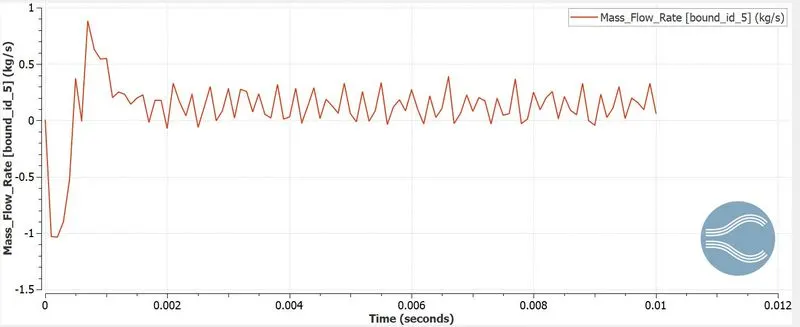
The mass flow rate has converged to value of 0.0829 kg/s, as there is a sudden raise in air inlet. After some time the air flow rate converges to steady state value.
Temperature Plot
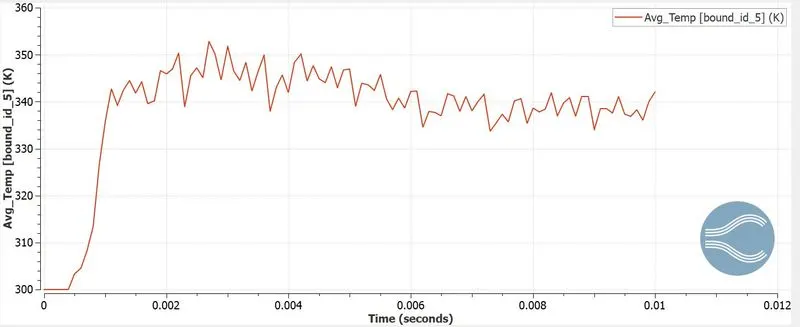
Initially at 300K and the temperature of the air eventually builds to around 335 K inside the supercharger
Velocity Plot
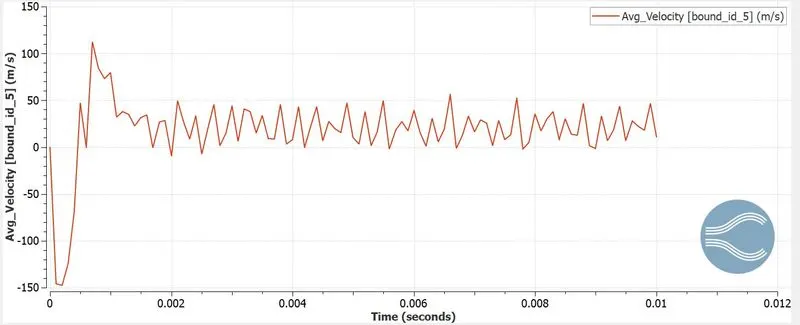
Velocity of air is approximately 100 m/s from a velocity of 0 m/s
Cell Count
The case took 180220 cells to run the simulation and shows a unique trend of usage of cells in this simulation
Super Charger Simulation[pressure ratio of 2.2]
Geometry
This file image contains 2 pairs of lobes inside the housing that compresses the air and sends it to the engine
Mesh
Now for the mesh size, we have used the 0.002m which shown clearly in the mesh picture above
Boundary Conditions
Left Lobe
- Wall Motion - Rotating
- Surface Movement - moving
- Rotation - About Z axis
- Rotation Rate = 2160000 Degress/sec = 2000rpm
- Temperature = 300 K
Right Lobe
- Wall Motion - Rotating
- Surface Movement - moving
- Rotation - About Z axis
- Rotation Rate = 2160000 Degress/sec = 2000rpm
- Temperature = 300 K
Casing
- Boundary type - wall
- Temperature = 300 K
- Wall Motion - Fixed
Inlet
- Inflow Boundary
- Pressure = 100000 bar
- Temperature = 300 K
- Species - Air
Outlet
- Inflow Boundary
- Pressure = 220000 bar
- Temperature = 300 K
- Species - Air
Results
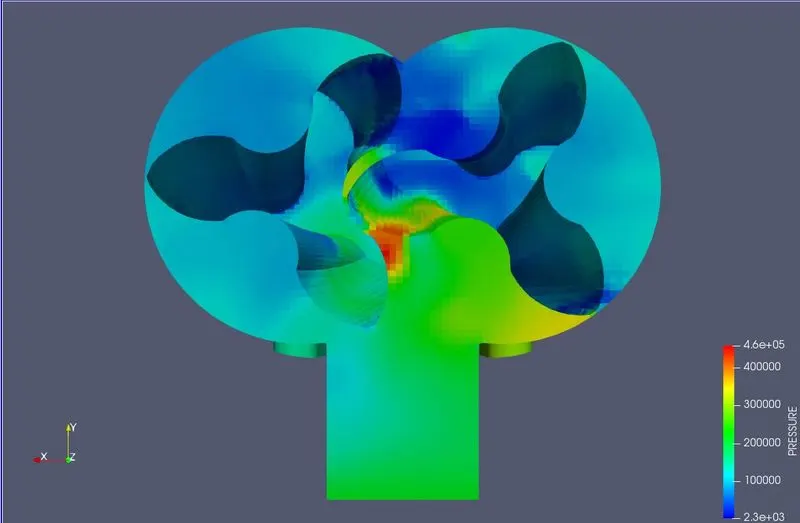
Pressure Contour
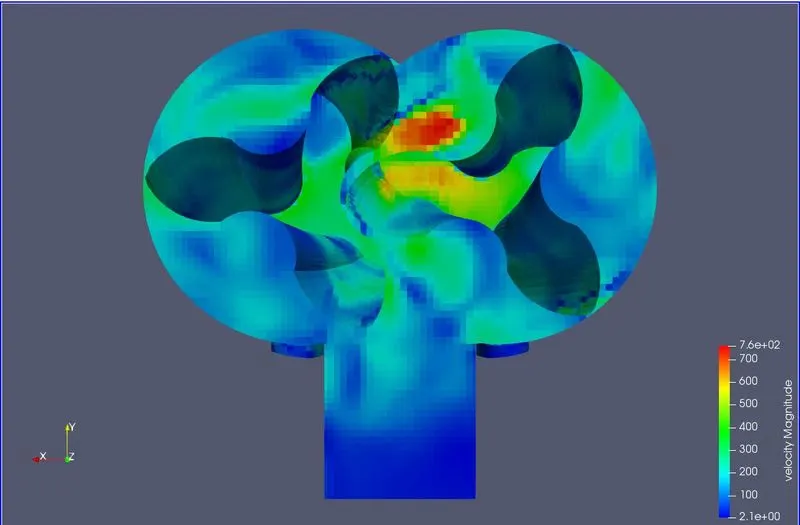
Velocity Contour
Temperature Contour
Mass Flow Rate Plot
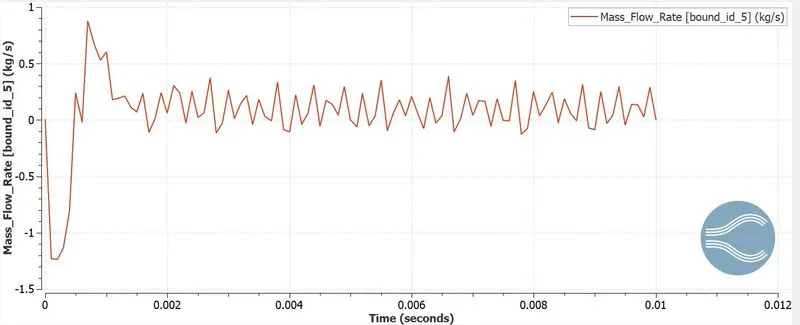
The mass flow rate has converged to value of 0.0789 kg/s, as there is a sudden raise in air inlet. After some time the air flow rate converges to steady state value.
Temperature Plot
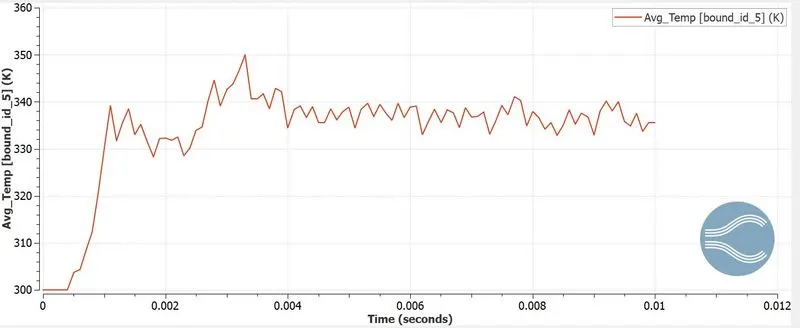
Initially at 300K and the temperature of the air eventually builds to around 335 K inside the supercharger
Velocity Plot
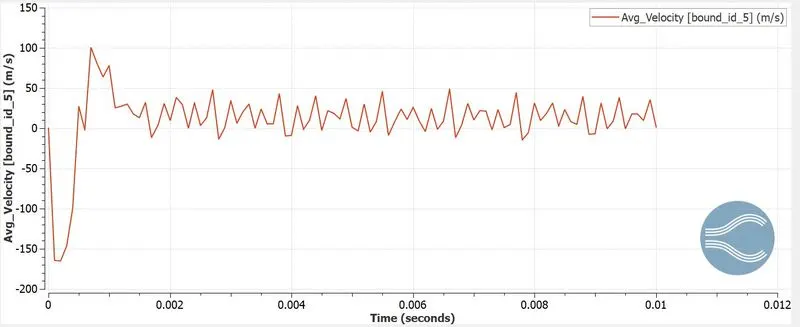
Velocity of air is approximately 0 m/s from a velocity of 5 m/s
Cell Count
The case took 180220 cells to run the simulation and shows a unique trend of usage of cells in this simulation
SUPERCHARGER PERFORMANCE PLOT
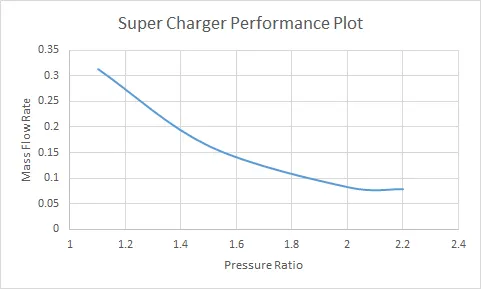
As the pressure ratio increases, the mass flow rate also increases
MASS CONVERGENCE CHECK
| Sl No | Pressure Ratio | Mass flow rate inlet (kg/s) | Mass flow rate outlet (kg/s) | Error |
| 1 | 1.1 | -0.3069 | 0.3121 | 0.0052 |
| 2 | 1.5 | -0.2291 | 0.1626 | 0.0665 |
| 3 | 2.0 | -0.1125 | 0.0829 | 0.0296 |
| 4 | 2.2 | -0.0811 | 0.0789 | 0.0022 |
Comparision of temperature with and without energy solver
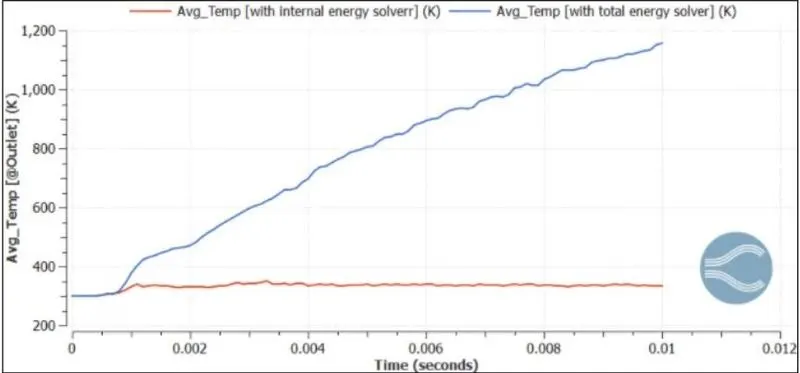
Now we can observe that the temperature is higher with the total energy solver compared to internal energy solver. This happens because we consider the work done on the fluid which eventually leads to high temperature.
CONCLUSION
- Comparison of with and without energy solver is done
- The supercharger was simulated with above results
- Performance Plot was obtained from the data
- Mass convergence criteria is in excellent acceptance with inlet and outlet mass flow rates