Shock tube simulation
AIM
The aim of this project is to simulate the shock waves flow in shock tube
OBJECTIVES
Some of the objectives are listed as follows
- Transient setup for shock tube
- Plot of temperature and pressure
- Visualisation of the shock wave propagation
SHOCK TUBE
The shock tube is an instrument used to replicate and direct blast waves at a sensor or a model in order to simulate actual explosions and their effects, usually on a smaller scale. Shock tubes (and related impulse facilities such as shock tunnels, expansion tubes, and expansion tunnels) can also be used to study aerodynamic flow under a wide range of temperatures and pressures that are difficult to obtain in other types of testing facilities. Shock tubes are also used to investigate compressible flow phenomena and gas phase combustion reactions. More recently, shock tubes have been used in biomedical research to study how biological specimens are affected by blast waves.A shock wave inside a shock tube may be generated by a small explosion (blast-driven) or by the buildup of high pressures which cause diaphragm(s) to burst and a shock wave to propagate down the shock tube (compressed-gas driven).
A simple shock tube is a tube, rectangular or circular in cross-section, usually constructed of metal, in which a gas at low pressure and a gas at high pressure are separated using some form of diaphragm. See, for instance, texts by Soloukhin, Gaydon and Hurle, and Bradley. The diaphragm suddenly bursts open under predetermined conditions to produce a wave propagating through the low pressure section. The shock that eventually forms increases the temperature and pressure of the test gas and induces a flow in the direction of the shock wave. Observations can be made in the flow behind the incident front or take advantage of the longer testing times and vastly enhanced pressures and temperatures behind the reflected wave.
The low-pressure gas, referred to as the driven gas, is subjected to the shock wave. The high pressure gas is known as the driver gas. The corresponding sections of the tube are likewise called the driver and driven sections. The driver gas is usually chosen to have a low molecular weight, (e.g., helium or hydrogen) for safety reasons, with high speed of sound, but may be slightly diluted to 'tailor' interface conditions across the shock. To obtain the strongest shocks the pressure of the driven gas is well below atmospheric pressure (a partial vacuum is induced in the driven section before detonation).
The test begins with the bursting of the diaphragm.Several methods are commonly used to burst the diaphragm.
- A mechanically-driven plunger is sometimes used to pierce it or an explosive charge may be used to burst it.
- Another method is to use diaphragms of plastic or metals to define specific bursting pressures. Plastics are used for the lowest burst pressures, aluminum and copper for somewhat higher levels and mild steel and stainless steel for the highest burst pressures.These diaphragms are frequently scored in a cross-shaped pattern to a calibrated depth to ensure that they rupture evenly, contouring the petals so that the full section of the tube remains open during the test time.
- Yet another method of rupturing the diaphragm utilizes a mixture of combustible gases, with an initiator designed to produce a detonation within it, producing a sudden and sharp increase in what may or may not be a pressurized driver. This blast wave increases the temperature and pressure of the driven gas and induces a flow in the direction of the shock wave but at lower velocity than the lead wave.
The bursting diaphragm produces a series of pressure waves, each increasing the speed of sound behind them, so that they compress into a shock propagating through the driven gas. This shock wave increases the temperature and pressure of the driven gas and induces a flow in the direction of the shock wave but at lower velocity than the lead wave. Simultaneously, a rarefaction wave, often referred to as the Prandtl-Meyer wave, travels back in to the driver gas.The interface, across which a limited degree of mixing occurs, separates driven and driver gases is referred to as the contact surface and follows, at a lower velocity, the lead wave.
A 'Chemical Shock Tube' involves separating driver and driven gases by a pair of diaphragms designed to fail after pre-determined delays with an end 'dump tank' of greatly increased cross-section. This allows an extreme rapid reduction (quench) in temperature of the heated gases.
SHOCK TUBE SIMULATION
Geometry
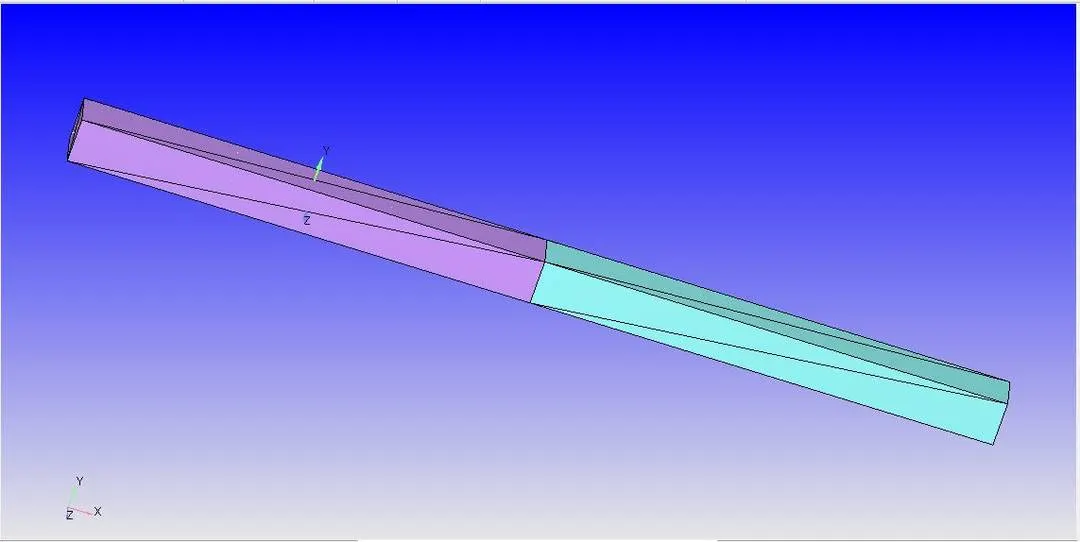
Figure shows the geometry file, in which the left hand side is the region in high pressure and on the right hand side we have the low pressure regions.
Mesh
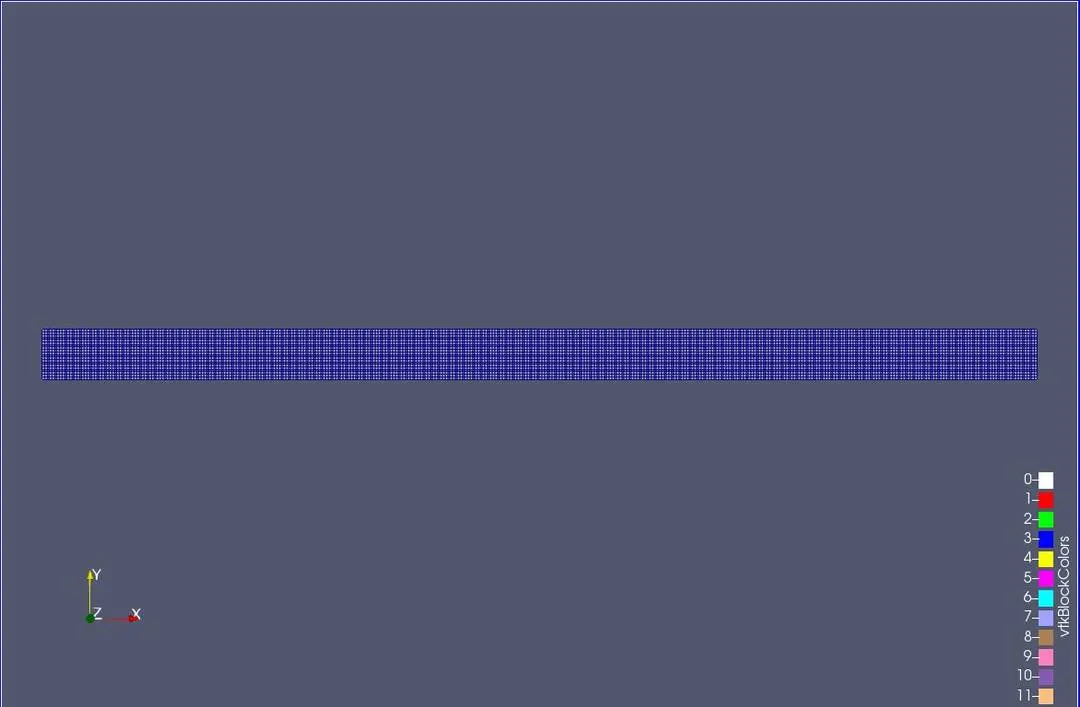
With the base grid size of 0.005m, we can see a fine mesh being generated for the shock flow to be captured effectively, taking the cell count to 200000. The species based adaptive mesh refinement is enabled with SGS of 0.001.
Boundary Conditions
High Pressure
- Wall BC
- Velocity - Slip
- Temperature - Zero Gradient
- Pressure = 6e5 Bar
- Turbulence Model - RNG K-Epsilon
Low pressure
- Wall BC
- Velocity - Slip
- Temperature - Zero Gradient
- Pressure = 101325 Bar
Results
Pressure versus seconds
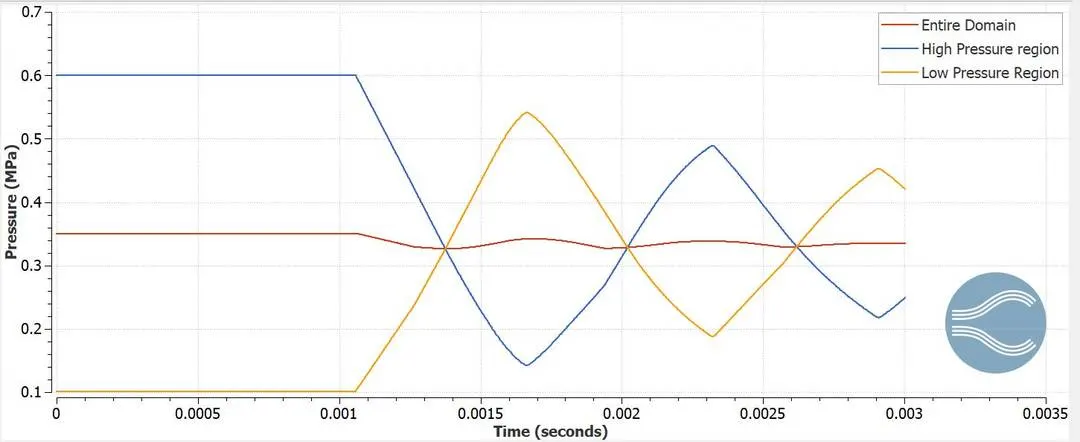
This graph displays the pressure behaviour in entire domain as well as the high & low pressure regions. Now we can see that until 1ms there is no change in pressure due to the fact that in the events the flow is closed. After 1ms we see that the pressure starts dropping in the HP region and then the pressure increases in the LP region. As time progresses, the vice versa takes place. This phenomenon occurs due to the high pressure waves starts moving with high velocity and the LP region encounters this huge shock flow in the start. There is a fixed cycle and keeps repeating itself because the shock waves are being reflected back and forth.
Temperature versus seconds
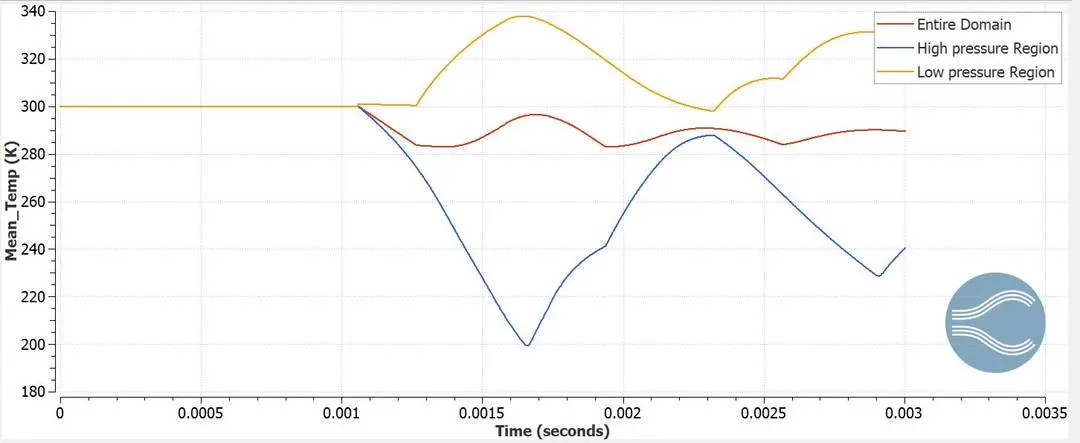
As the trend of behaviour is carried on to the temperature as well. The high pressure domain, temperature decreases and it increases in the LP region. this is also cause the shock waves keep reflecting back and forth till it reaches a steady state with progress in time.
Cell count
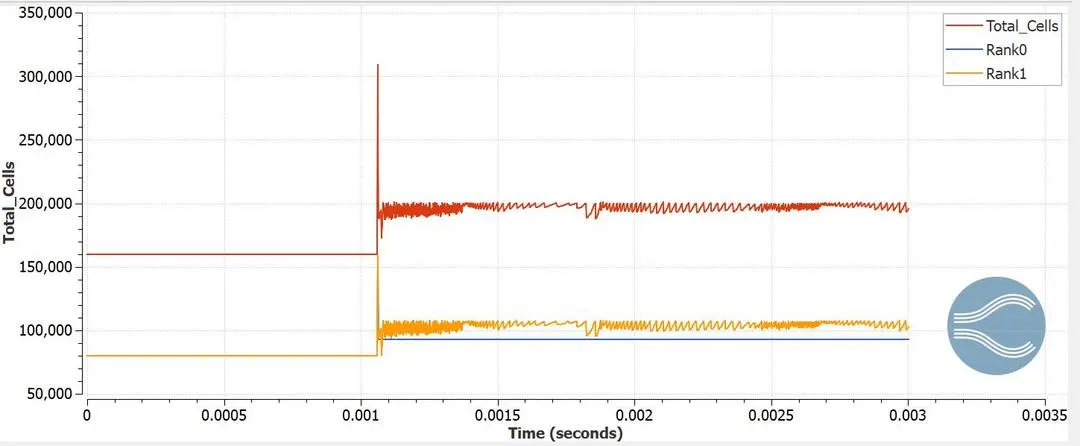
The cell count has gone to somewhere around 200000 and the processors almost equally share the balance of load distribution to 100000 cells each.
Pressure Animation
Temperature animation
CONCLUSION
- Simulation of shock tubes was simulated to visualise the shock waves
- The shock waves propagation is clearly shown in the animation files
- Flow parameters were studied for analysis of shock tube flow