Senstivity Analysis Assignment
AIM
The aim of this program is to perform sensitivity analysis on GRI file mechanism
OBJECTIVES
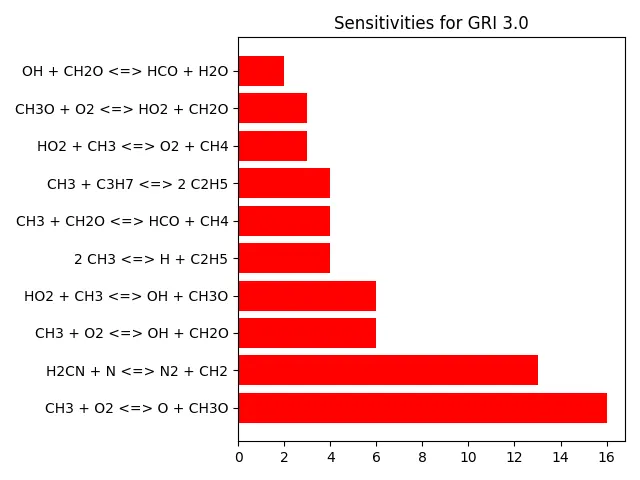
- Program that takes all the reactions from the GRI mechanism and calculates 10 most sensitive reactions
- The sensitivity parameter should be with respect to the Temperature
SENSITIVITY ANALYSIS
Sensitivity analysis is the study of how the uncertainty in the output of a mathematical model or system (numerical or otherwise) can be divided and allocated to different sources of uncertainty in its inputs. A related practice is uncertainty analysis, which has a greater focus on uncertainty quantification and propagation of uncertainty; ideally, uncertainty and sensitivity analysis should be run in tandem.
The process of recalculating outcomes under alternative assumptions to determine the impact of a variable under sensitivity analysis can be useful for a range of purposes, including:
- Testing the robustness of the results of a model or system in the presence of uncertainty.
- Increased understanding of the relationships between input and output variables in a system or model.
- Uncertainty reduction, through the identification of model input that cause significant uncertainty in the output and should therefore be the focus of attention in order to increase robustness (perhaps by further research).
- Searching for errors in the model (by encountering unexpected relationships between inputs and outputs).
- Model simplification – fixing model input that has no effect on the output, or identifying and removing redundant parts of the model structure.
- Enhancing communication from modelers to decision makers (e.g. by making recommendations more credible, understandable, compelling or persuasive).
- Finding regions in the space of input factors for which the model output is either maximum or minimum or meets some optimum criterion (see optimization and Monte Carlo filtering).
- In case of calibrating models with large number of parameters, a primary sensitivity test can ease the calibration stage by focusing on the sensitive parameters. Not knowing the sensitivity of parameters can result in time being uselessly spent on non-sensitive ones.
- To seek to identify important connections between observations, model inputs, and predictions or forecasts, leading to the development of better models.
In the world of combustion we perform sensitivity analysis using local derivatives
Local derivative-based methods involve taking the partial derivative of the output Y with respect to an input factor Xi:

where the subscript X0 indicates that the derivative is taken at some fixed point in the space of the input (hence the 'local' in the name of the class). Adjoint modelling and Automated Differentiation are methods in this class. Similar to OAT, local methods do not attempt to fully explore the input space, since they examine small perturbations, typically one variable at a time.
CODE FOR SENSITIVITY ANALYSIS
import matplotlib.pyplot as plt
import cantera as ct
import numpy as np
import os
import sys

gas = ct.Solution('gri30.xml')
temperature = 1500.0
pressure  = 101325
n = 325 # Number of reaction in GRI3.0

gas.TPX = temperature,pressure, {'CH4':1, 'O2':2,'N2':7.52}
r = ct.IdealGasConstPressureReactor(gas,name='R1')
sim = ct.ReactorNet([r])
s_min = [0]*325
reaction = [0]*20
react = []
flame = []
sensitivity_list = []
n_reaction = []

# Sensitivity of the first all Reactions
for i in range(n):
	r.add_sensitivity_reaction(i)
# Set the tolerance for the solution and for the sensitivity coefficients.
sim.rtol = 1.0e-6 # Relative change in solution should be less than this tolerence.
sim.atol = 1.0e-15 # Absolute change in solution should be less than this tolerence.

sim.rtol_sensitivity = 1.0e-6 #Relative change in sensitivity should be less than this tolerence.
sim.atol_sensitivity = 1.0e-6 #Absolute change in sensitivity should be less than this tolerence.

states = ct.SolutionArray(gas, extra=['t'])

for t in np.arange(0,2e-3,5e-6):
	sim.advance(t)

	for j in range(n):
		s = sim.sensitivity(1, j)

		if abs(s)>abs(s_min[j]):
			s_min[j] = s

	states.append(r.thermo.state, t = 1000*t)
	print('{:10.30} {:10.3f} {:10.3f} {:14.6e}'.format(sim.time, r.T, r.thermo.P, r.thermo.u))


k = np.linspace(1,n,n)
sensitivity_list = (tuple(zip(k,s_min))) # Compile the reaction data and corrosponding sensitivity value.
sensitivity_list_max = sorted(sensitivity_list, key=lambda sensitivity_list:-sensitivity_list[1]) # Sorting the sensitivities in descending order.
# Select the top 10 highly sensitivies reaction against the temperature.
names = []
sensitive_value = []
for l in range(10):
	n_reaction1 = sensitivity_list_max[l]
	n_reaction2 = int(n_reaction1[0])
	n_reaction.append(n_reaction2)
	n_reaction3 = int(n_reaction1[1])
	sensitive_value.append(n_reaction3)
# Take out reaction string for GRI3.0 File.
os.chdir('C:Program FilesCanteradata')
for i in (n_reaction):
	k=str(int(i)) #k = str(155)
	file = open('gri30.cti','r')
	ct = 1
	ct1 = 1
	j = 0
	for line in file:

		if 'Reaction' in line:
			if k in line:
				j = ct
			ct = ct + 1

	file = open('gri30.cti','r')
	for line in file:
		if 'reaction(' in line:
			ct1 = ct1 + 1
			if ct1 == j:
				names.append(line.split('"')[1])

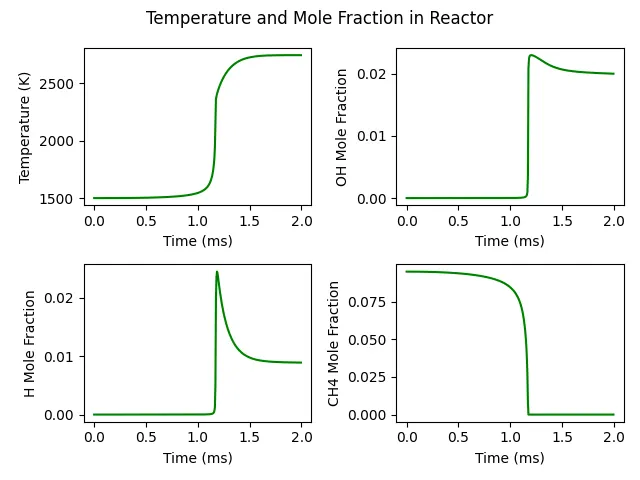
plt.subplot(2,2,1)
plt.plot(states.t, states.T, color = 'green')
plt.xlabel('Time (ms)')
plt.ylabel('Temperature (K)')
plt.suptitle('Temperature and Mole Fraction in Reactor')
plt.subplot(2,2,2)
plt.plot(states.t, states('OH').X, color = 'green')
plt.xlabel('Time (ms)')
plt.ylabel('OH Mole Fraction')
plt.subplot(2,2,3)
plt.plot(states.t,states('H').X, color = 'green')
plt.xlabel('Time (ms)')
plt.ylabel('H Mole Fraction')
plt.subplot(2,2,4)
plt.plot(states.t, states('CH4').X, color = 'green')
plt.xlabel('Time (ms)')
plt.ylabel('CH4 Mole Fraction')
plt.tight_layout()

x = np.linspace(0,9,10)
plt.figure(2)
plt.barh(x,sensitive_value, color = 'red')
plt.yticks(x,names)
plt.title('Sensitivities for GRI 3.0')
plt.tight_layout()
plt.show()
Now as usual the relevant libraries are imported in the fist lines of the code, after which we define gas object for methane combustion. Then the reactor network is defined as 'r' and the network is integrated with certain time steps providing absolute and relative tolerances for reactions respectively. Next we say to append the values and use for loops to repeat the process for 10 reactions. Now for the sensitivity analysis of temperature a variable k is defined and the sensitivity list commands are defined to perform sensitivity analysis on 10 reactions of methane combustion. Then reaction list variables say the respective reactions. The os system is imorted to perform file parsing operations to read the GRI MECH 3.0 file and then define ct and ct1 iterations variables and then the results are finally plotted.
PLOTS FROM CODE
CONCLUSION
- The sensitivity analysis of temperature parameter was performed for methane combustion
- The plots shows the sensitivity for 10 reactions
- The GRI MECH 3.0 file first 10 reactions was analysed for sensitivity