Exploration of GUI on GT Suite and Inter Cooler Simulation
AIM
The aim of this challenge is to explore through the graphics user interface of GT Power
OBJECTIVES
- Location of settings for setting up of simulations in GT power
- Exploration of Intercooler tutorials
- Setting up simulation of the intercooler
GUI OF GT SUITE
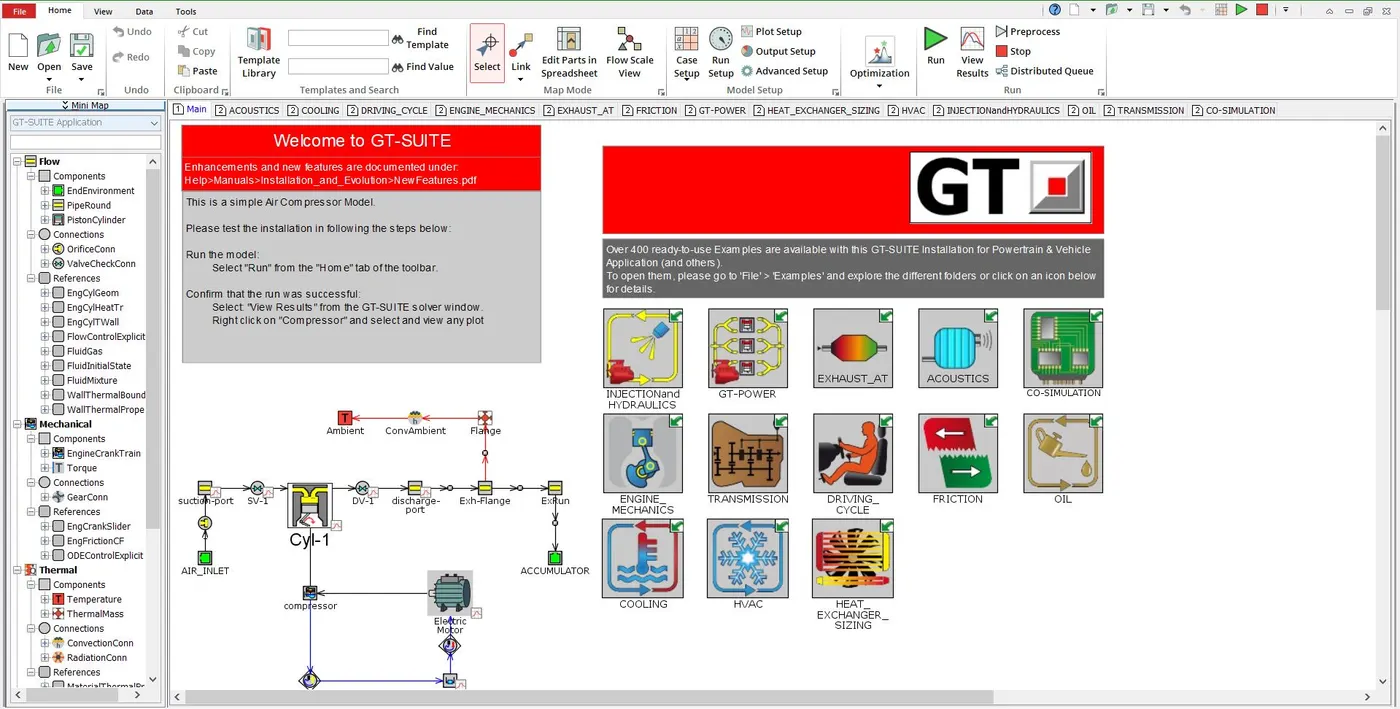
When we launch the GT Power software we can see the first window which is shown in the above image. There are different tabs on the top and on the left side we see a drop menu which shows the various problems that can be modelled in this software (Flow,Mechanical,Themal,Electro-magnetic and control problems).
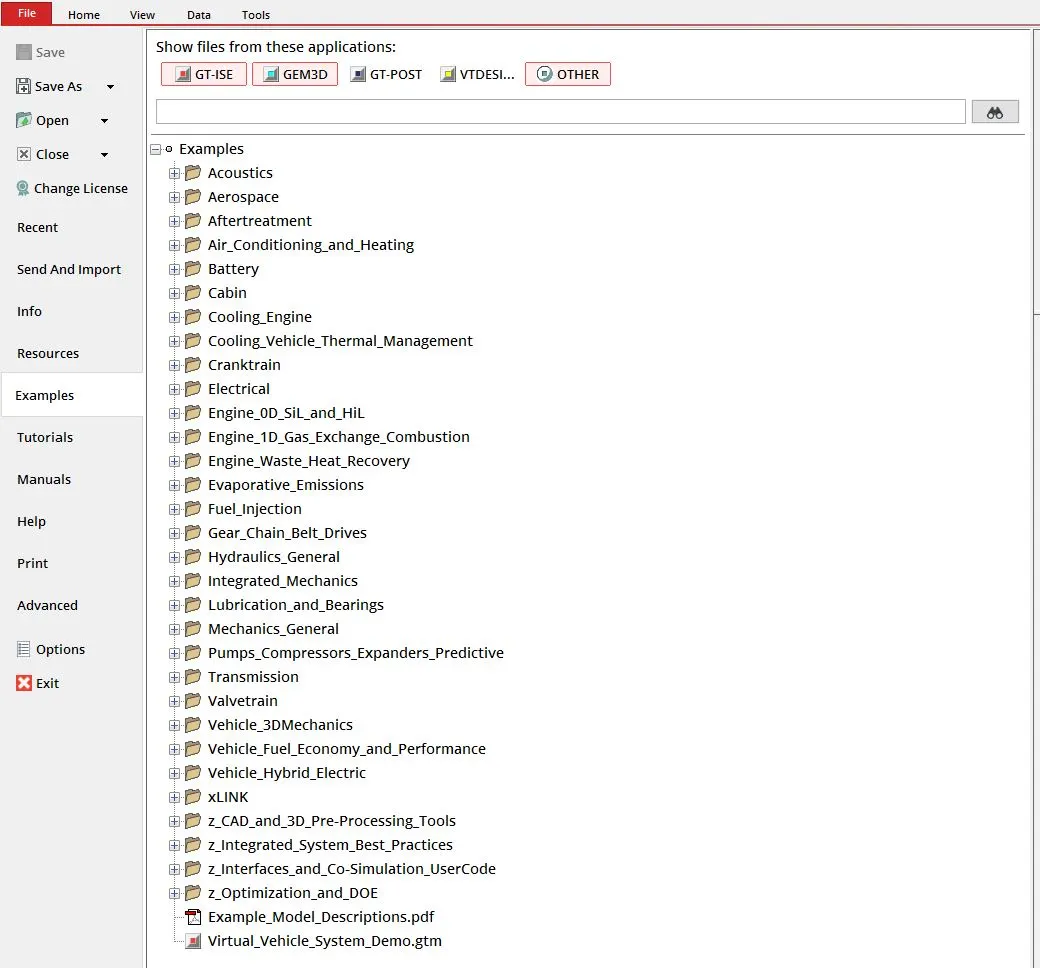
Examples
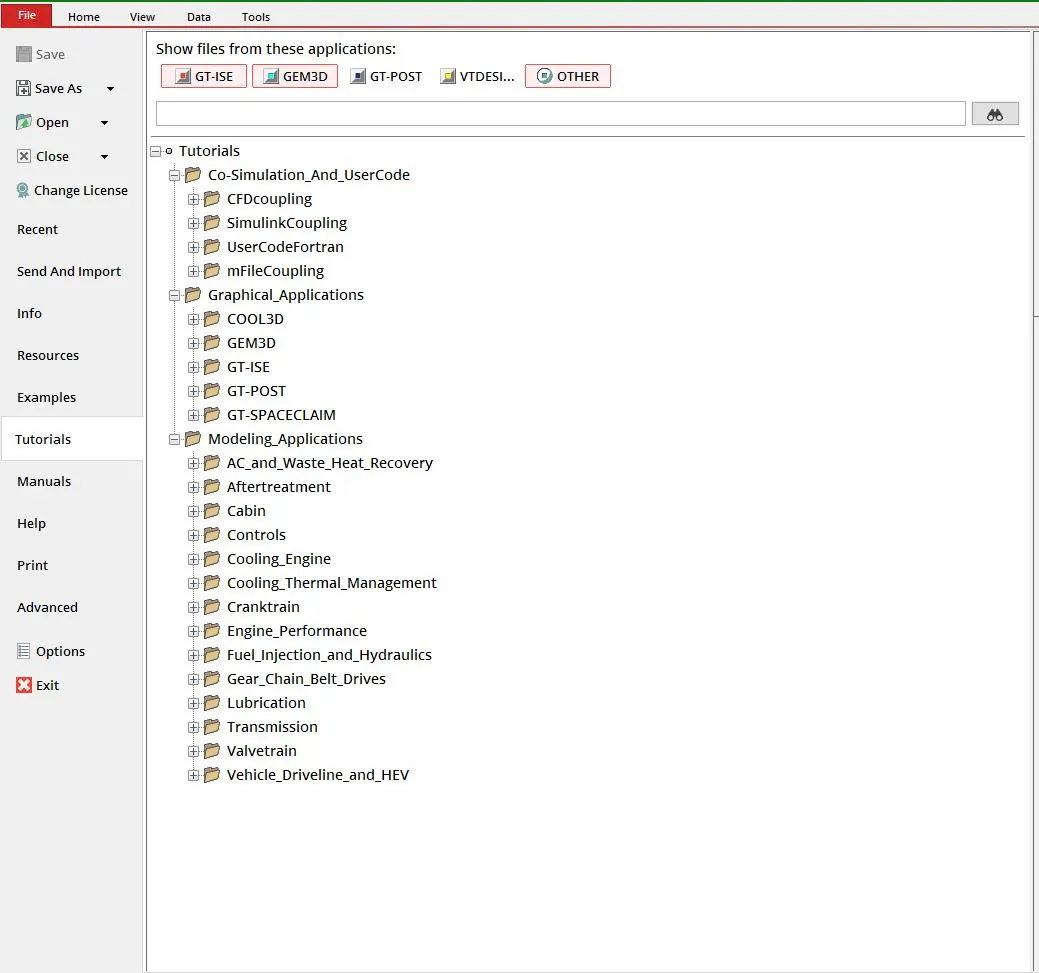
Tutorials
Basically, the categorisation of the GT Suite model is as follows
- Templates - It is the main directory in which certain files are stored
- Objects - The objects plays the role of classifying the various parts involved in the model
- Parts - The individual parts can be seen in the main window on which the simulation is been run
Lets take an example of Engine Performance tutorial under which we select 1cylDI which is the single cylinder Direct Injection Engine
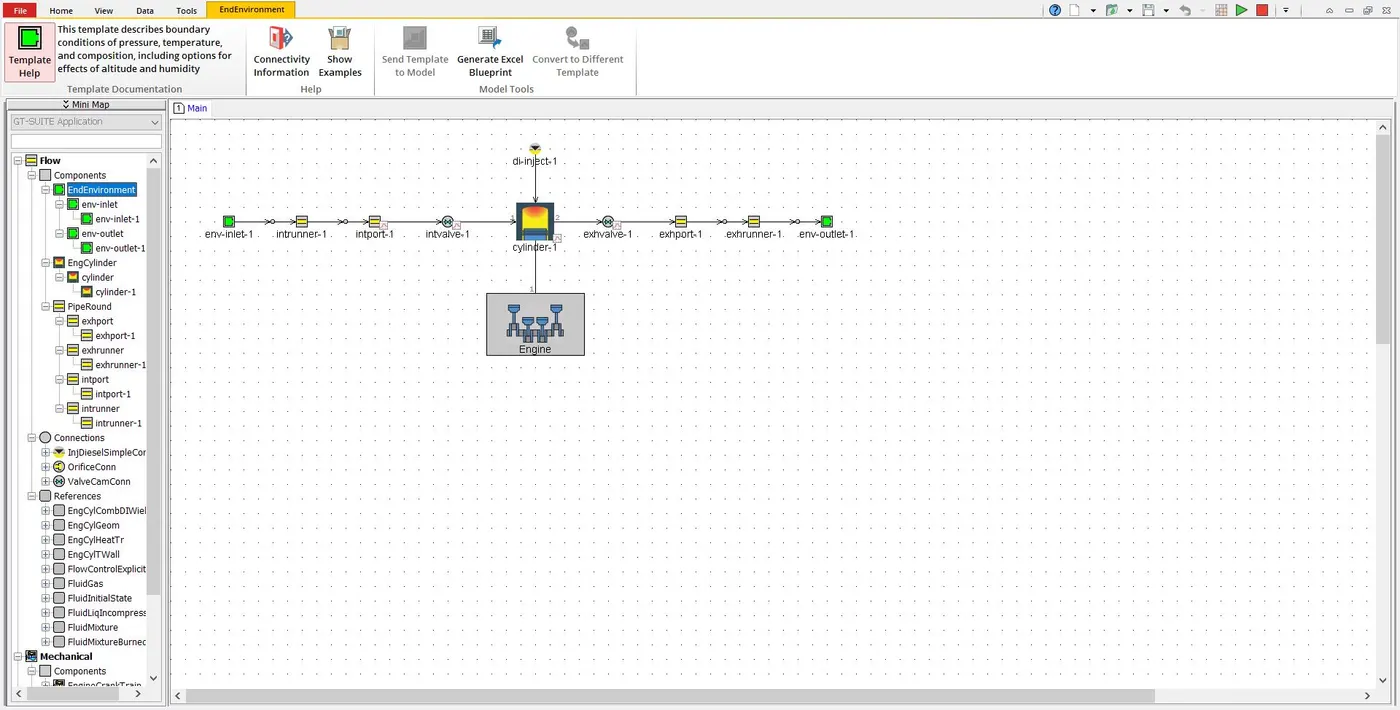
Now when we expand the Component template we can see the various objects such as EndEnvironment, EngCylinder and Pipe round. Now under the objects we see the different parts like engine inlet, outlet, cylinder and so on.
There are numerous factors to be considered while running the simulations, some critical factors are listed below
Time Control Flag
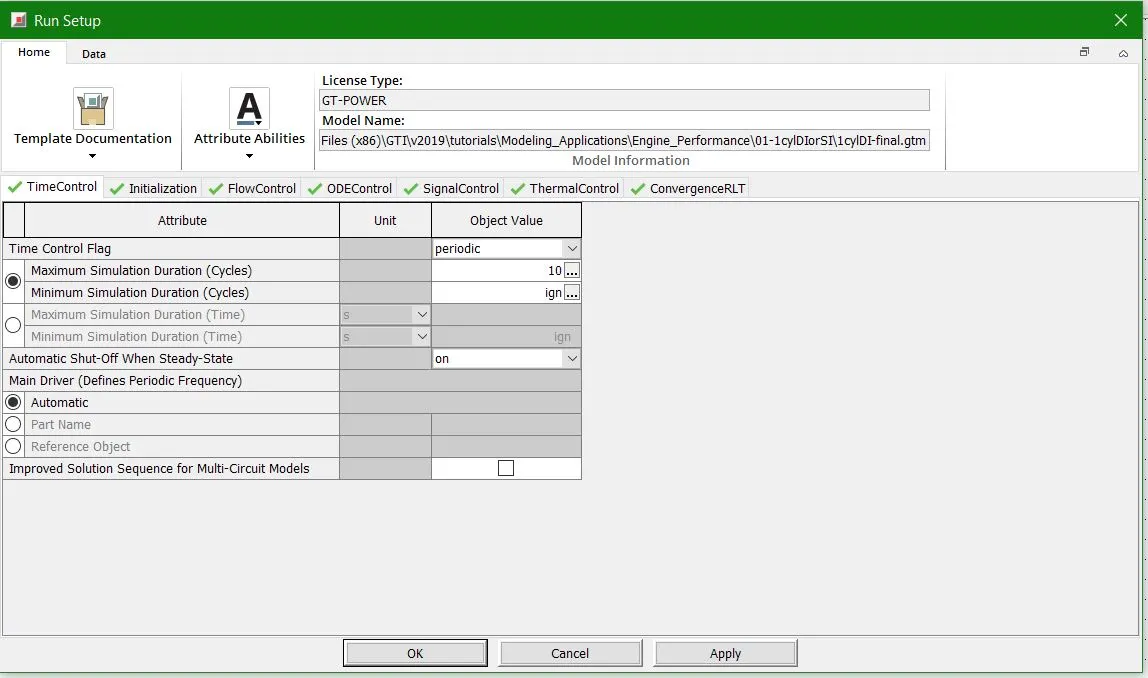
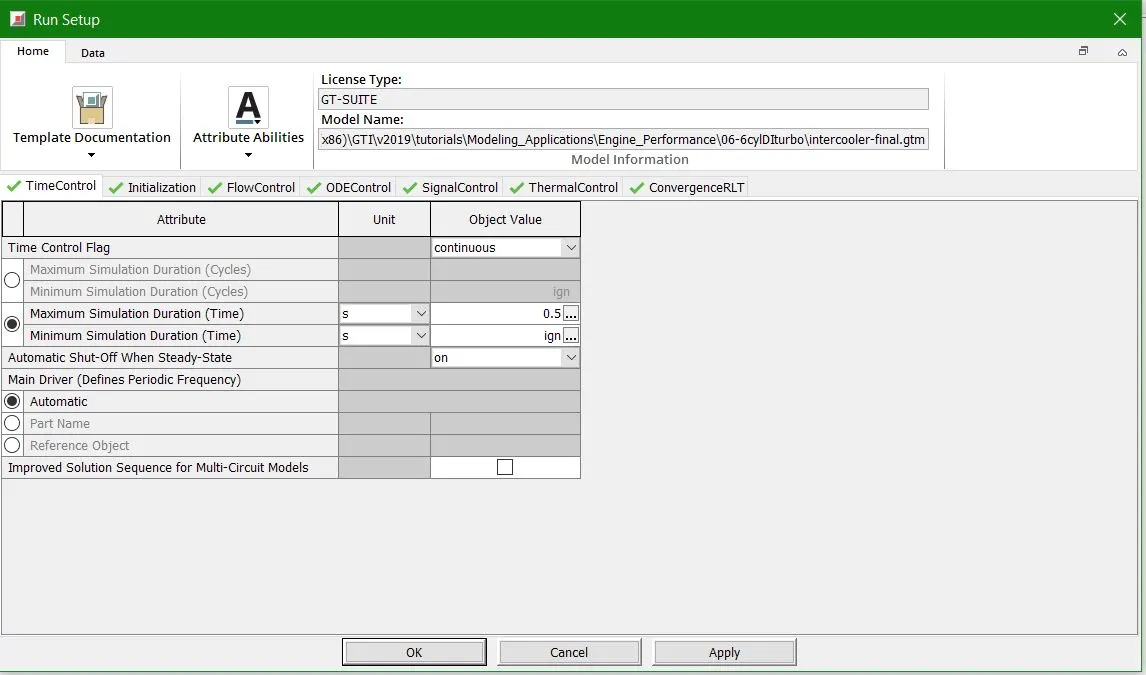
When we click on the Run setup option in the from the top menu the following dialog box opens which Time control flag has the following options
Time Step and Solution Control
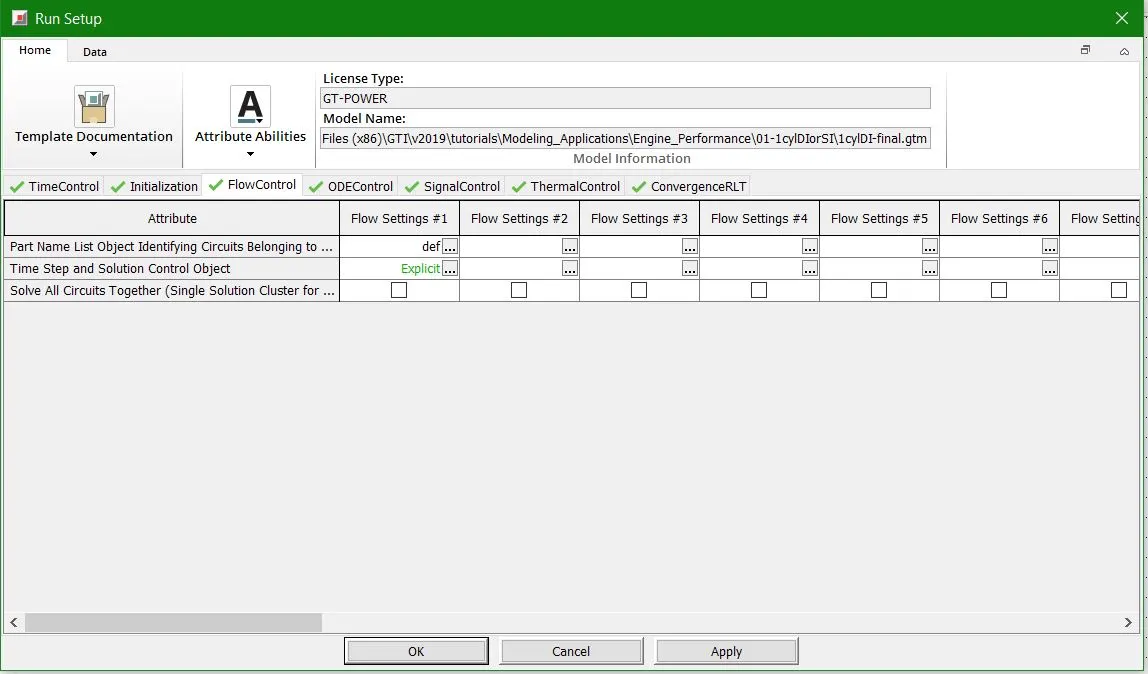
In the same run setup menu when we click on flow control we see the Time Step and Solution Control Step
Integration/Solver Type
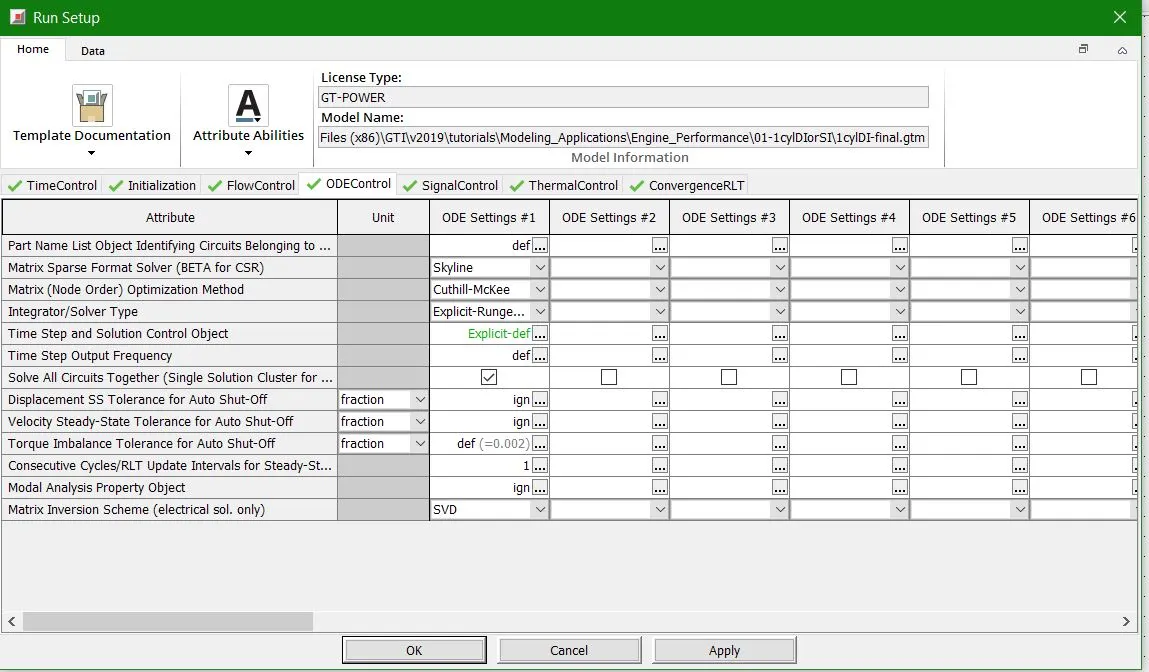
When we click on the ODE control we see the Integrator/solver option
INTERCOOLER TUTORIAL
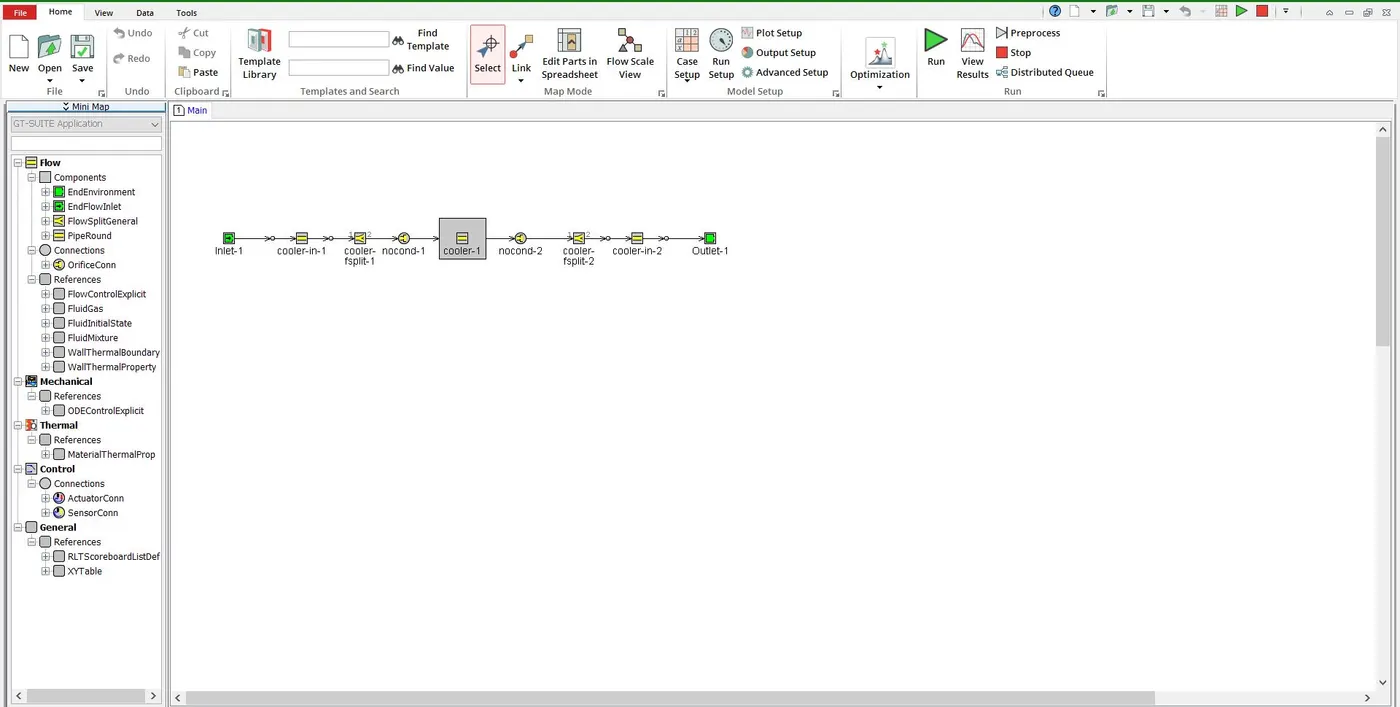
For the intercooler simulation setup we see the problem and the connection path which is already being setup by the tutorial.
Run Setup
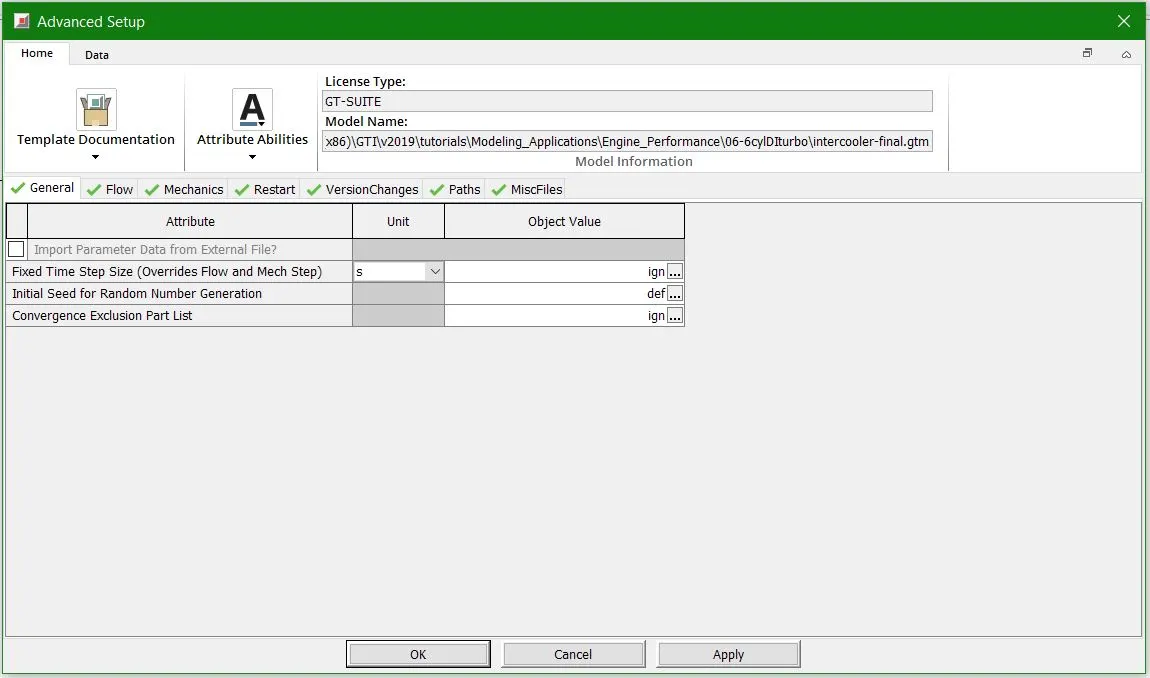
Advanced Setup
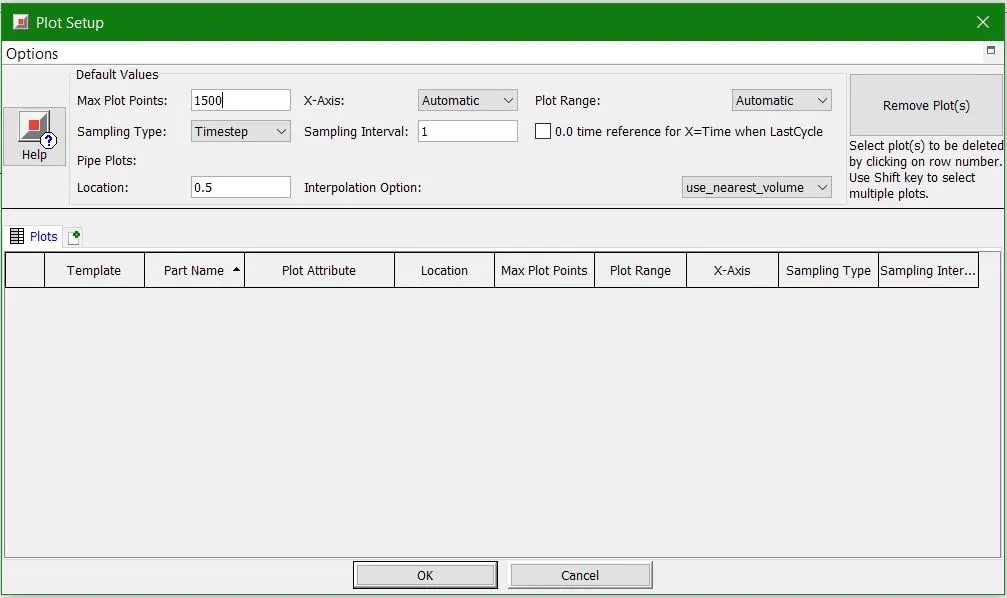
Plot Setup
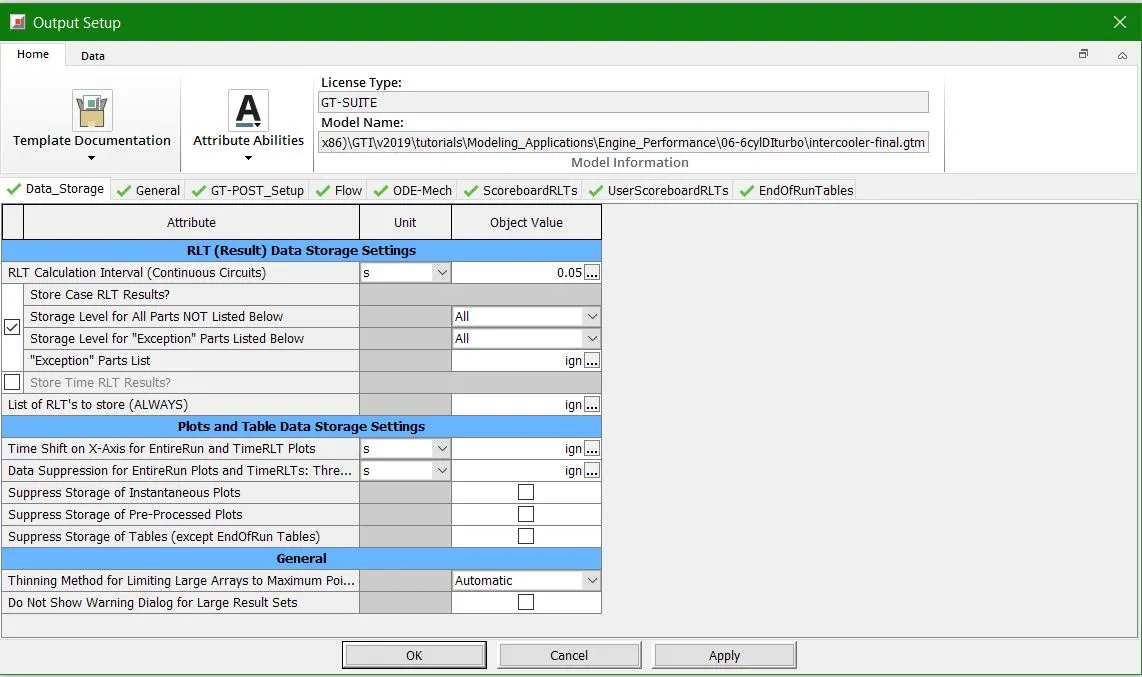
Output Setup
INTERCOOLER SIMULATION
Once the intercooler tutorial is loaded we have to set the simulation according to the given problem statement.
Cooler Dimensions
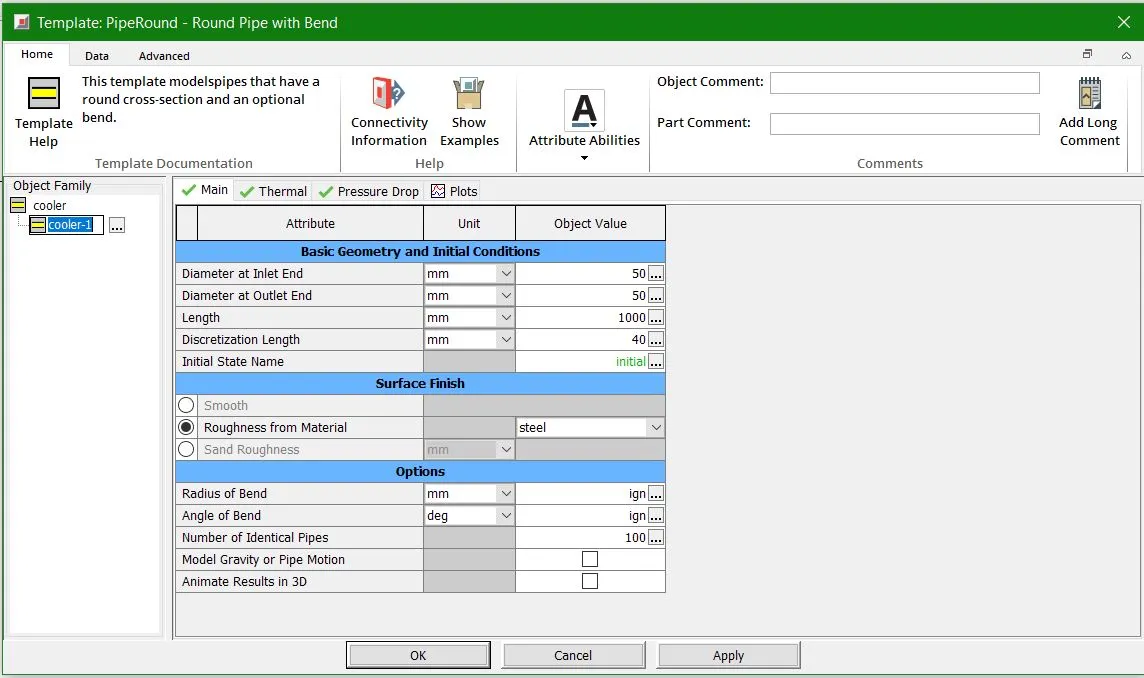
Now we see the following changes has been made to the air cooler dimensions are as follows
- inlet diameter = 50 mm
- outlet diameter = 50 mm
- length of the pipe = 1000 mm
Inlet Boundary Condition
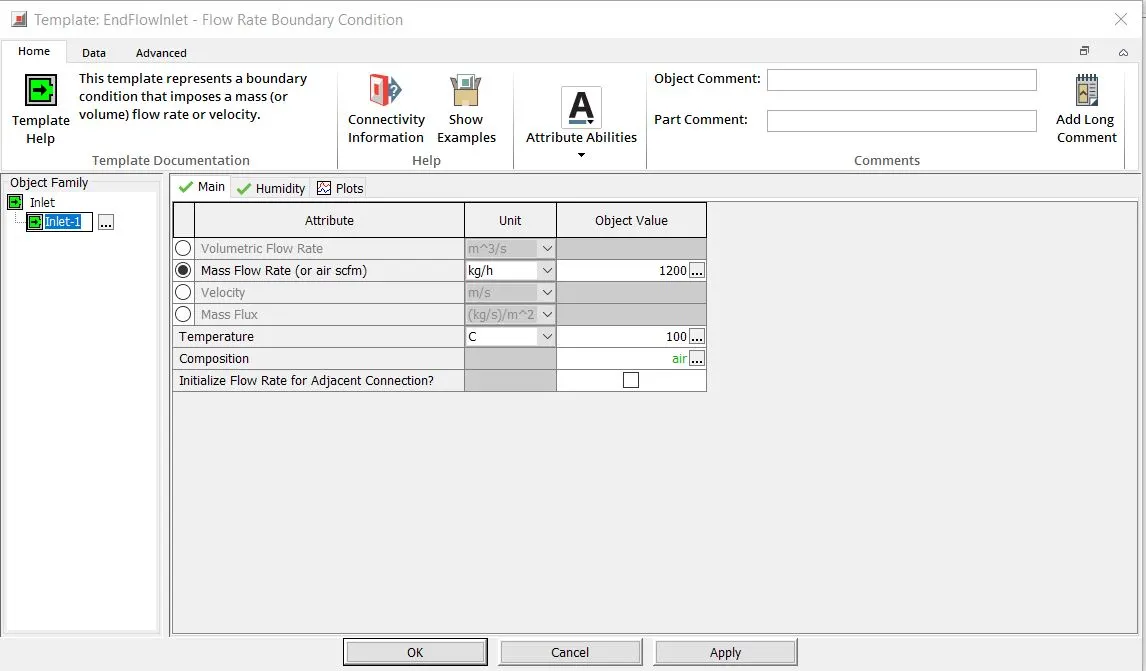
The inlet conditions for the air is mass flow rate of air is given as 1200 kg/hour @ 100 deg C
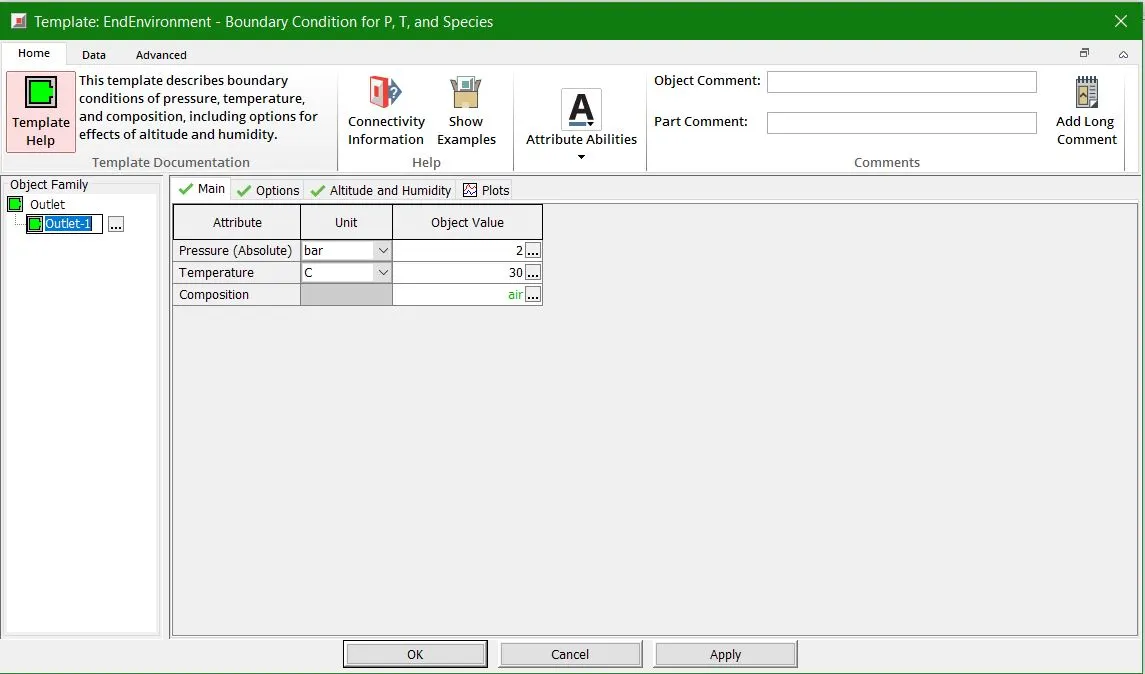
Outlet Boundary Condition
Run Setup
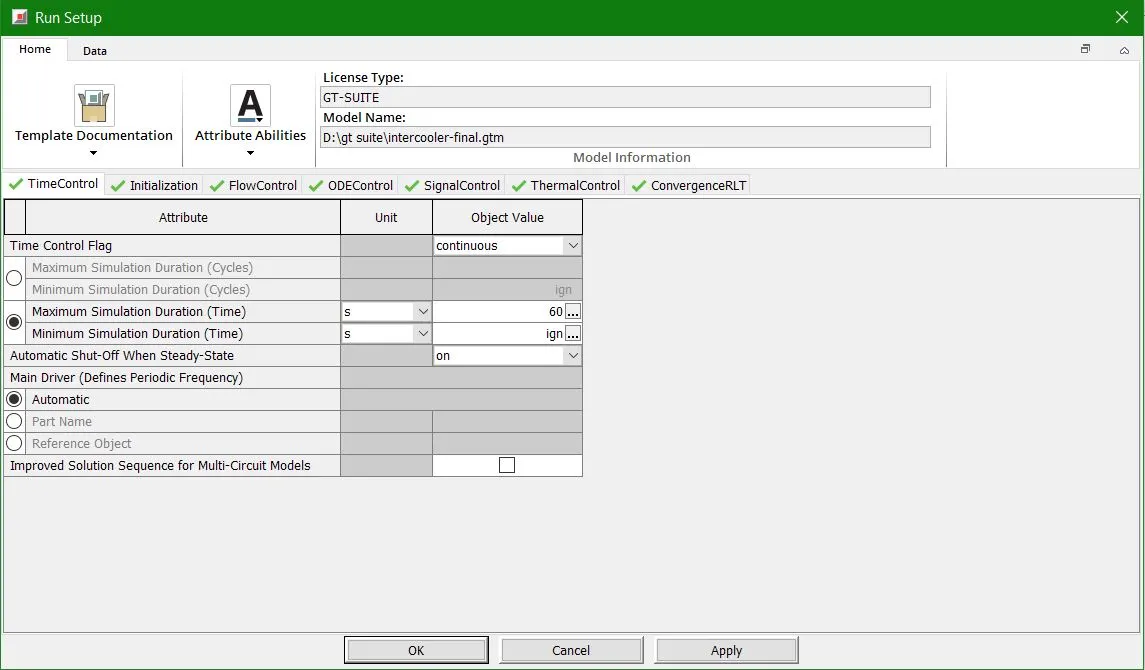
Here in the time control setting the simualtion was set to run for 60 seconds but the solution reached steady state after 2 seconds
Results
Pressure Plot
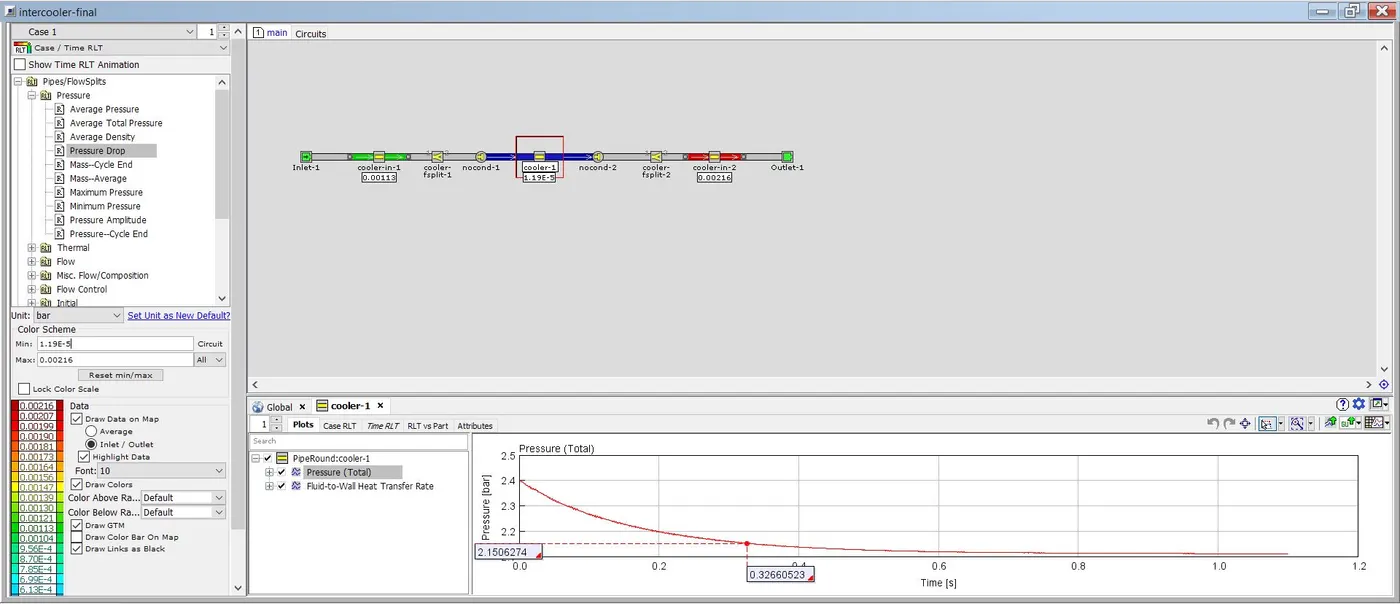
There is drop in the pressure when the air is passed through the intercooler and the pressure drops from 2.4 bar to minimum of 1.19e-5 bar
Heat Transfer Plot
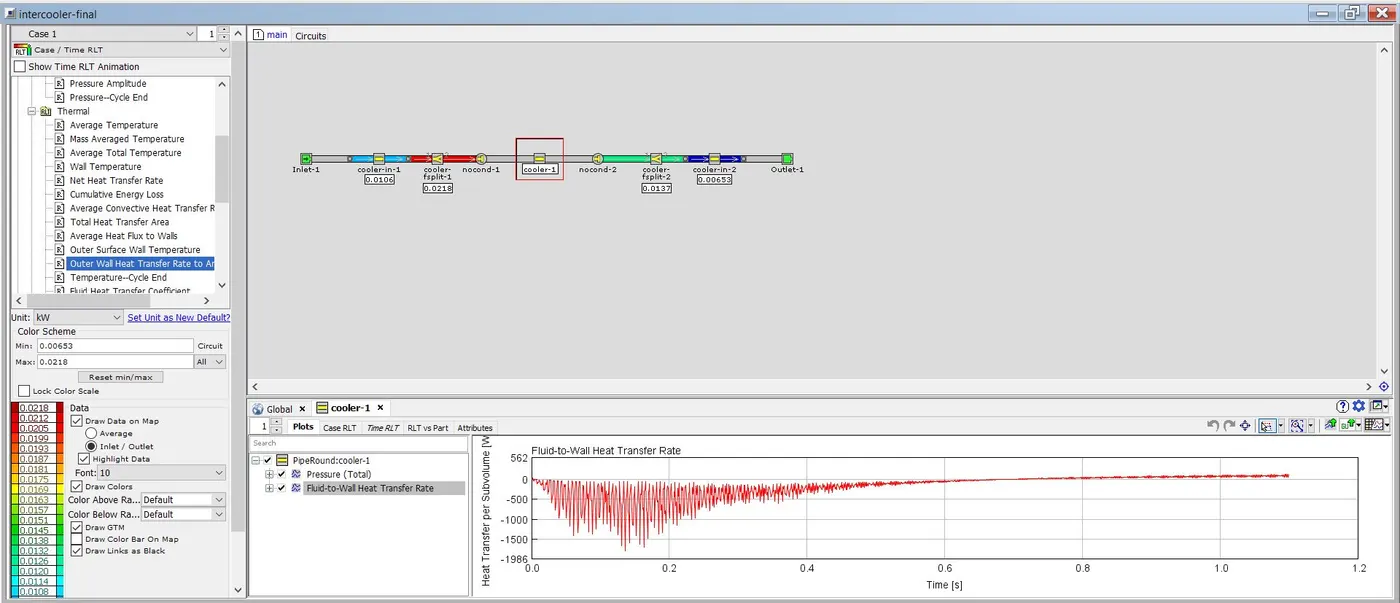
The heat transfer rate drops down to negative values which shows the loss of heat after the air is passed through the cooler.
CONCLUSION
- The graphics user interface of GT Suite is capable of handling multiple types of one-dimensional simulations
- Various models were explored in the software.
- The intercooler simulation was run to get a better understanding of the software
- There was a decrease in pressure and the heat transfer rate as the air cools down.