Week 5 - Curve fitting
curve fit
Aim: -
Writing a Python program to generate the best curve for given Temperature, specific heat data.
Objectives: -
- Able to generate best linear, cubic polynomial curve for given Cp data.
Description: -
Curve fitting is a process of constructing a curve or mathematical functions, which possess the closest proximity to the real series of data. By curve fitting, we can mathematically construct the functional relationship between the observed dataset and parameter values etc.
Q&A
1. What does popt and pcov mean?
popt:-
popt array contains Optimal values for the parameters(constants) of the function, so that the sum of the squared error of f(xdata, *popt) - ydata is minimized.
pcov:-
pcov is a 2d array contain the true variance and covariance(error) matrix for the fit parameters of popt. The diagonals provide the variance of the parameter estimate.
2. What does np.array(temperature) do?
np.array(temperature) converts the python list to numpy array
Python List:-
A list is the Python equivalent of an array, but is resizeable and can contain elements of different types.
Numpy array:-
A NumPy array is a grid of values, all of the same type, and is indexed by a tuple of nonnegative integers. The number of dimensions is the rank of the array. the shape of an array is a tuple of integers giving the size of the array along each dimension.
Numpy data structures perform better in:
- Size - Numpy data structures take up less space
- Performance - they have a need for speed and are faster than lists
- Functionality - SciPy and NumPy have optimized functions such as linear algebra operations built-in.
3. What does the * in *popt mean?
popt is the name of the list variables (notation of list variables)
The * notation will expand a list of values into the arguments of the function. This is useful if your function has more than one or two parameters.
4. Write code to fit a linear and cubic polynomial for the Cp data. Explain if your results are good or bad.
Note:- use SublimeREPL-python to run the code
Procedure: -
- Declare the polynomial functions
- write a function code to open the data file and read the file line by line.
- split and extract the data and append the data to their respective list.
- Select the suitable degree of the polynomial (linear, cubic).
- Find popt, pcov
- using temperature values and popt values find best fitted cp values
- Plot the Cp_actual v/s Temperature, Cp_fitted v/s Temperature.
- Observe the deviation of the curve and error of the curve.
Main Program: -
# curve fit
import math                         # importing math library
import matplotlib.pyplot as plt     # importing ploting library
import numpy as np                  # importing numpy module
from scipy.optimize import curve_fit # importing curve fit tool from scipy module

# Curve fit functions
def func1 (t, a, b):            # Linear fit function
	return  a*t + b

def func2 (t, a, b, c):
	return a*pow(t,2) + b*t + c   # Quardratic fit function

def func3 (t, a, b, c, d):
	return a*pow(t,3) + b*pow(t,2) + c*t + d  # Cubic fit function

# Reading thermodynamic data file
def read_file():
	temperature = []
	cp =[]
	# reading data file and assinging each line to tempory line variable

	for line in open('data', 'r'):
		values = line.split(',')
		temperature.append (float(values[0]))
		cp.append(float(values[1]))
	return [temperature, cp]

temperature, cp = read_file()
# Main program
print('choose the type of curve fit \n1) Linear curve fit \n2) Quadratic curve fit \n3) Cubic curve fit')
case = int(input('Enter the type as number :\n'))
if case == 1:
	name = 'Linear curve fit'
	popt, pcov = curve_fit(func1, temperature, cp)   # calclating optimum coefficent values and their variance and converiance
	fit_cp = func1(np.array(temperature), *popt)     # finding best values for cp using function by passing temperature and coefficent vales into function
elif case == 2:
	name = 'Quadratic curve fit'
	popt, pcov = curve_fit(func2, temperature, cp)
	fit_cp = func2(np.array(temperature), *popt)
elif case == 3:
	name = 'Cubic curve fit'
	popt, pcov = curve_fit(func3, temperature, cp)
	fit_cp = func3(np.array(temperature), *popt)

# plotting results
plt.plot(temperature, cp,color="blue",linewidth=3)
plt.plot(temperature, fit_cp,, linewidth=3)
plt.legend(['Actual Curve', 'Fitted Curve'])
plt.xlabel('Temperature [K]')
plt.ylabel('Cp Kj/kg')
plt.title(name)
plt.show()
Output/Result graph: -
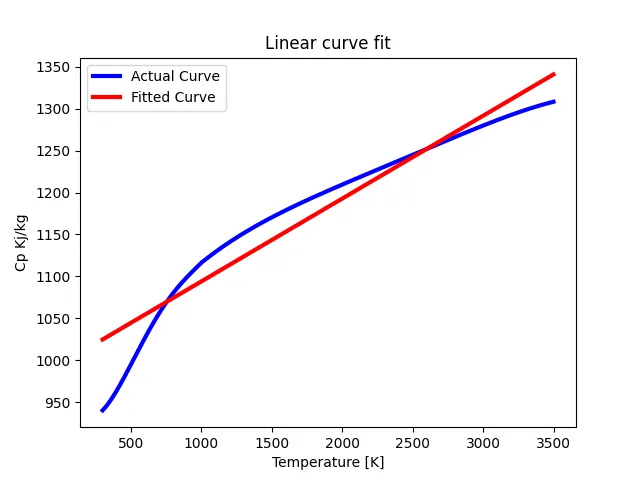
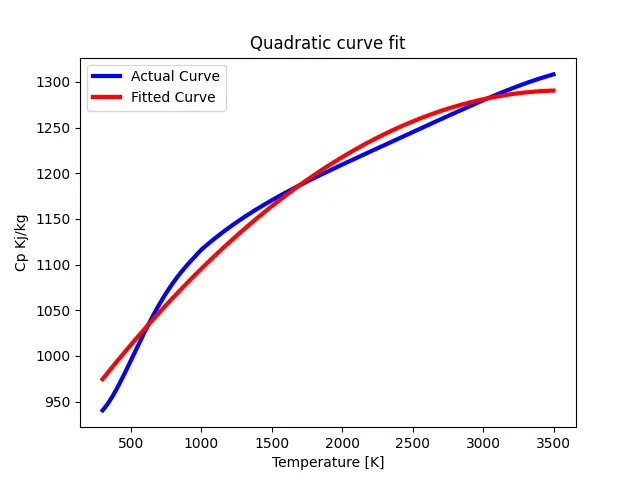
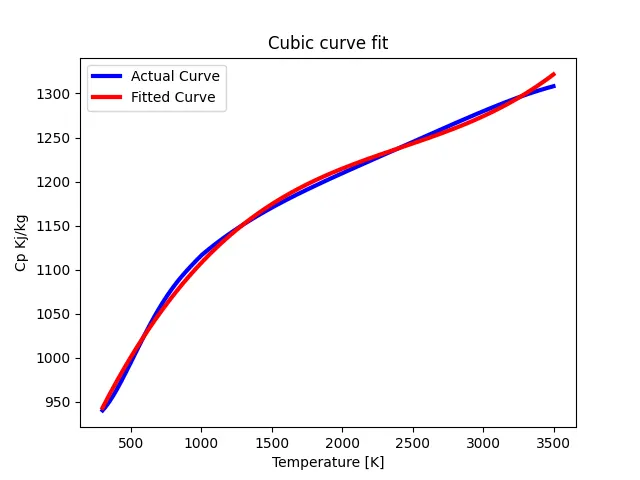
Conclusions: -
- Fig 1-3 shows that as the degree of polynomial increases leads to get a better and better curvefit. The quality of the curve depends on the degree of polynomial selected within the conditions.
5. What needs to be done in order to make the curve fit perfect?
- By increasing the degree of the polynomial that we want to fit to the data
- By splitting the data in such a way that lower order function polynomial can fit accuretly.