Week 6 - Data analysis
Data analysis:- file parsing, and data extraction
Aim:-
write a script code that reads the data from the input file and takes column numbers as the input and plot the respective columns as separate images.
Basic performance calculation:-
- Calculate the area under the P-V diagram.
- Calculate the power output of this engine.
- Calculate its specific fuel consumption.
Given data:
The data file is https://drive.google.com/file/d/1SzKJngJcgJkvhJGGGDYY3JwLoc2o5_lQ/view?usp=sharing
Engine RPM = 1500
Fuel consumption = 20 micro grams per 1 stroke cycle
Procedure:-
- import required libraries.
- first, use the try command to open and read the file if a file does not exist except for an error and print "File not recognized. Please provide a valid CONVERGE output file" exit the system.
- if a file exists read the file line by line using for loop.
- first 5 lines of code are comments extract parameters from line 3 and their respective units from line4.
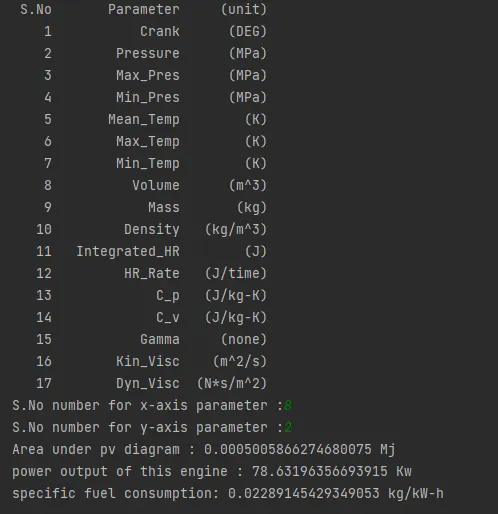
- print serial number, parameters & units side by side.
- Now ask the user to give serial numbers as x,y parameters as input.
- Based on given inputs extract respective parameter, units, and their values.
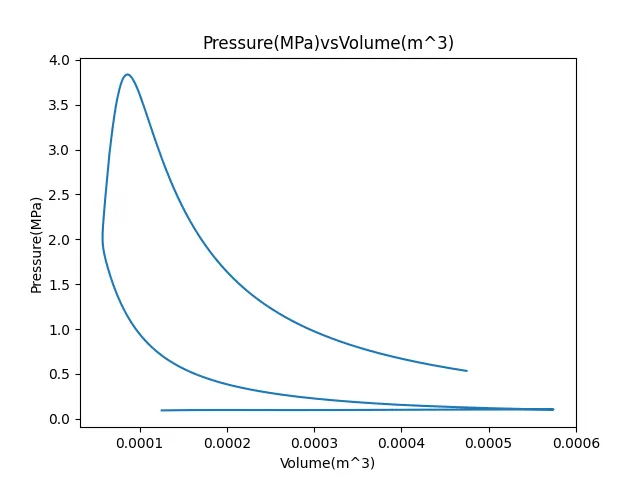
- plot the respective x,y columns as separate images.
- Calculate the area under the P-V diagram, power output of this engine, & specific fuel consumption and print the results.
Main Code:-
# DATA ANALYSIS
import math
import numpy as np
import matplotlib.pyplot as plt

# separate the coloumn
data_file = 'engine_data.out'

try:
	file = open(data_file,'r')
except:
	print("File not recognized. Please provide a valid CONVERGE output file")
	sys.exit()

line_count = 1

for line in file:

	if line_count == 3:
		parameters = line.split()

	if line_count == 4:
		units   = line.split()

	if line_count == 6:
		coloumn = line.split()

	line_count += 1
len_column = len(coloumn)
# print(len(coloumn))

# showing the quantities along with their coloumn number
print("%5s %15s %10s" %("S.No", "Parameter", "(unit)"))
for i in range(len_column):
	# print (i+1,'\t',parameters[i+1],'\t',units[i+1])
	print ("%5d %15s %10s" % (i+1, parameters[i+1], units[i+1]))

# enter the coloumn number for x and y axis
x = int(input('S.No number for x-axis parameter :'))
y = int(input('S.No number for y-axis parameter :'))

# print(x,y)
X_values = []
Y_values = []
P  = []
V  = []

line_count = 1
for line in open(data_file, 'r'):
	# print(line)

	if line_count == 3:
		x_parameter = line.split()[x]
		y_parameter = line.split()[y]

	if line_count == 4:
		x_axis = x_parameter + line.split()[x]
		y_axis = y_parameter + line.split()[y]

	if (line_count >= 6 and x <= len_column and y <= len_column):
		coloumn = line.split()
		X_values.append(float(coloumn[x-1]))
		Y_values.append(float(coloumn[y-1]))
		P.append(float(coloumn[1]))
		V.append(float(coloumn[7]))

	line_count += 1

# Ploting
plt.plot(X_values,Y_values)
plt.xlabel(x_axis)
plt.ylabel(y_axis)
plt.title(y_axis + 'vs' + x_axis)
plt.savefig(y_axis + 'vs' + x_axis + '.png')
plt.show()


# Performance calculation
area = np.trapz(P, V)
print('Area under pv diagram :', area, 'Mj')

rpm = 1500
workdone = area * 1e+3        # kj
power_in_kW = 2*math.pi*rpm * workdone/60
print('power output of this engine :', power_in_kW, 'Kw')

fuel_consumed_per_stroke = 20e-6
fuel_consumed_per_hour = 20e-6*rpm*60    # kg/hr
sfc = fuel_consumed_per_hour/power_in_kW
print('specific fuel consumption:', sfc, 'kg/kW-h')
Plots:-
Results: