Project 1 - Parsing NASA thermodynamic data
Parsing of NASA thermodynamic data
Aim: -
Analyze and extract the NASA thermodynamic data of species to evaluate thermodynamic properties such as Cp, H, S, & molecular weight of species.
Objectives: -
- Able to extract polynomial co-efficient from NASA thermodynamic data.
- Able to find thermodynamic properties such as Cp, H, and S for all the species in data.
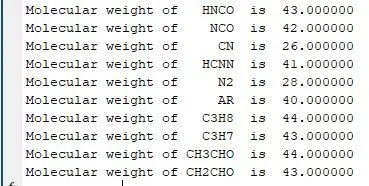
- Able to find the molecular weight of species.
Description: -
NASA came up with polynomials that can be used to evaluate thermodynamic properties such as Cp, H, and S. They have also documented the co-efficient that are required to evaluate these polynomials for 1000+ species. In this assignment, we have the data of 53 species to evaluate.
- Parsing: - analyze (a string or text) into logical syntactic components. (or) resolve (a sentence) into its component parts and describe their syntactic roles.
- Specific heat: Cp: - the ratio of the quantity of heat required to raise the temperature of a body one degree to that required to raise the temperature of an equal mass of water one degree.
- Enthalpy, H: - the sum of the internal energy and the product of the pressure and volume of a thermodynamic system
- Entropy, S: - the measure of a system's thermal energy per unit temperature that is unavailable for doing useful work.
Formulae: -
`Cp = R (a1 +a2 T + a3 T^2 +a4 T^3 + a5 T^4)`
`H = RT (a1 + a2 T /2 + a3 T^2 /3 + a4 T^3 /4 + a5 T^4 /5 + a6 1/T)`
`S = R (a1 lnT + a2 T + a3 T^2 /2 + a4 T^3/3 + a5 T^4 /4 + a7)`
Procedure: -
- Open and read the ‘THERMO.dat’ file. https://drive.google.com/file/d/1AikCHDlz9s_fu8whE81qee_GD4AyYpCP/view
- Extract global temperatures from data.
- Extract species name, Tmin, Tmax, Toptium from data.
- Extract 14 co-efficient of each species. 1-7 are low-temperature coefficients, 8-14 are the high-temperature coefficients.
- Create a function file1 to calculate the Cp, H, & S by taking constants and temperature as inputs.
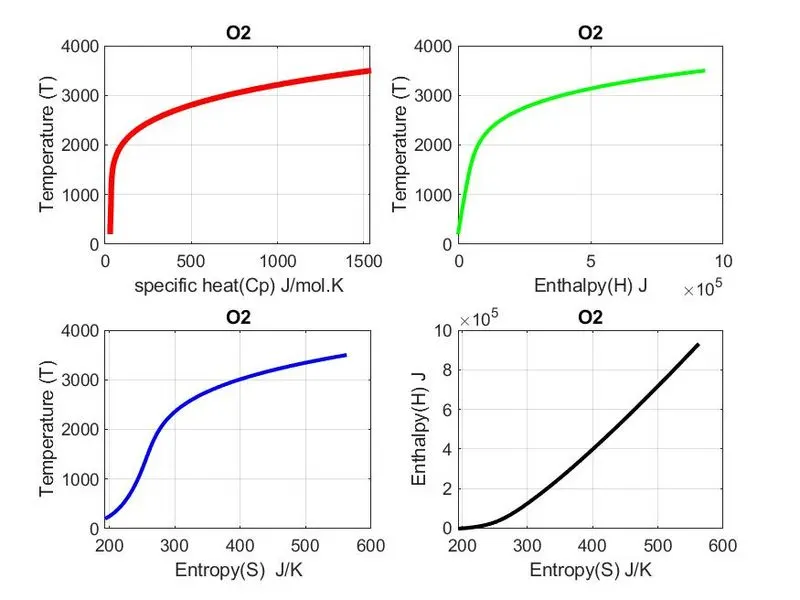
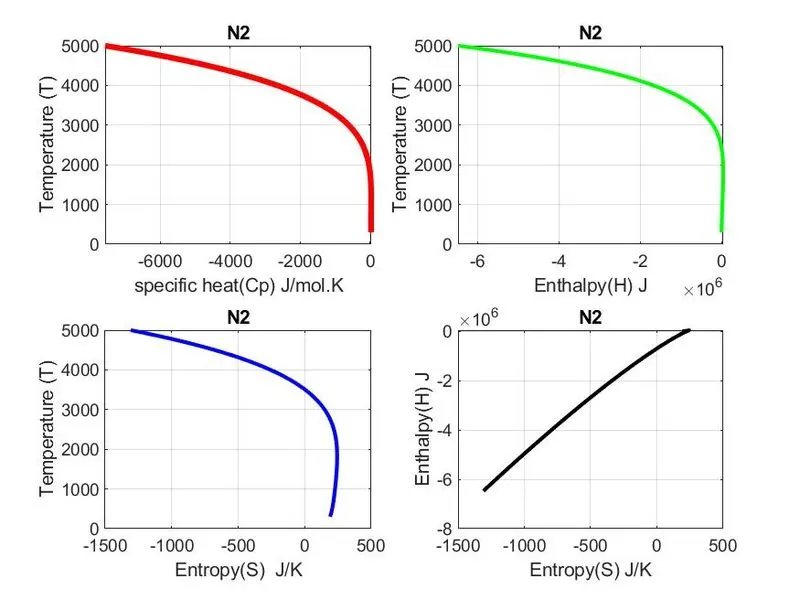
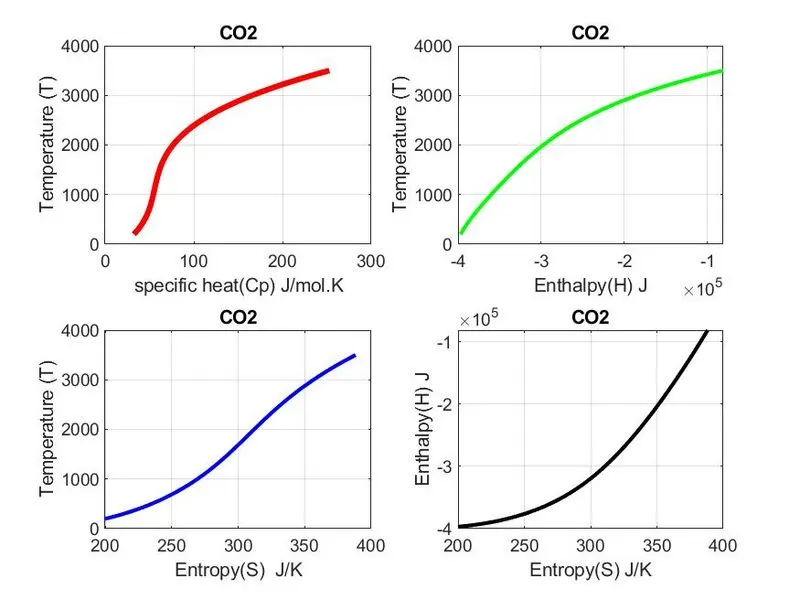
- Calculate Cp, H, & S and plot the results T vs Cp, T vs H, T vs S, & H vs S graphs.
- Create a new folder and save the plots of each species in a separate folder and the folder name should be the same as the species name.
- Create a case insensitive function file2 to calculate the molecular weight of the species by taking the species name(string) as input.
- To make my program case insensitive i used the UPPER command to convert small letters to capital letters.
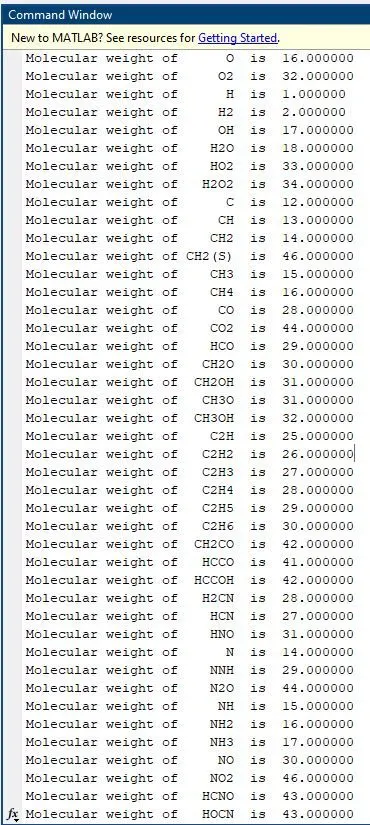
- Find the molecular weight of each species and save the text in a document.
- Print the molecular weights on the command window.
Function program to calculate Cp, H, & S: -
function [Cp, H, S] = species_C_H_S(R,T,a1,a2,a3,a4,a5,a6,a7)

Cp = R.*(a1+(a2.*T)+(a3.*(T.^2))+(a4.*(T.^3))+(a5.*(T.^4)));
H  = R.*T.*(a1+((a2.*T)./2)+((a3.*(T.^2))./3)+((a4.*(T.^3))./4)+((a5.*(T.^4))./5)+(a6./T));
S  = R.*((a1.*log(T))+(a2.*T)+((a3.*(T.^2))./2)+((a4.*(T.^3))./3)+((a5.*(T.^4))./4)+a7);

end
Function program to calculate Molecular weight of species: -
function [weight] = M_weight(molecule_name)
elements = {'H', 'O',  'N', 'C', 'S', 'A'};
atomic_mass = [1, 16, 14, 12, 32, 40];
molecule_name = upper(molecule_name);
molecule_name1 = convertContainedStringsToChars(molecule_name);
weight = 0;
for k = 1:length(molecule_name1)
   for m = 1:length(elements)
      if strcmp(molecule_name1(k),elements(m))
       weight = weight + atomic_mass(m);
       p = m;
      end
   end
   n = str2double(molecule_name1(k));
  if n>1
      weight = weight + (n-1)*atomic_mass(p);
  end
end
end
Case insensitive user-defined Matlab code to find molecular weight: -
clear all; close all; clc;

M = 'Enter the molecule name containing(H,O,N,C,S,Ar) 1-9 numbers:-';
M_name = convertContainedStringsToChars(string(inputdlg(M,'s')));

weight = M_weight1(M_name);
B = sprintf('Molecular weight of %6s  is  %f',M_name,weight);
disp(B)
Main Program: -
clear all; close all; clc;

file = fopen('THERMO.dat','r');
heading_ln1 = fgetl(file);
global_temperatures_ln2 = fgetl(file);
R = 8.314;	%J/(K⋅mol)
version  = fgetl(file);
comment2 = fgetl(file);
comment3 = fgetl(file);

current_folder = pwd;
new = 'species';
mkdir(new)

file1 = fopen('weight.txt','w');
fprintf(file1,'%3s  %18s   %8s  %s  %5s \n','S.no',' ', 'molecule',' ', 'weight');
%%
Total_time = 0;
for i = 1:53
molecule = fgetl(file);
molecule1 = strsplit(molecule,' ');
molecule_name = string(molecule1(1));
Tmin = str2double(molecule(49:56));
Tmax = str2double(molecule(58:66));
Tmiddle = str2double(molecule(68:75));
ls_1_5con = fgetl(file);
ls_6_10con = fgetl(file);
ls_11_14con = fgetl(file);
la1  = str2double(ls_1_5con(1:15));
la2  = str2double(ls_1_5con(16:30));
la3  = str2double(ls_1_5con(31:45));
la4  = str2double(ls_1_5con(46:60));
la5  = str2double(ls_1_5con(61:75));
la6  = str2double(ls_6_10con(1:15));
la7  = str2double(ls_6_10con(16:30));
ha1  = str2double(ls_6_10con(31:45));
ha2  = str2double(ls_6_10con(46:60));
ha3  = str2double(ls_6_10con(61:75));
ha4  = str2double(ls_11_14con(1:15));
ha5  = str2double(ls_11_14con(16:30));
ha6  = str2double(ls_11_14con(31:45));
ha7  = str2double(ls_11_14con(46:60));
T = linspace(Tmin,Tmax,250);
%%
 tic
    for j = 1:length(T)
if T <= Tmiddle
     [Cp, H, S]    = species_C_H_S(R,T,la1,la2,la3,la4,la5,la6,la7);
else, [Cp, H, S]    = species_C_H_S(R,T,ha1,ha2,ha3,ha4,ha5,ha6,ha7);
end
    figure(i);
    subplot(2,2,1);
    plot(Cp,T,'linewidth',3,'color','r'); xlabel('specific heat(Cp) J/mol.K'); ylabel('Temperature (T)'); grid on; title(molecule_name)
    subplot(2,2,2);
    plot(H,T,'linewidth',2,'color','g'); xlabel('Enthalpy(H) J'); ylabel('Temperature (T)'); grid on; title(molecule_name)
    subplot(2,2,3);
    plot(S,T,'linewidth',2,'color','b'); xlabel('Entropy(S)  J/K'); ylabel('Temperature (T)'); grid on; title(molecule_name)
    subplot(2,2,4);
    plot(S,H,'linewidth',2,'color','k'); xlabel('Entropy(S) J/K'); ylabel('Enthalpy(H) J'); grid on; title(molecule_name)
time(i) = toc;
    end
%%
    cd(new)
    mkdir(molecule_name)
    cd(molecule_name)
     saveas(i,'graph.jpg')
    cd(current_folder)
%%
weight = M_weight(molecule_name);
fprintf(file1,'%3.2d)  Molecular weight of  %7s  is  %3.4f \n',i, molecule_name, weight);
A = sprintf('Molecular weight of %6s  is  %f',molecule_name,weight);
disp(A)

end
time1 = cumsum(time);
B = sprintf('\nTotal time required to run this code is = %f sec',time1(1,end));
disp(B)
fclose(file1);
fclose(file);
Output/Result graph: -
GRAPHS:- O2, N2, CO2
Molecular weights:-


References
https://in.mathworks.com/help/matlab/ref/fopen.html
https://in.mathworks.com/help/matlab/ref/fgetl.html
https://in.mathworks.com/help/matlab/ref/pwd.html
https://in.mathworks.com/help/matlab/ref/mkdir.html
https://in.mathworks.com/help/matlab/ref/cd.html
https://in.mathworks.com/help/matlab/ref/if.html
https://in.mathworks.com/help/matlab/ref/strsplit.html
https://in.mathworks.com/help/matlab/ref/str2double.html
https://in.mathworks.com/help/matlab/ref/fprintf.html
https://in.mathworks.com/help/matlab/ref/convertcontainedstringstochars.html