Week 2 - Flow over a Cylinder.
Steady / Unsteady Flow over a Cylinder.
AIM:-
Simulate the flow over a cylinder and explain the phenomenon of Karman vortex street.
Objectives:-
PART-I: steady-state simulation
- Simulate the flow over cylinder using a steady-state Solver and calculate the coefficient of drag and lift over a cylinder by setting the Reynolds number to 10,100,1000,10000 & 100000.
Part-II: Unsteady (Transient) Simulation
- Simulate the flow over cylinder using a Transient Solver and calculate Strouhal Number, coefficient of drag and lift over a cylinder by setting the Reynolds number to 100
vortex shedding:-
vortex shedding is an oscillating flow that takes place when a fluid such as air or water flows past a bluff (as opposed to a streamlined) body at certain velocities, depending on the size and shape of the body. In this flow, vortices are created at the back of the body and detach periodically from either side of the body forming a Von Karman Street. The fluid flow past the object creates alternating low-pressure vortices on the downstream side of the object. The object will tend to move toward the low-pressure zone.
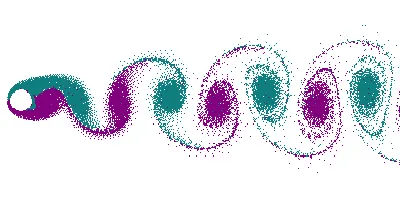
If the bluff structure is not mounted rigidly and the frequency of vortex shedding matches the resonance frequency of the structure, then the structure can begin to resonate, vibrating with harmonic oscillation driven by the energy of the flow. This vibration is the cause for overhead power line wires humming in the wind and for the fluttering of automobile whip audio antennas at some speeds. Tall chimneys constructed of thin-walled steel tubes can be sufficiently flexible that, in airflow with a speed in the critical range, vortex shedding can drive the chimney into violent oscillations that can damage or destroy the chimney.
Von Karman Street:-
In fluid dynamics, a Von Karman Street is a repeating pattern of swirling vortices, caused by a process known as vortex shedding, which is responsible for the unsteady separation of flow of a fluid around blunt bodies.
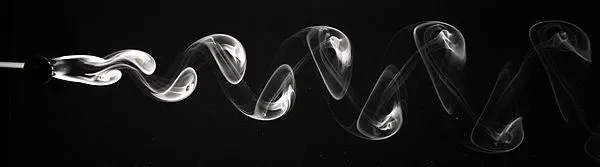
A vortex street will form only at a certain range of flow velocities, specified by a range of Reynolds Number(Re), typically above a limiting Re value of about 90.
Strouhal number
Strouhal number
Strouhal number is a dimensionless number describing oscillating flow mechanisms.
The Strouhal number is often given as
- `S_t = (fL)/U`
where
f = frequency of vortex shedding.
L = characteristic length (for example, hydraulic diameter or the airfoil thickness).
U = flow velocity.
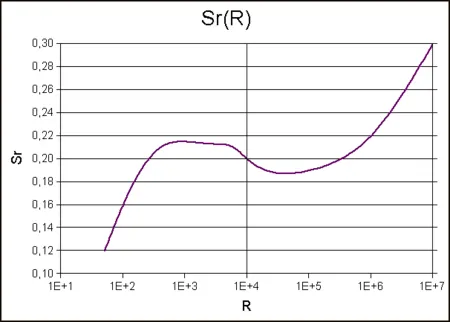
Strouhal number (Sr) as a function of the Reynolds number (Re) for a long circular cylinder.
Procedure:
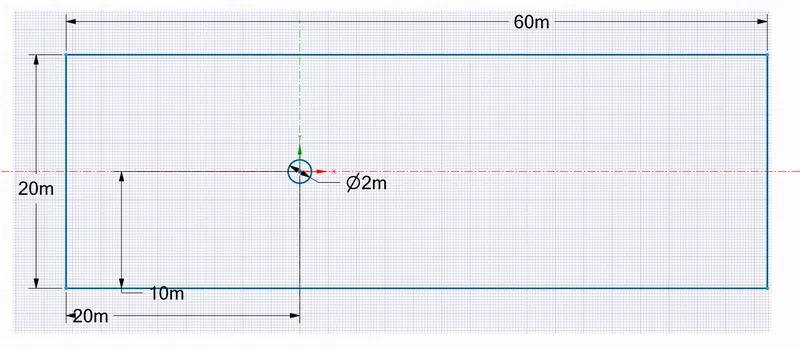
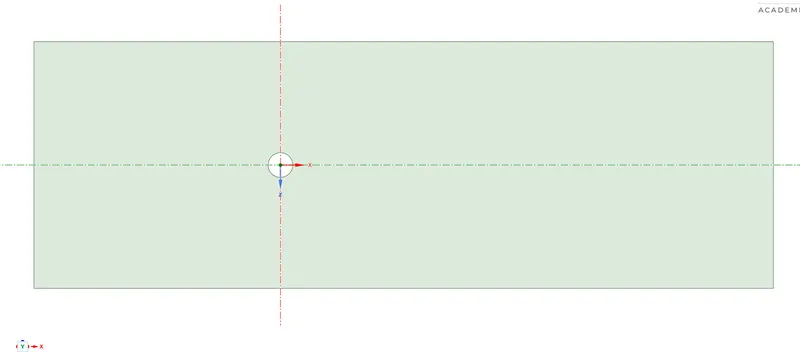
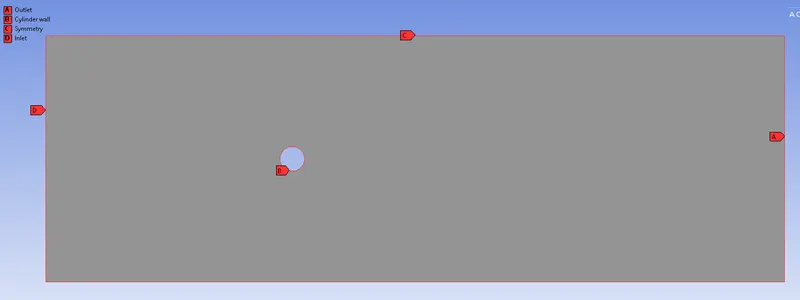
Geometry:- 2 -D rectangular surface 60*20m and a hole of Dia 2 m in it.
Mesh:-
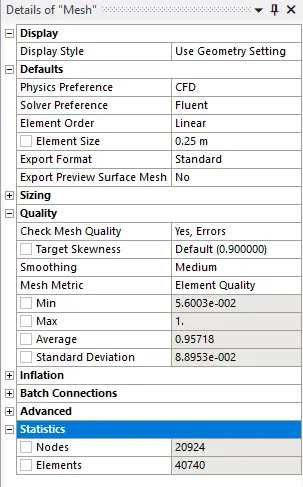
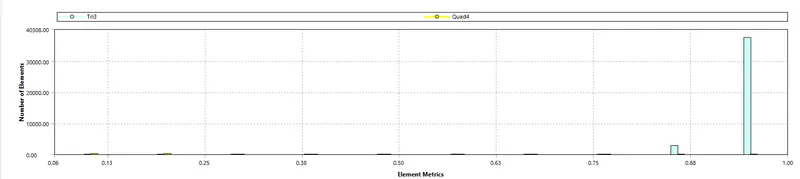
- Nodes = 20924
- Elements = 40470
I used 3 methods to generate god quality mesh
1) Triangle dominant mesh with element size = 0.25m.
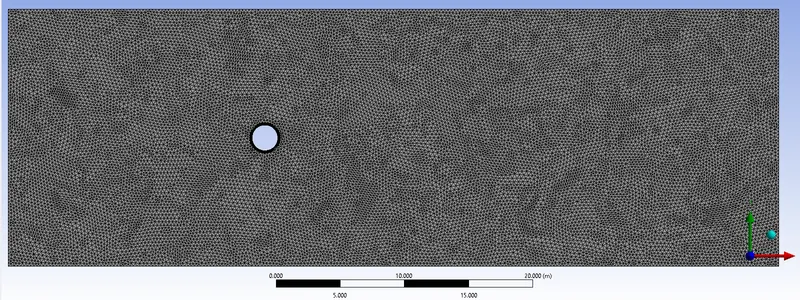
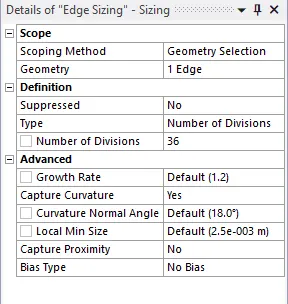
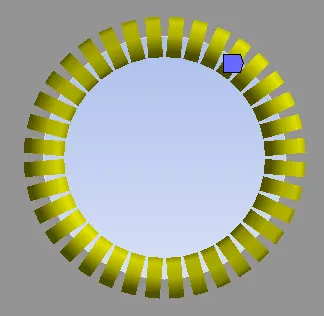
2) Edge sizing 36 divisions on cylinder
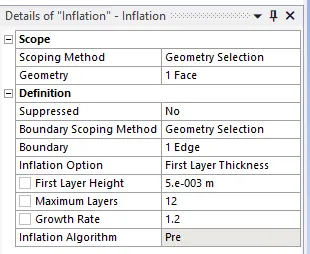
3) Inflation layers
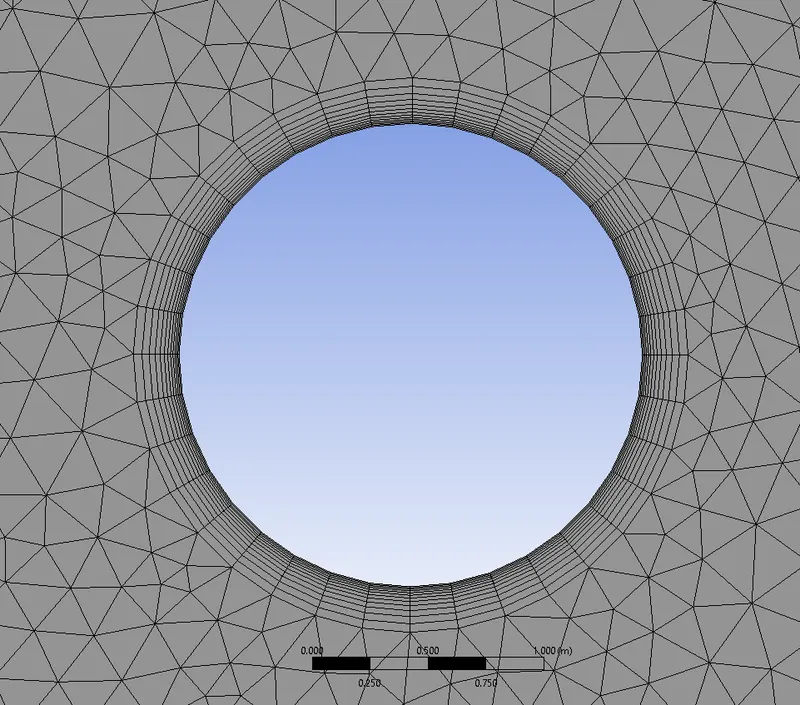
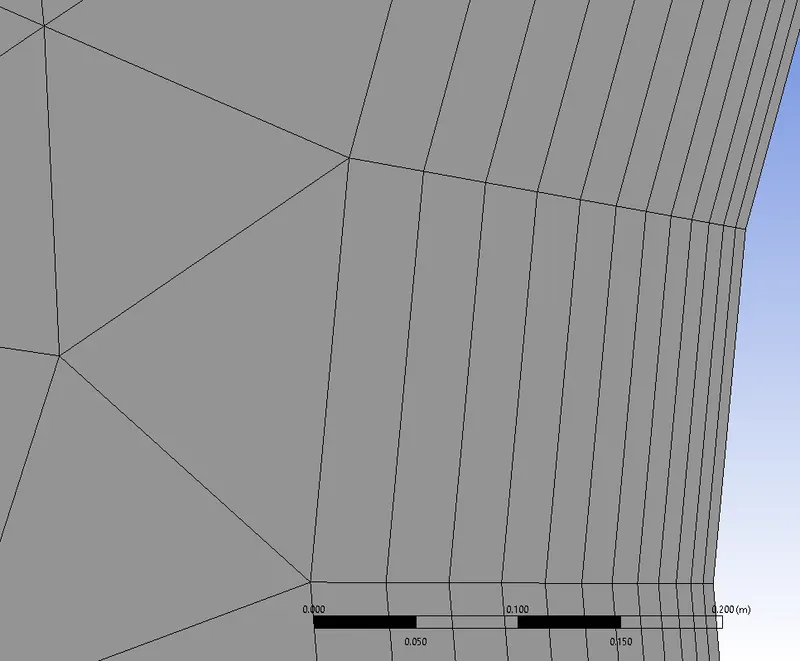
- number of layers over the cylinder = 12
- first-layer thickness = 5e-3
- growth rate = 1.2.
Quality:-
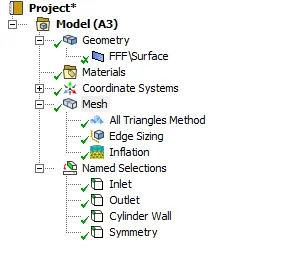
Creating named sections
Setup:
- Fluent launcher Double-precision Parallel solving with 4 solvers.
- Check the mesh & report quality.
- Setup
- General:- Type = Pressured Based, Absolute Velocity Formation & Time =both Steady and Transient.
- Models:- Viscous model:- Laminar
- Materials:- Copy air-fluid material from fluent database to create user-defined fluid with density = 1 Kg/m3, Viscosity(Kg/m-s) = 0.02 calculated from Renolds number formulae.
- Cell zone conditions:- user-defined fluid in the region.
- Boundary conditions:-
- Cylinder wall: Stationary wall no-slip boundary condition
- Inlet:- Velocity inlet, Absolute Velocity magnitude calculated with respect to Renolds number
- Outlet:- Pressure outlet, Absolute Gauge pressure = 0 Pa
- symmetry:- Symmetry
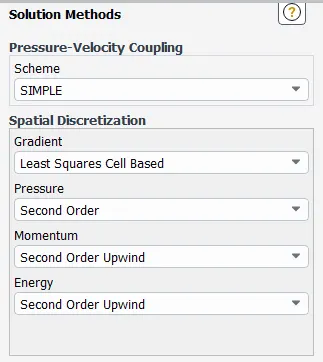
- Solution method:-
- Creating a Monitor point at length = 4*Dia = 8m of the cylinder from center of cylinder towards +ve side
Report Definitions:-
Surface report
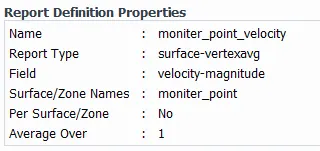
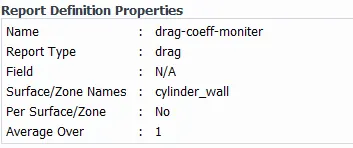
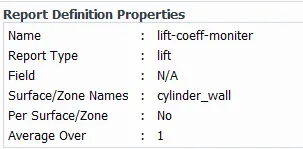
Drag & lift coefficient report:
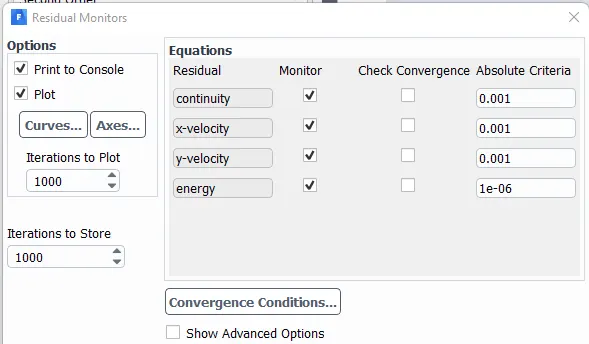
Residual monitor:-
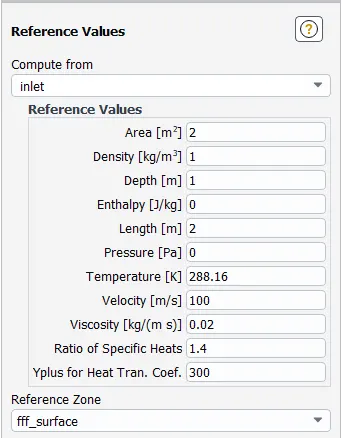
Reference values:-
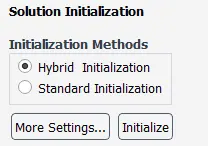
Hybrid Initialization :
Velocity and pressure contour for animations
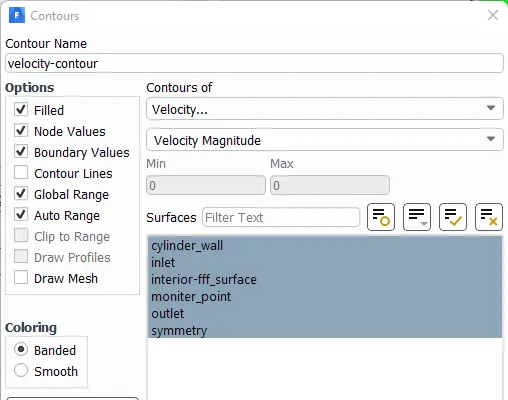
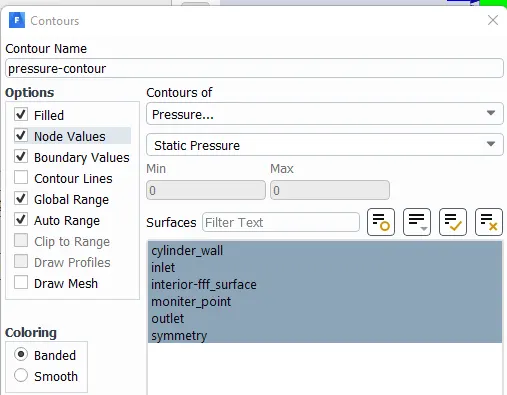
Solution:
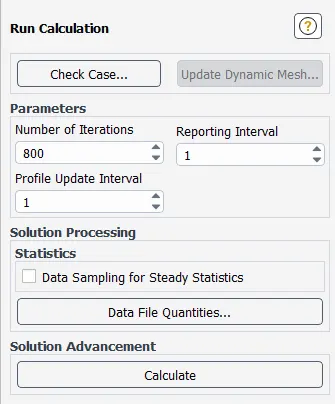
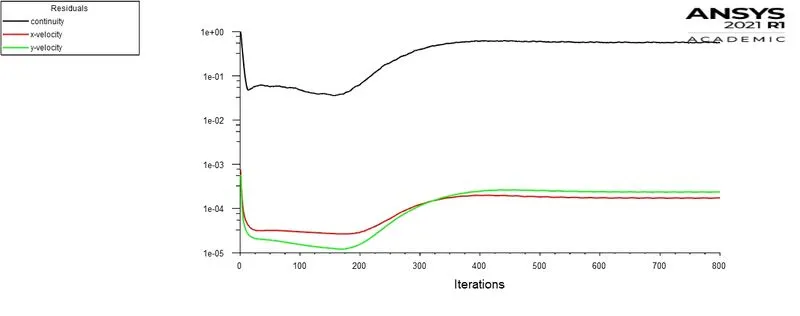
For steady-state Run for 800 iterations
For Transient time calculation
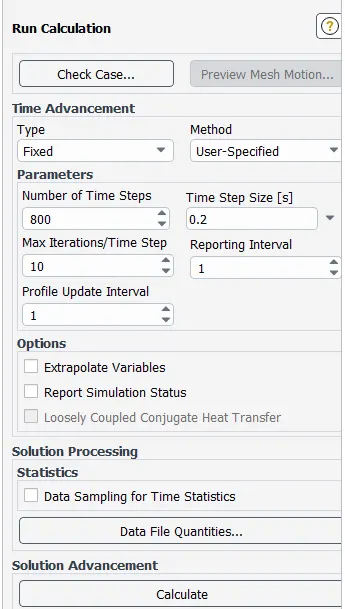
V= 1m/s, L = 60 m, Time step size = 0.2 sec.
`text(Time steps = ) L/(V*text(time step size)) = 60/(1*0.2)=300`
The number of time steps should be greater than or equal to 300 in this simulation we were given 800 timesteps with maximum iterations for time step = 10
Simulation time = 800*0.2 = 160 sec
Results:-
Create XY plane
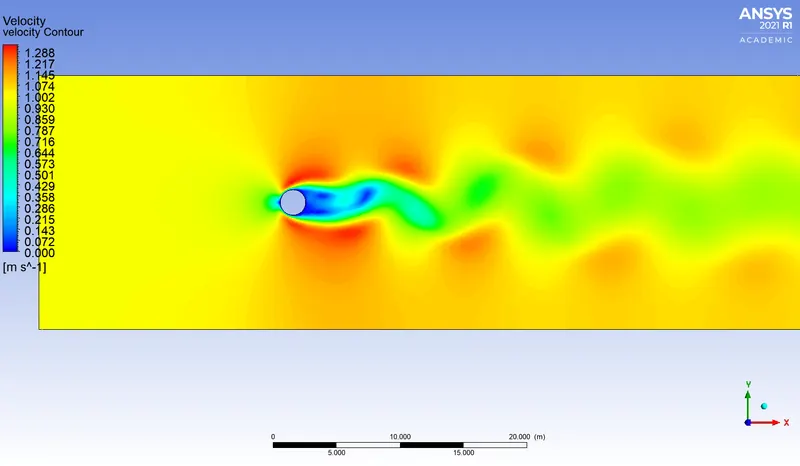
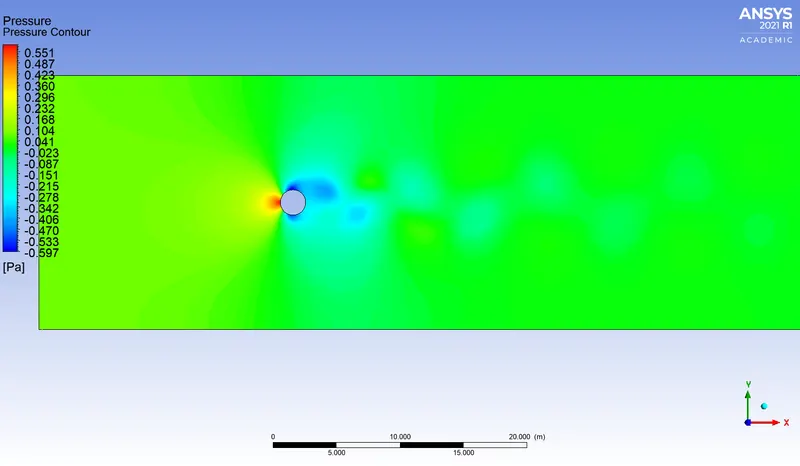
velocity contour, pressure contours, velocity streamline, velocity vector on XY Plane.
Velocity calculation:-
`V = (mu*R_e)/(rho*D) text( m/s)`
Diameter, D= 2 m
Density, `rho`= `1 text( )(kg)/m^3`
Dynamic Viscosity `mu`= 0.02 `(kg)/(m-s)`
Re = int(input('Renolds num : '))  # Renoulds number
D  = 2 # Diameter m
Rho = 1 # density Kg/m3
D_v = 0.02  # Dynamic viscosity kg/ms

V = (D_v*Re)/(Rho*D)

print('velocity = ',V, 'm/s')| Renoulds number | Velocity m/s |
| 10 | 0.1 |
| 100 | 1 |
| 1000 | 10 |
| 10000 | 100 |
| 100000 | 1000 |
Steady State simulations:
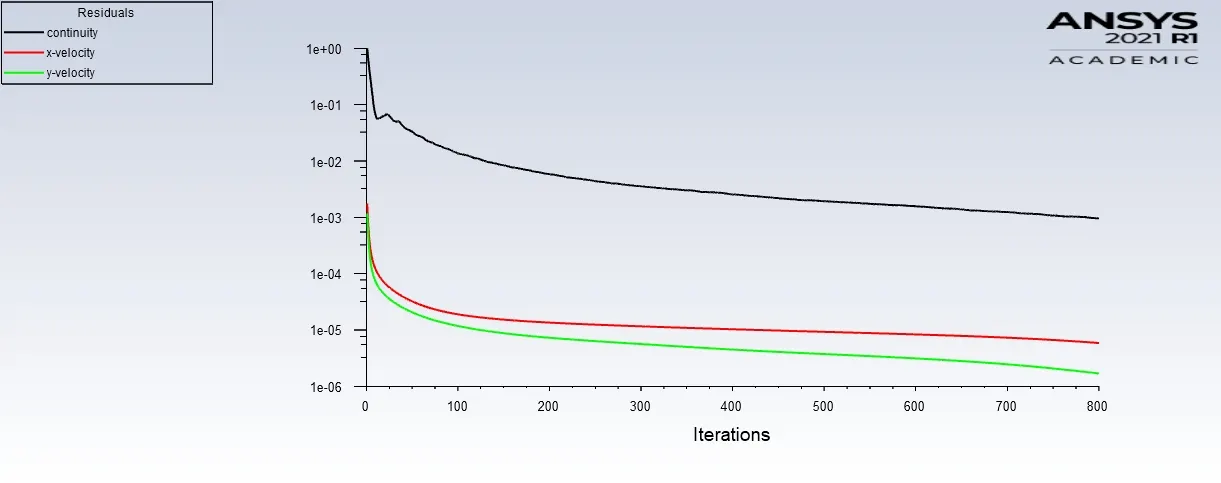
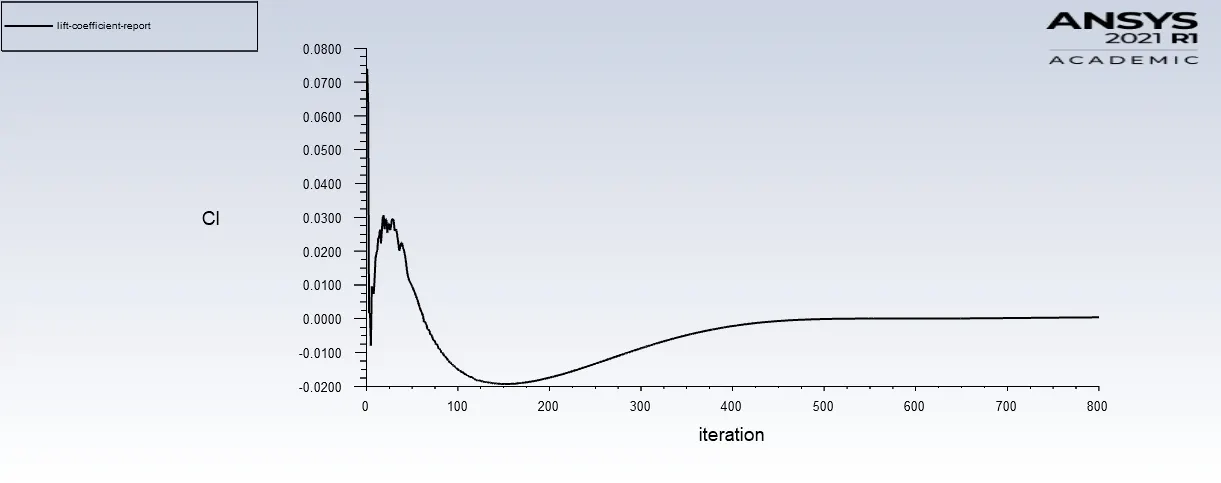
| 1) | Reynolds number = 10 | Velocity = 0.1 m/s |
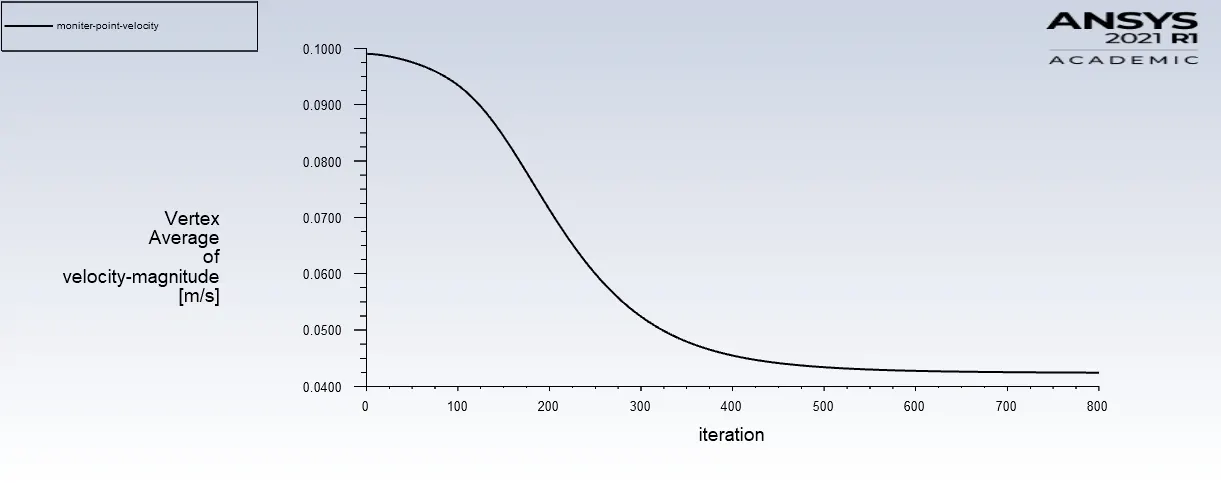
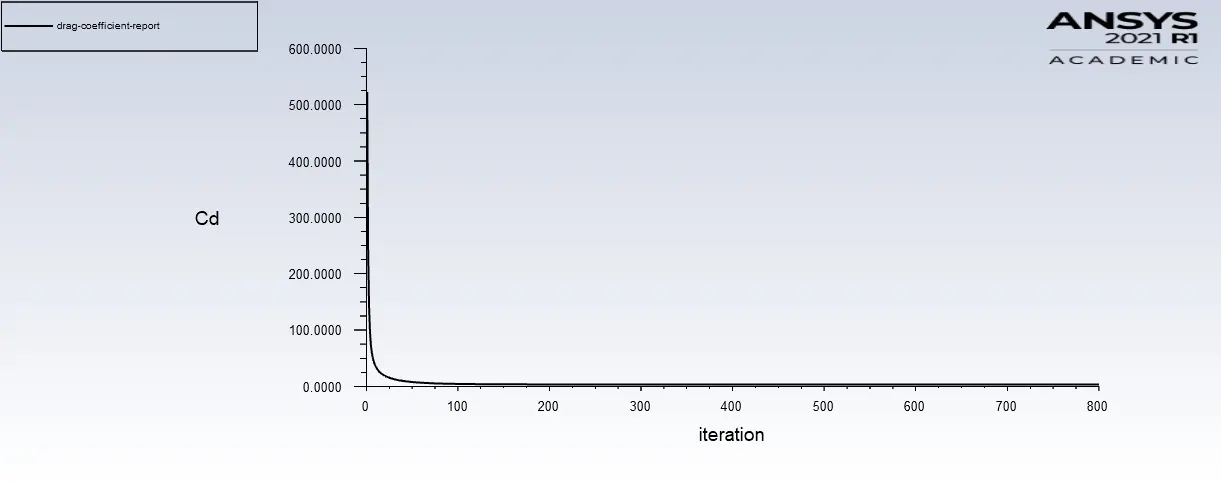
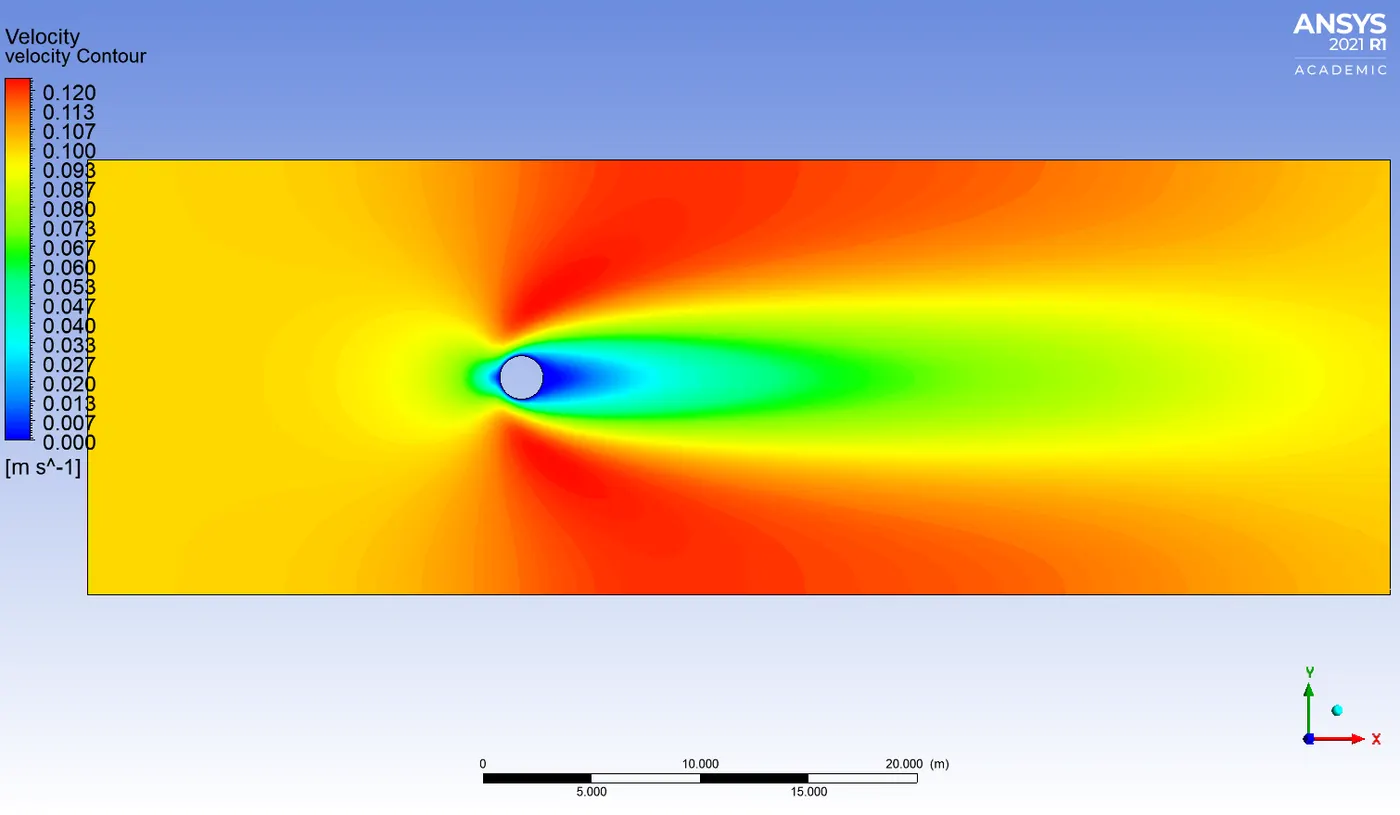
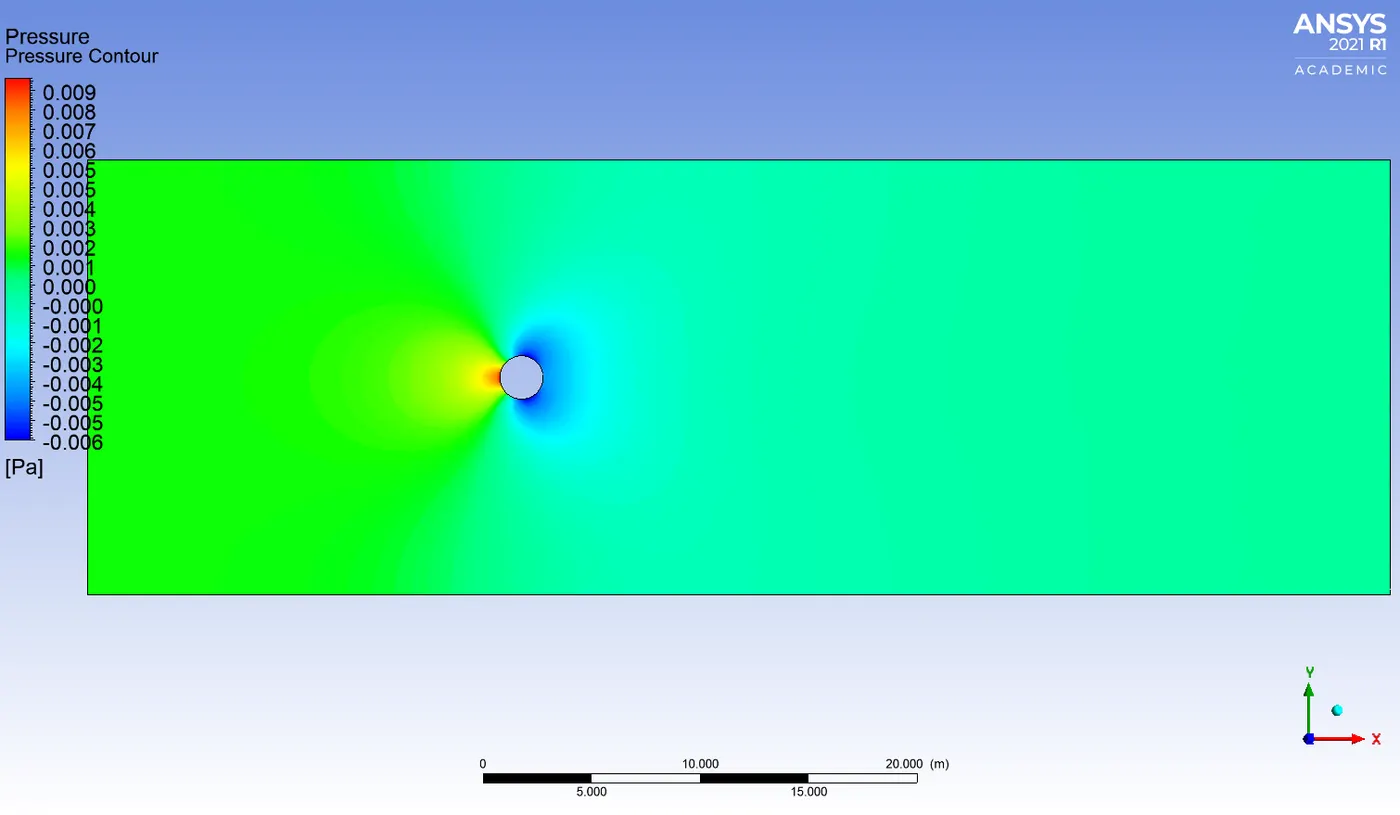
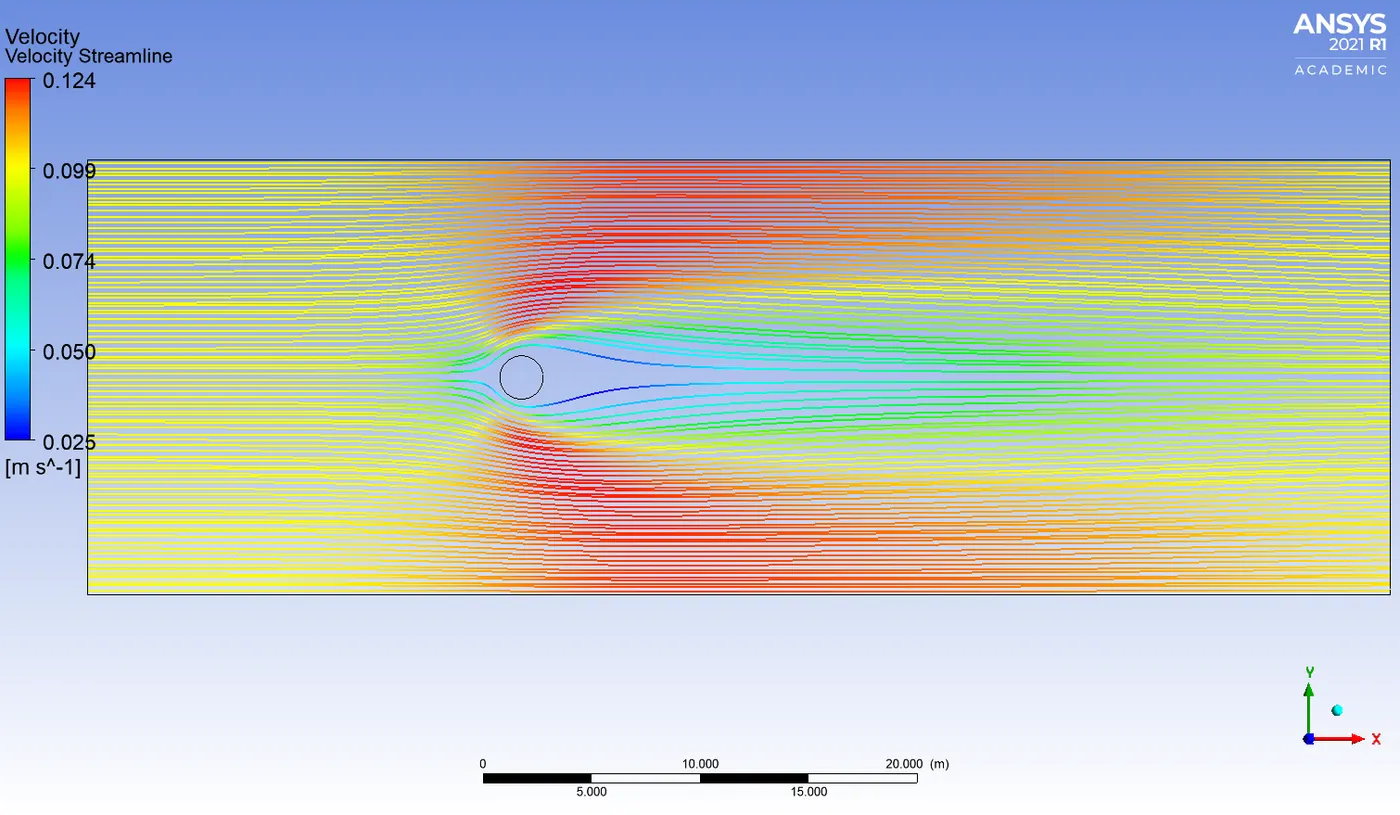
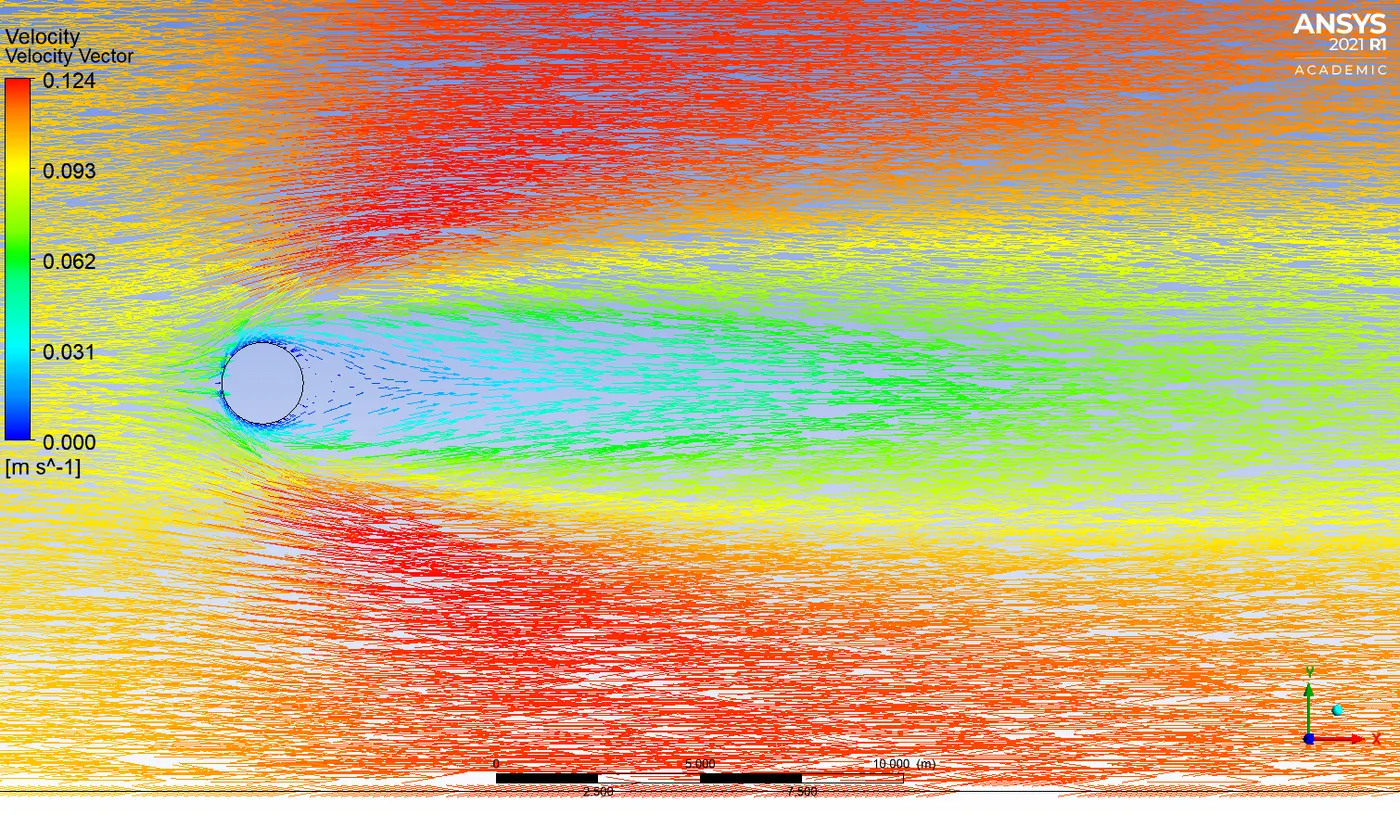
velocity animation: https://drive.google.com/file/d/1LJbwu2kXqtXa71gycsMB7m5UAMq0_t2k/view?usp=sharing
pressure animation: https://drive.google.com/file/d/1kKcpdpNRgG7-NsnHMJITdBGXqIcNMR9J/view?usp=sharing
| 2) | Reynolds number = 100 | Velocity = 1 m/s |
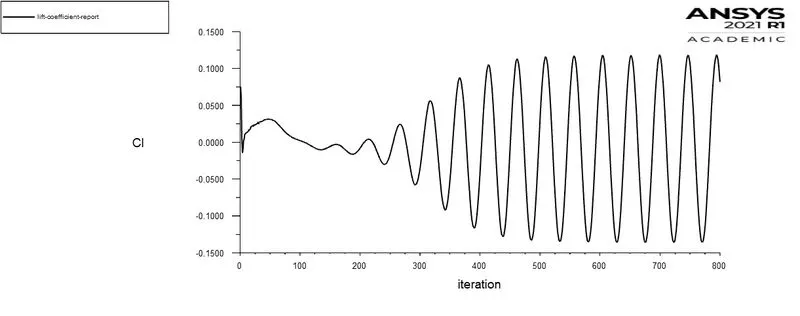
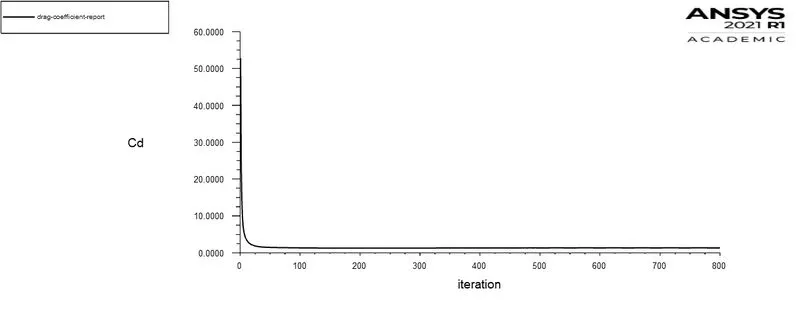
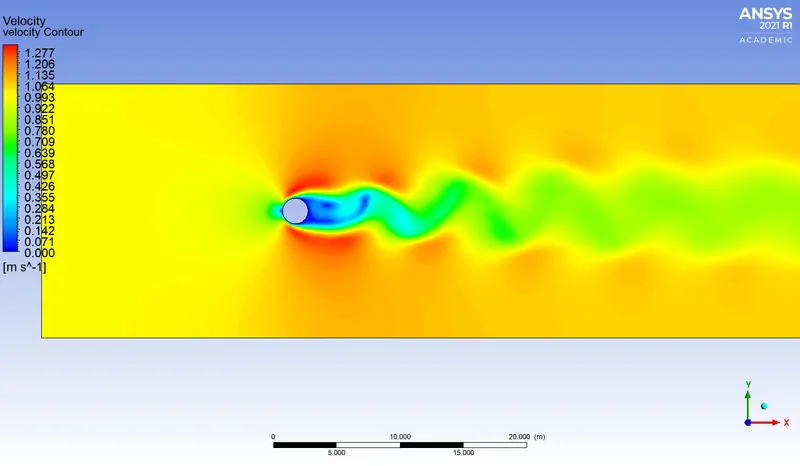
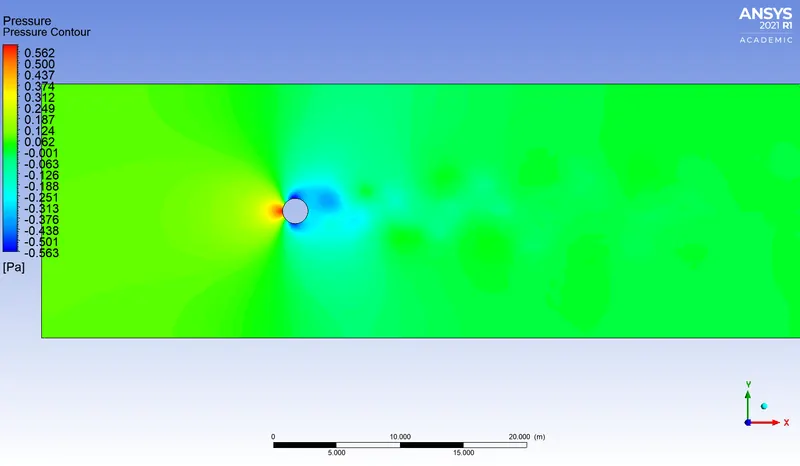
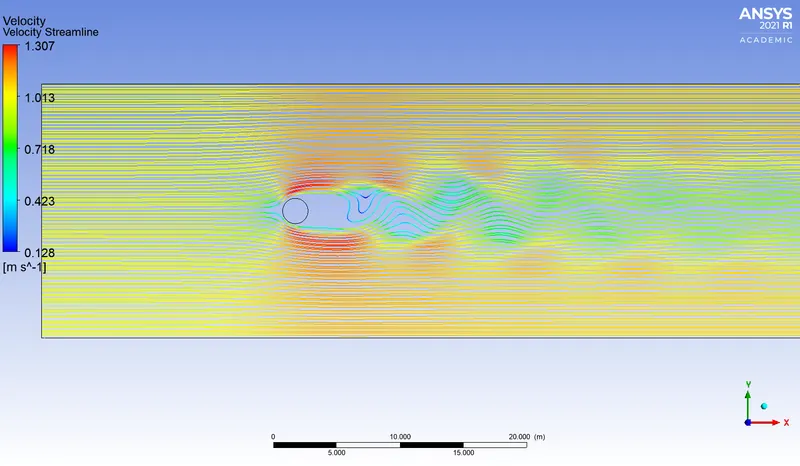
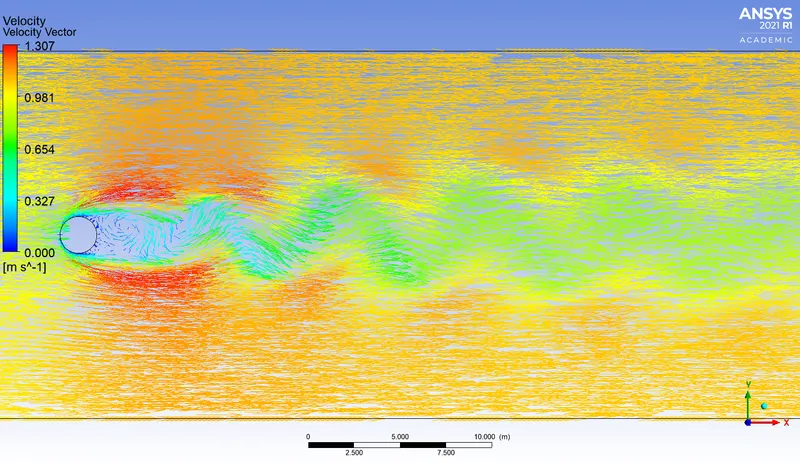
velocity animation: https://drive.google.com/file/d/1YFr76H9V7ctt8MX5S5zAQRR0MpgOqgcN/view?usp=sharing
pressure animation: https://drive.google.com/file/d/1Mx2Y5X4qmcDZ8obpr5x-lWyPdgs_FC0I/view?usp=sharing
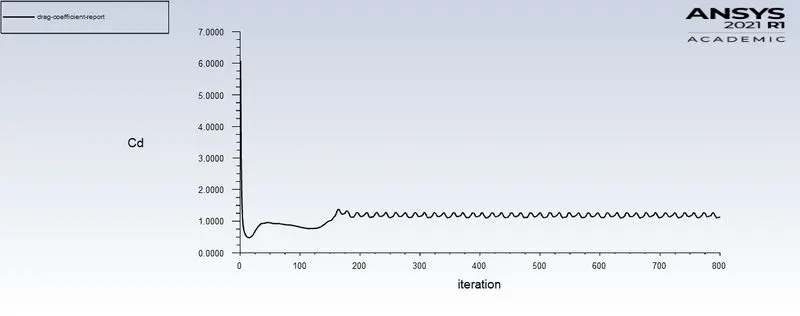
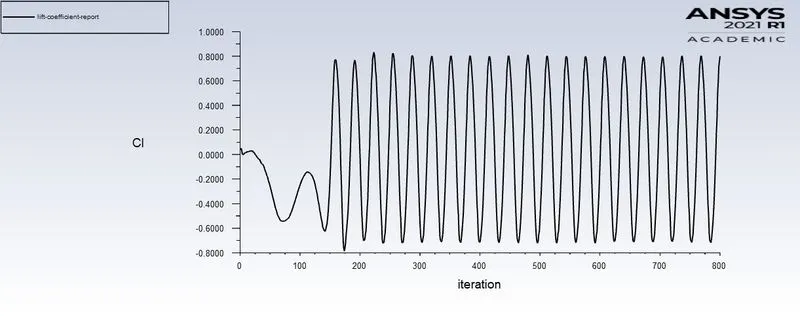
| 3) | Reynolds number = 1000 | Velocity = 10 m/s |
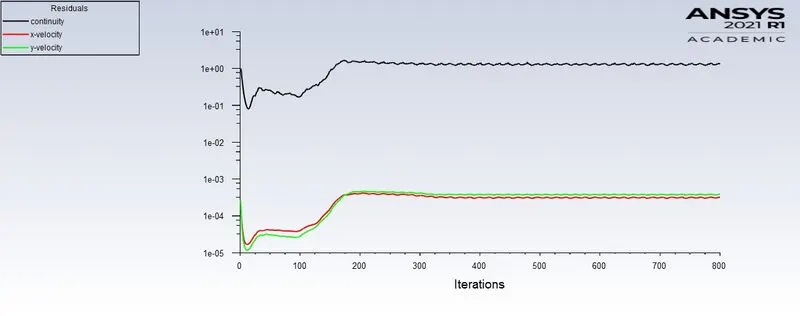
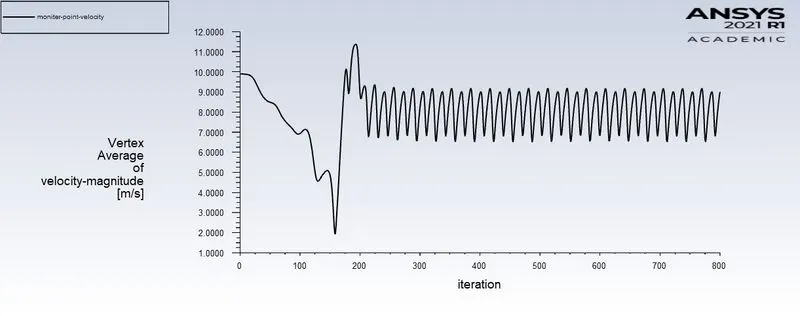
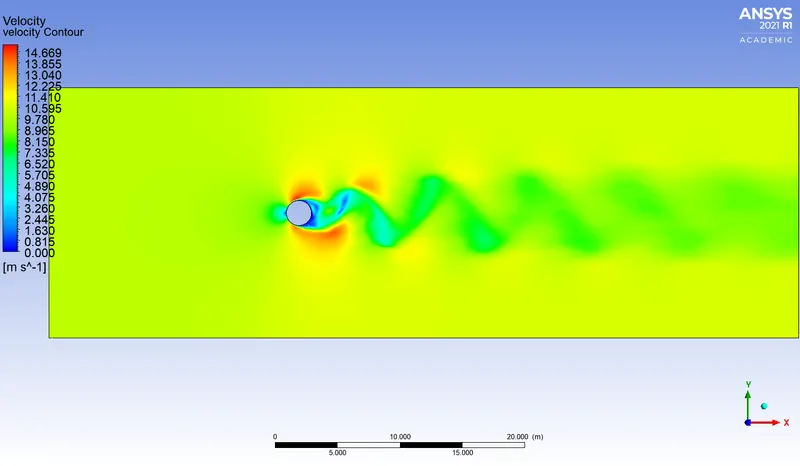
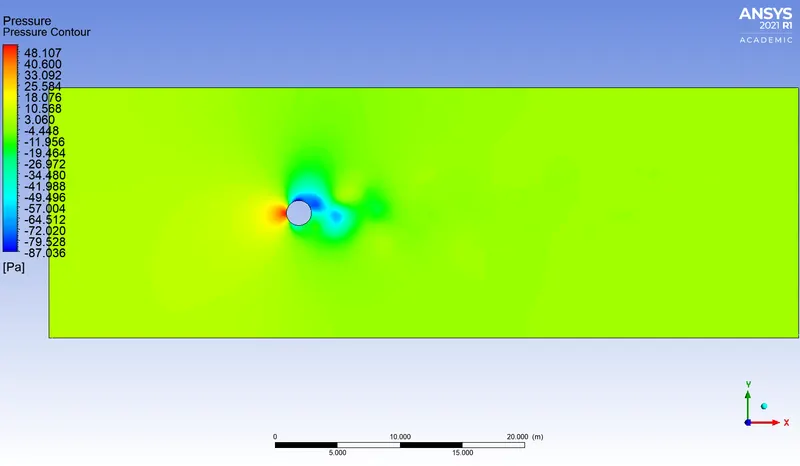
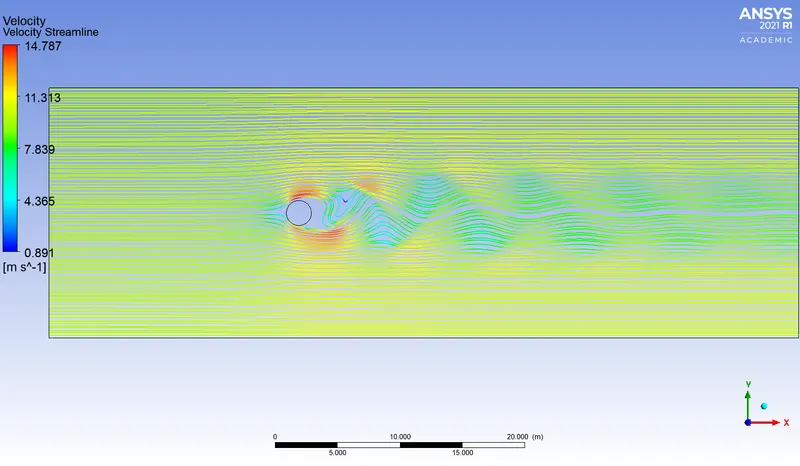
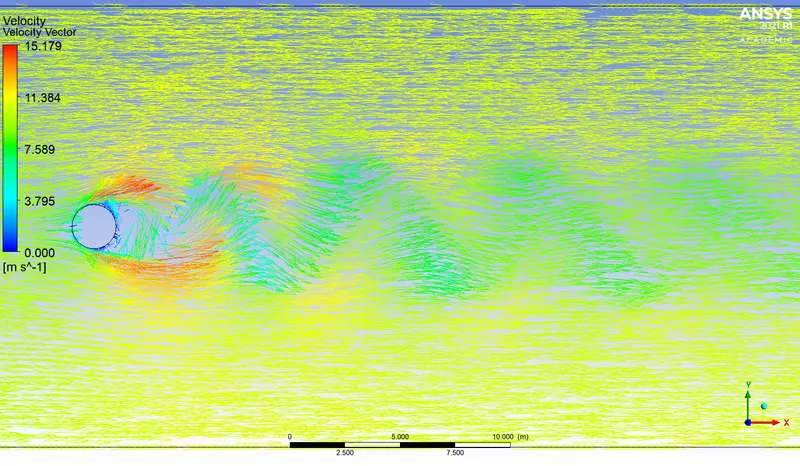
velocity animation: https://drive.google.com/file/d/1DX_KHYSoPDmlCcmCy8tRpu1cDqxswMpO/view?usp=sharing
pressure animation: https://drive.google.com/file/d/1uaJg3JhecpdyiHcBgnAl-nmNG7i78frS/view?usp=sharing
| 4) | Reynolds number = 10000 | Velocity = 100 m/s |
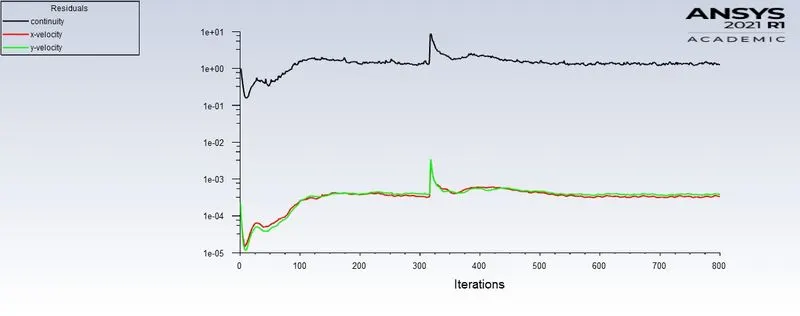
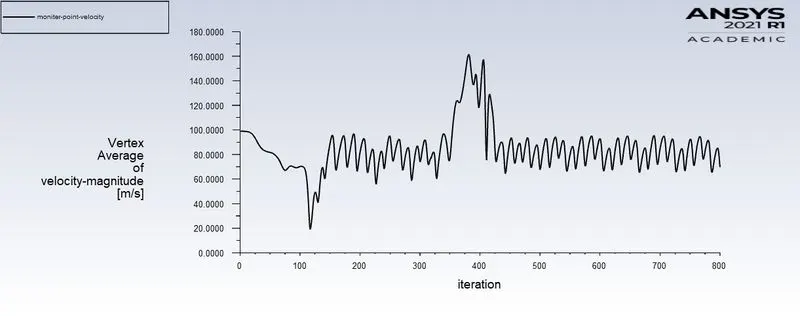
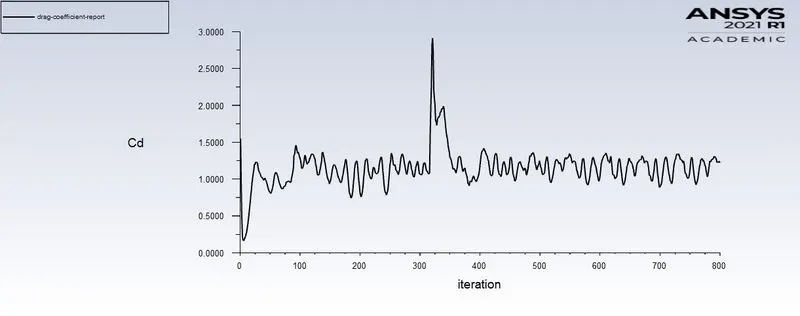
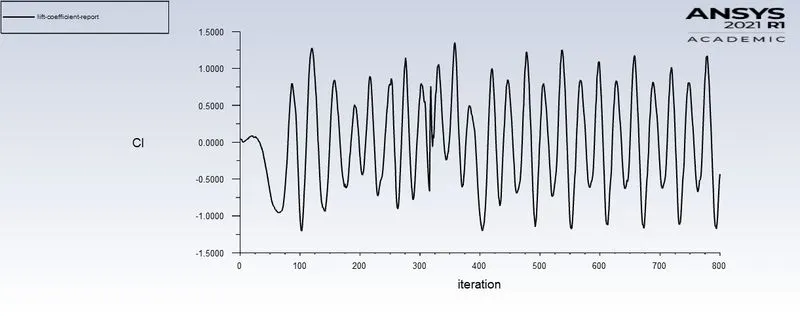
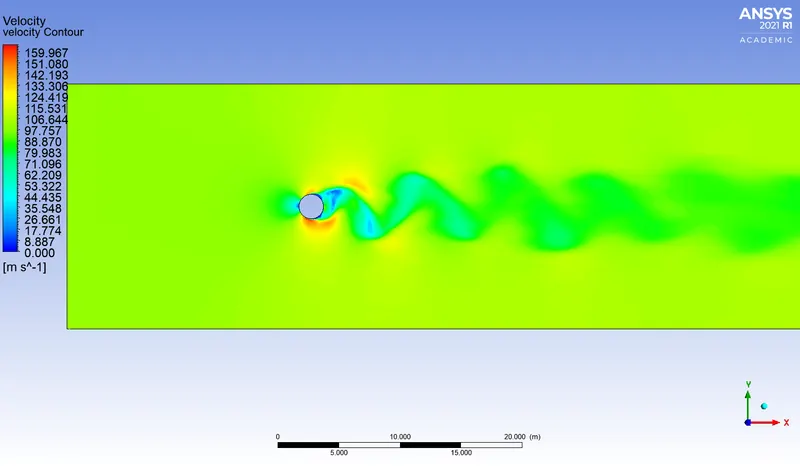
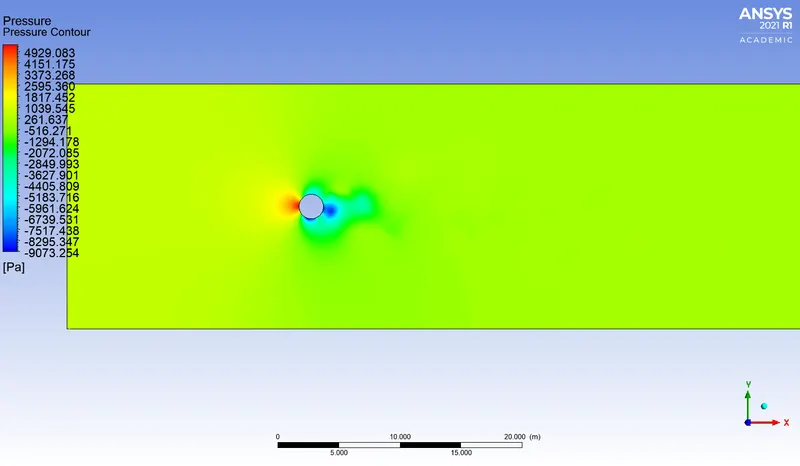
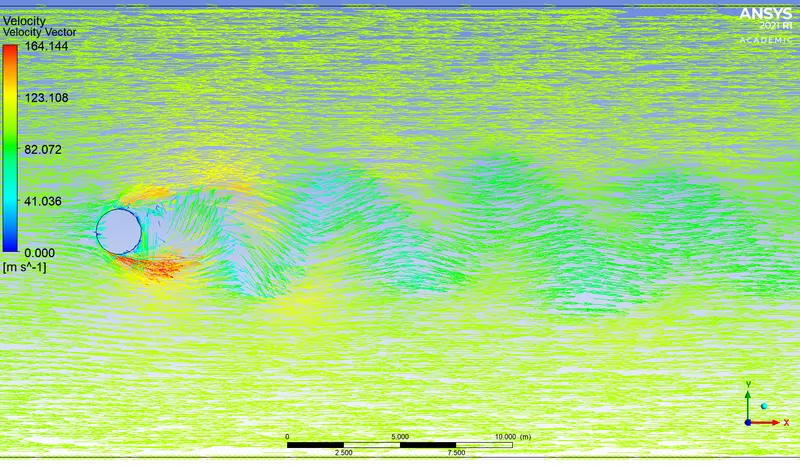
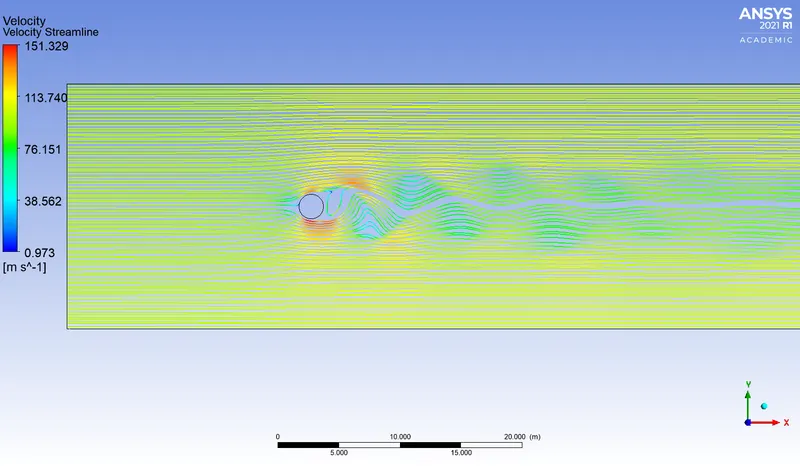
velocity animation: https://drive.google.com/file/d/1OdQYwIY6crCfsR5GBcsd1RDDmxVeOwlj/view?usp=sharing
pressure animation: https://drive.google.com/file/d/1xFHcKhY7e5BKiiPkn1S7hLVYJLObiiip/view?usp=sharing
| 5) | Reynolds number = 100000 | Velocity = 1000 m/s |
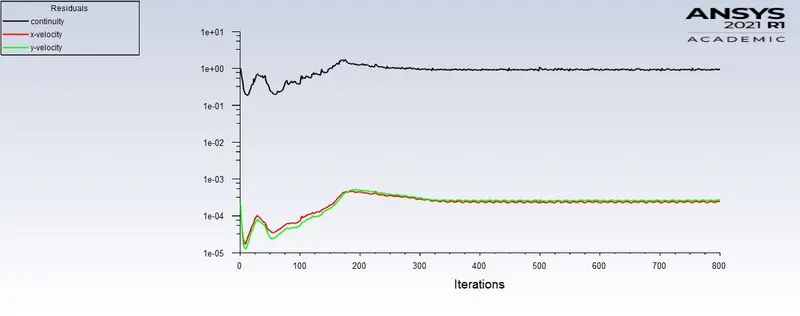
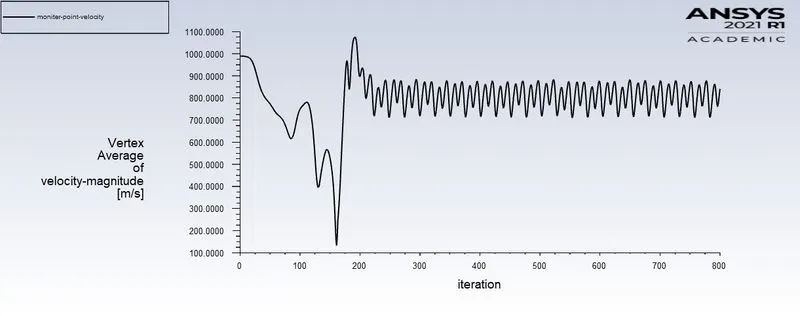
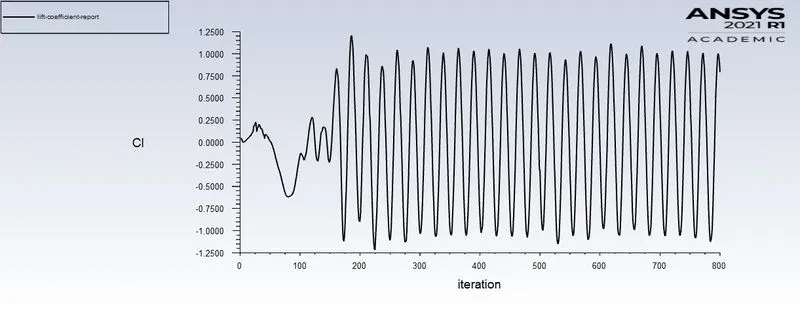
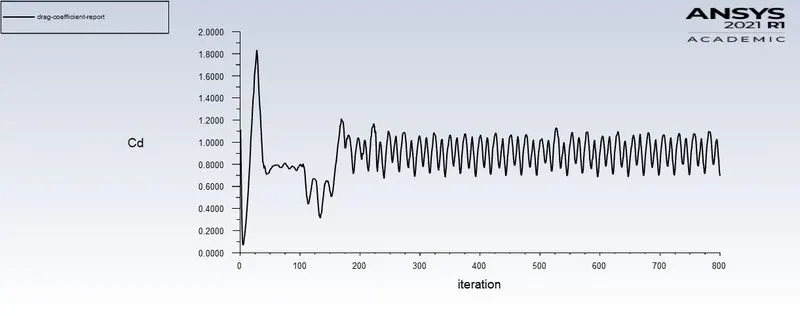
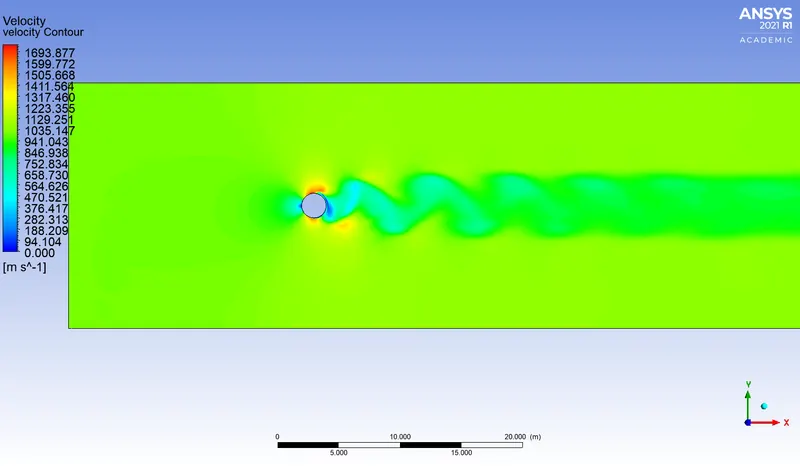
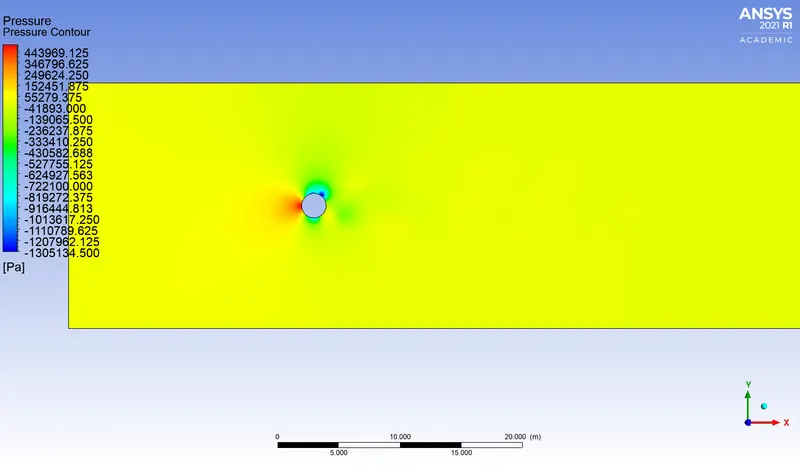
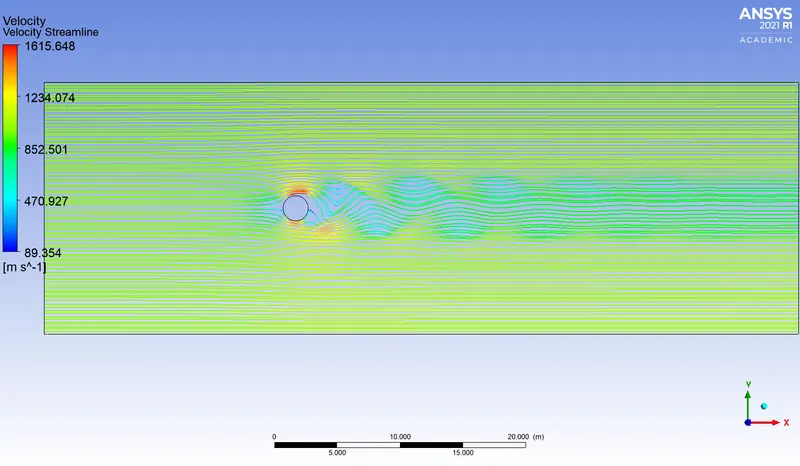
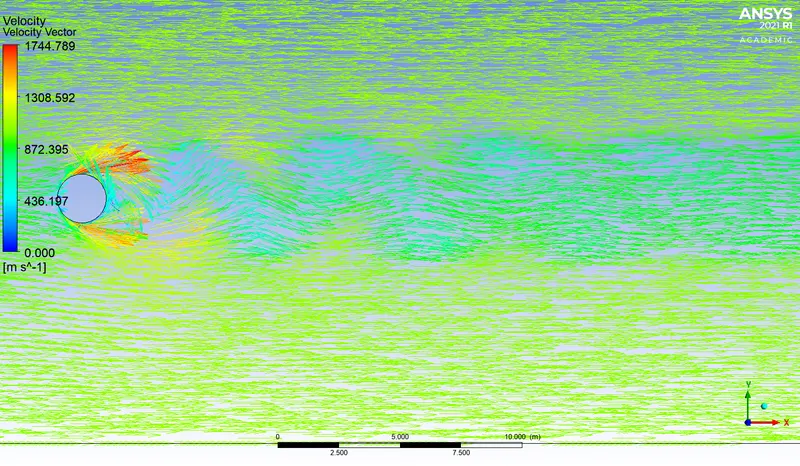
velocity animation: https://drive.google.com/file/d/1fhS5RwFlF8WiMuXGLmiVSmLG2bqKnuy8/view?usp=sharing
pressure animation: https://drive.google.com/file/d/1hb58zlu_4Z_2_VK-G-fRBWj0f8qMARJF/view?usp=sharing
Transient State simulations:
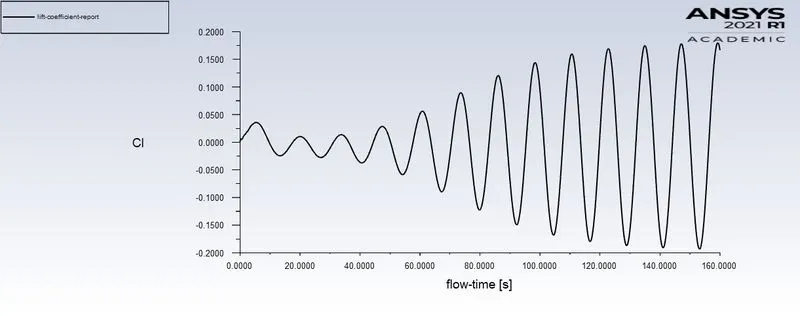
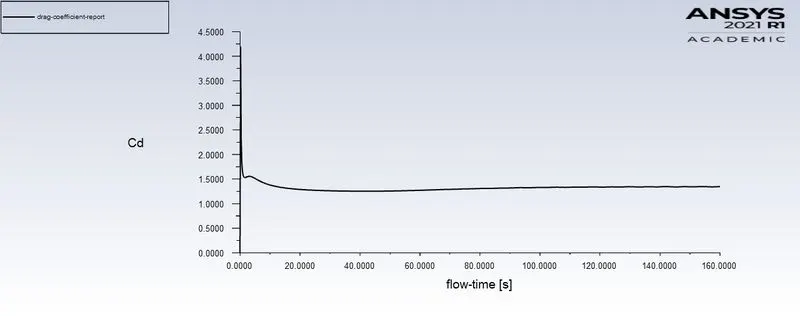
| 1) | Reynolds number = 100 | Velocity = 1 m/s | Simulation time = 100 sex with step size =0.1sec |
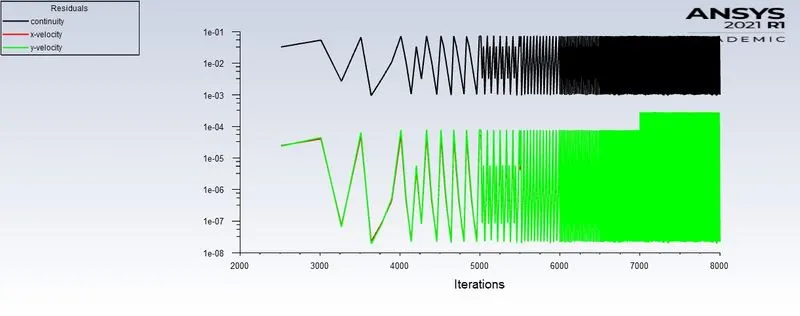
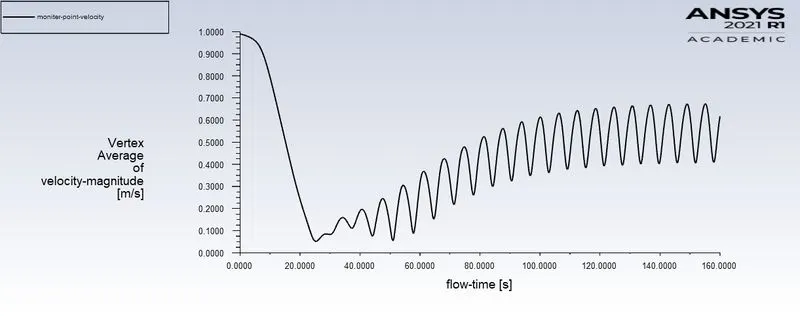
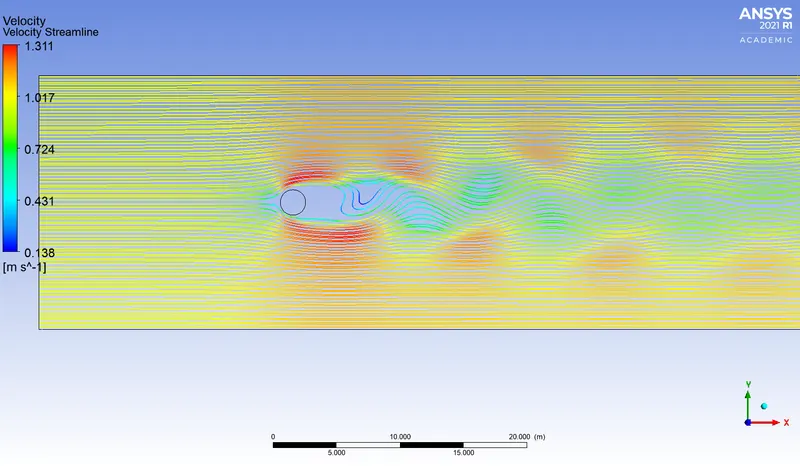
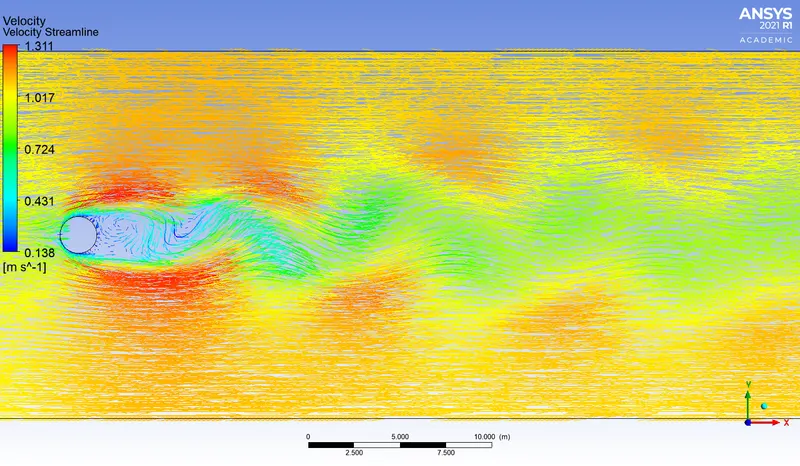
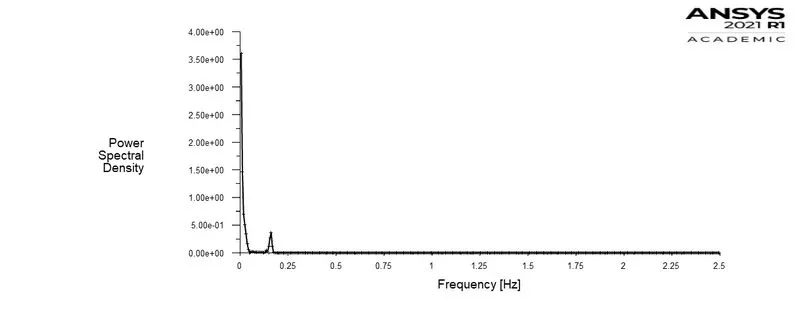
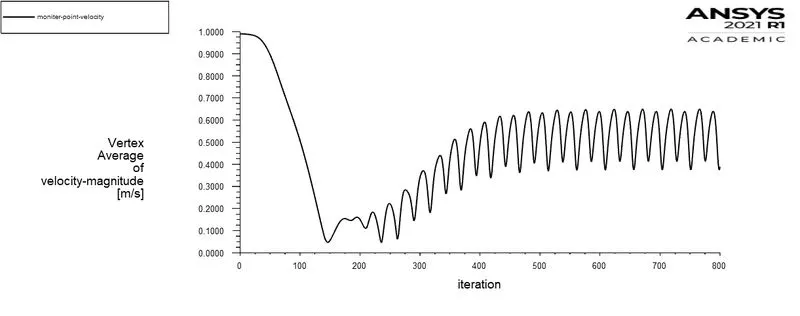
strouhal number:
f = number of cycles/time = `1/(160-154)` = 0.166
strouhal number = `(f*L)/v` = `(0.166X2)/1`= 0.332
velocity animation: https://drive.google.com/file/d/1Pksq4a7ybgQaP9OknoOvHf8kHexL4C6o/view?usp=sharing
pressure animation: https://drive.google.com/file/d/19BWSjmQhfjgXJ5QXJEzOMqPaWZFWkn6l/view?usp=sharing
Results:-
Lift and Drag coefficient
| Steady State simulation | |||
| Reynolds number | Velocity m/s | Drag coefficient | Lift coefficient |
| 10 | 0.1 | 3.3259 | 0.000427 |
| 100 | 1 | 1.3365 | 0.1355 |
| 1000 | 10 | 1.2787 | 0.79 |
| 10000 | 100 | 1.10 | 1.176 |
| 100000 | 1000 | 1.095 | 1.126 |
| Transient simulation | |||
| 100 | 1 | 1.34 | 0.19 |
Conclusions:-
- As the reynolds number increases Drag coefficient Decreases and lift coefficient increases.
- Transient state capture more accurate vortex sheding than steady state solving.