(ANSYS_P4) Railwheel and Track
OBJECTIVE: Performing a static analysis on railwheel and track analysis
MODEL
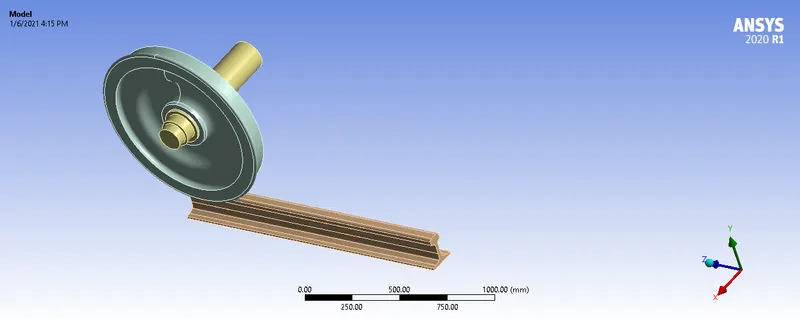
ANALYSIS
Case 1: Multiply the bearing load by 5 times and compare the results with the load of 100000 N (As done in week 2 video). Compare the Total Deformation, Equivalent stress and the life under both the loads
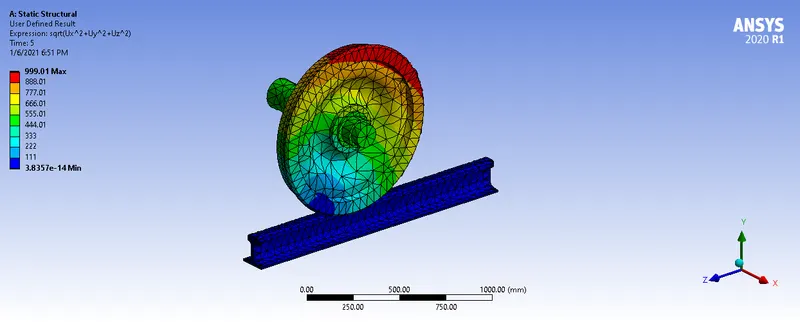
Case 2: Implement a User defined result and calculate the Total Deformation from this result and check if it is the same as that obtained by the inbuilt result by ANSYS for a load of 100000 N.
MATERIALS
- Structural Steel
CONTACTS
Frictional contacts is defined to specify the parts which are going to make contacts during the simulation and these are specified for wheel and track and frictionless contact between shaft and hub(bearing)
Augumented Lagrange is selected to increase the stiffness of the gears and interface treatment of adjust to touch is selected.
JOINTS
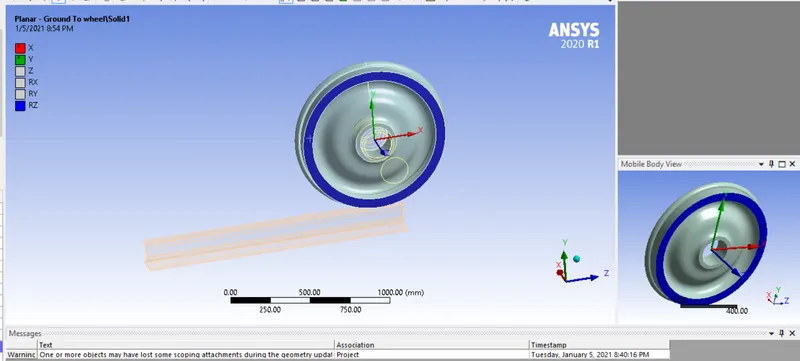
The first joint made was to the wheel and track with a body to ground fixed joint.
The second was a translational joint with direction in the X axis for the shaft and a fixed planar joint to keep the wheel in the X-Y plane.
MESHING
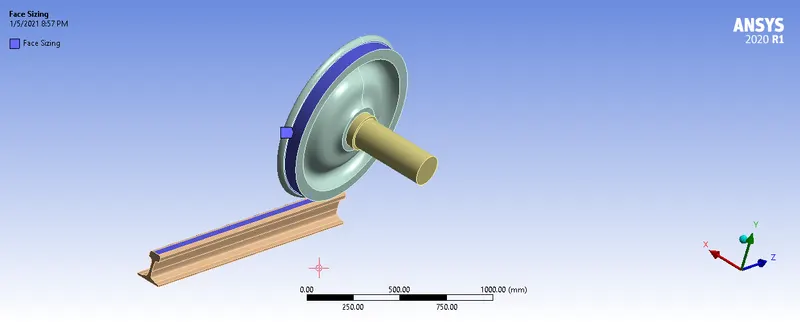
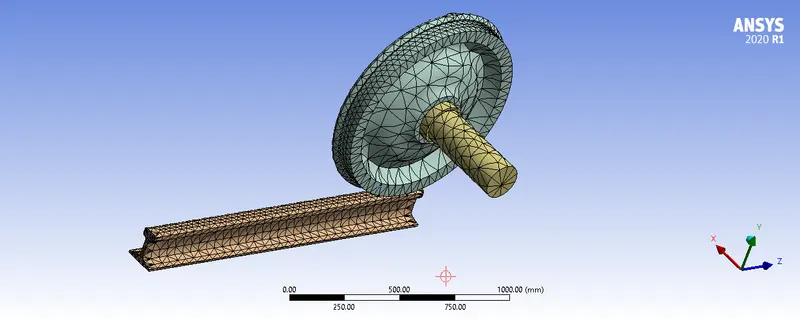
Tetra elements of 50mm size is used first for the meshing of the system and a sizing of 30mm for area which are in contact.
ANALYTICAL SETTINGS
Using a multi time of 5 steps, the first step is defined by setting all output parameters to YES. And large deflection is turned on.
Multi step definition for 2-5 where maximum time step of 0.1s and minimum of 0.001.
JOINT LOAD
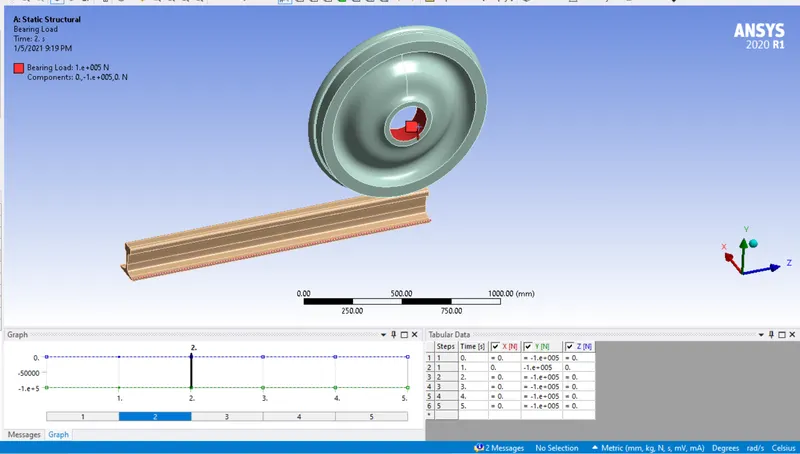
A bearing load is defined for the hub and a joint displacement of 100mm steps to 500 is defined on the shaft.
The solution output of equivalent stress , strain and fatigue life.
RESULTS
CASE _1
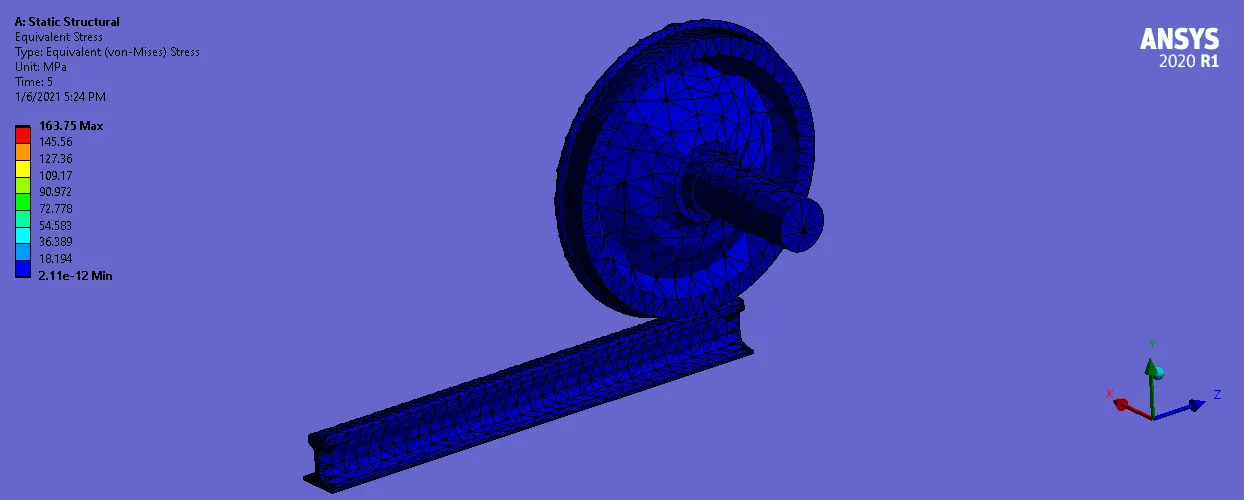
Bearing = 100000N
Stress
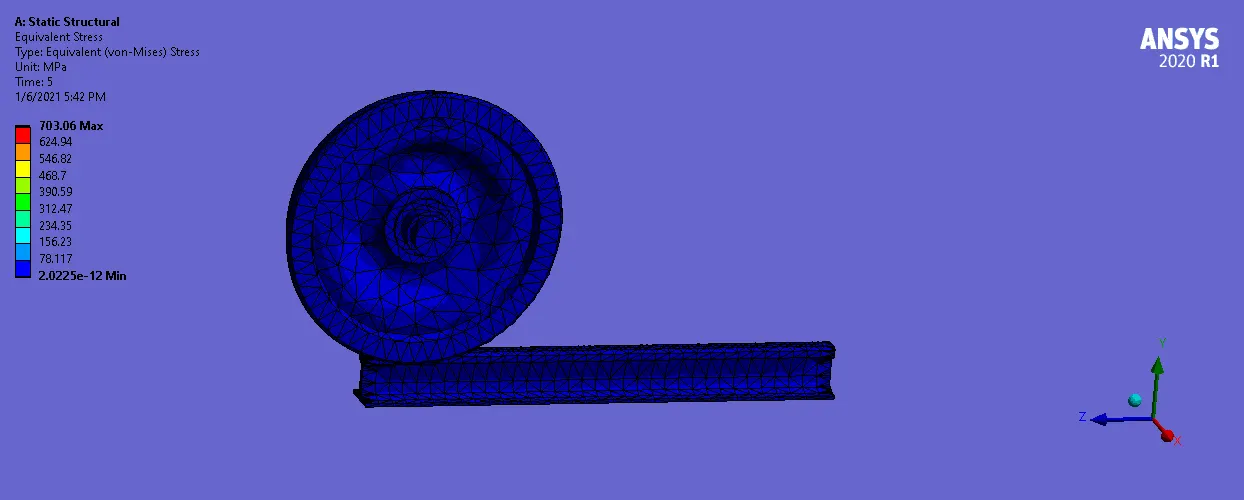
Bearing = 500000N
Stress
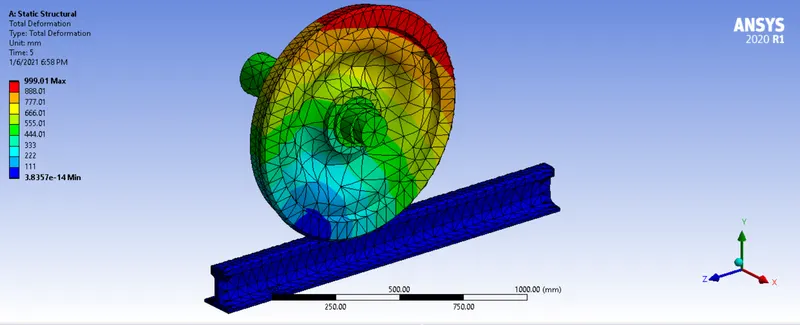
Deformation
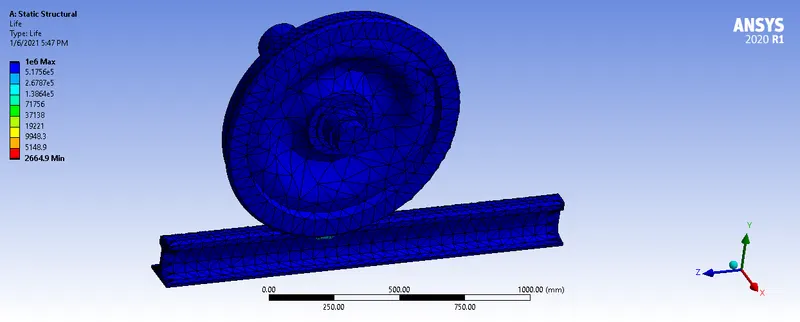
Fatigue life
| Case | Bearing | Maximum deformation(mm) |
Maximum Stress (Mpa) |
Fatigue Life (Max/Min) |
| 1 | 100000 | 999 | 89 | 1e6/8e5 |
| 2 | 500000 | 999 | 402 | 1e6/2.6e3 |
The deformation remained the same but it can be seen that due to the increase bearing load the was greater stress developed.
The fatigue life decreased a lot in the second case to a minimum of 2.6e3 cycles. This is way lesser than case one which is evidence of early failure.
SOLUTION 2
A user defined function is implemented for displacement and then its compared to the simulation results.
Using the formula sqrt(Ux^2+Uy^2+Uz)
UX , UY , UZ are the deformation in x , y, z respectively
RESULTS= 999mm
CONCLUSION
This simulation was successful as the ussage of user defined function was tested and applied. Also a sample train wheel and track was simulates succesfully to show the effect of varying bearing load on stress and fatigue.
Upload was unsuccessful so link to the document is provided below
https://drive.google.com/file/d/1Iod4_7MfjEoAa10NMFpMFiAwaZMowfmh/view?usp=sharing
https://drive.google.com/file/d/1Z1639XB9Y3GZPOG2ISFdWWvQLcrlY066/view?usp=sharing