Hyperelastic Material Models
LS DYNA – Material_Modelling_Hyperelastic
By Enos Leslie
Mechanical Engineer
8th April 2023
AIM
Model a hyperelastic material by comparing data to stress/strain experimental curve data. The rubber models from Ls Dyna Deck considered are:
- Mooney Rivlin Constant (MAT_077, N = 1)
- Ogden Rubber Constants (MAT_077, N = 2)
OBJECTIVE
- Extract experimental engineering stress/strain rubber data.
- Convert data into unit format kg/mm/ms.
- Import data curve is solver deck.
- Simulate a tensile test on dogbone specimen.
- Validate and compare results with experimental data.
PROCEDURE
- Place the data in an Excel sheet and plot the curve. (Stress in Mpa)
- Verify that the data is clean without any noise.
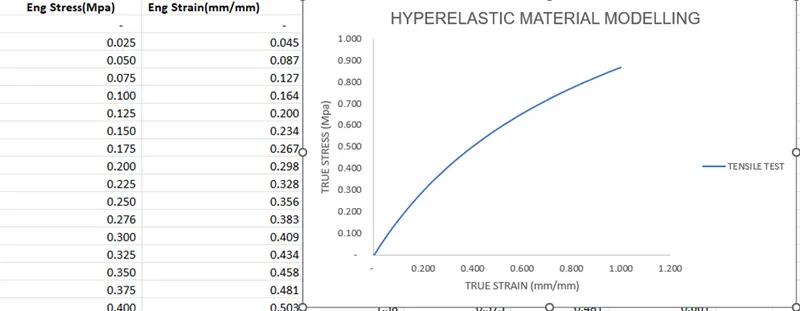
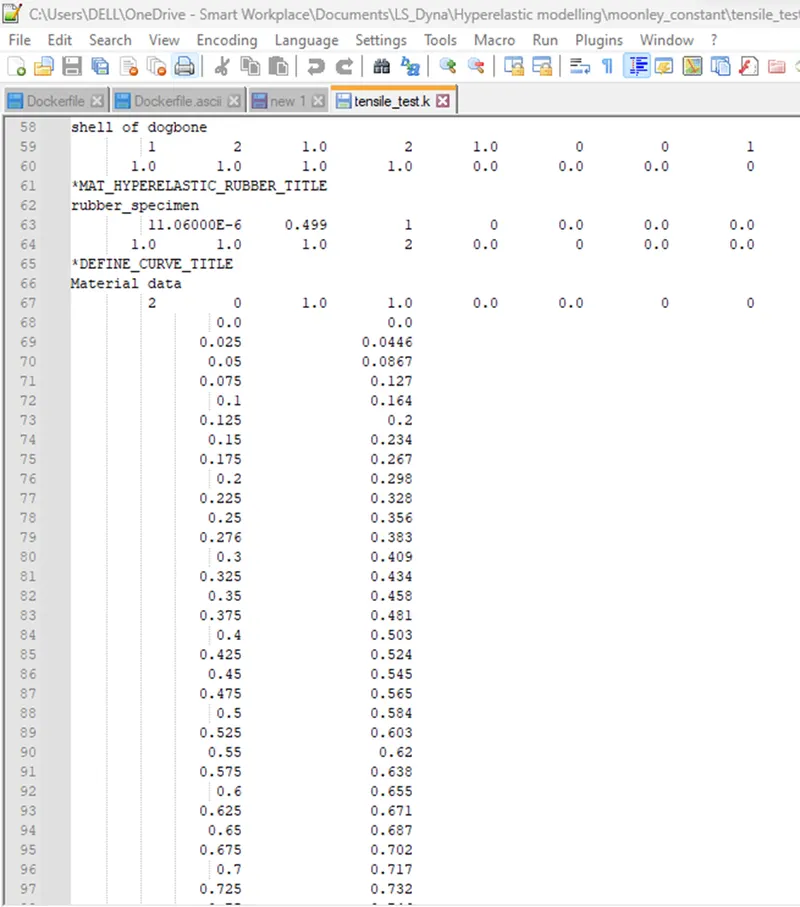
- Open the dogbone specimen in Ls Dyna decker and copy the material stress/strain in a newly created material model (No : 077) Hyperelastic rubber:
- Density: 1.06E-06 kg/mm
- Poisson ratio: 0.499
- Number of constant Eqn =1 (Mooney Rivlin)
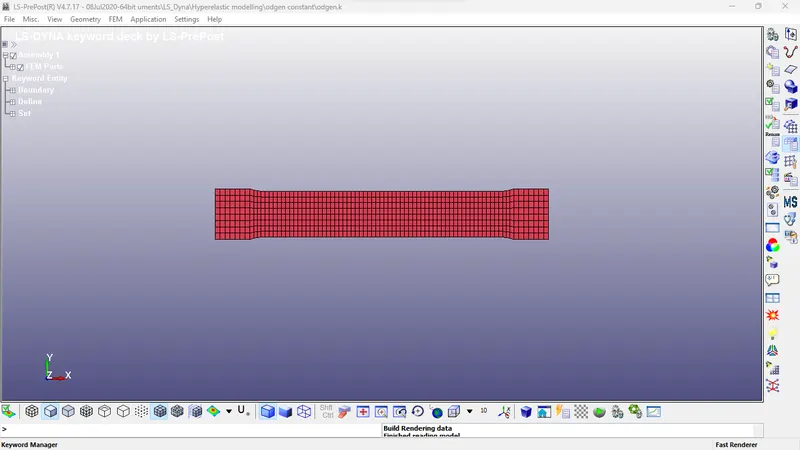
IMPORT
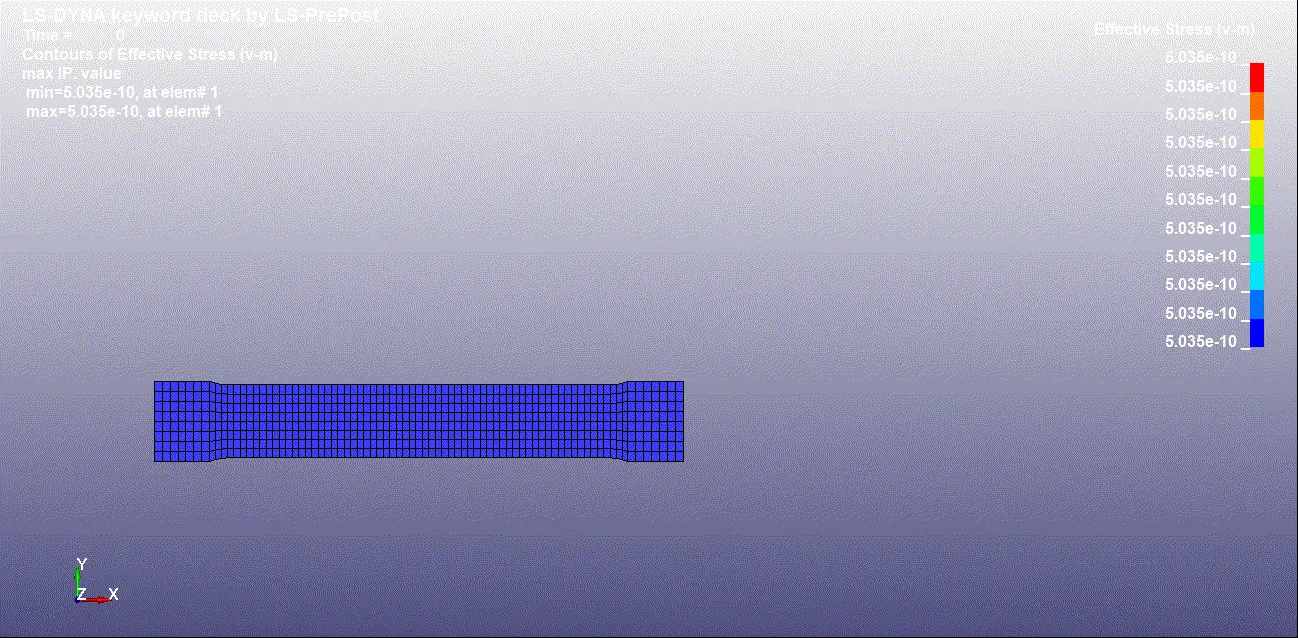
A 2d dogbone specimen is imported into Ls-Prepost to be used for the simulation and creation of the material model.
MATERIAL
Firstly, a material card is created. Hyperelastic rubber MAT 077 is used for the phone with unit system of (kg/mm/ms).
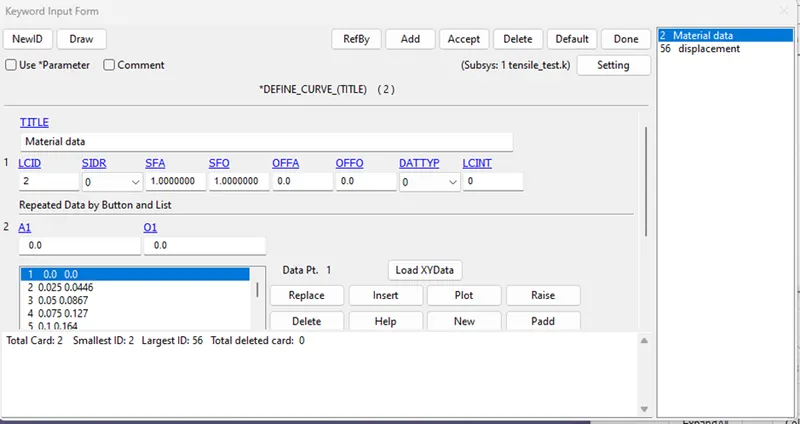
CURVE INPUT
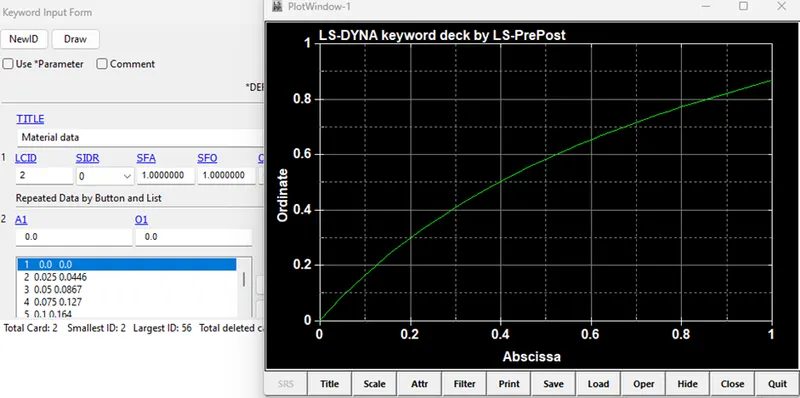
The engineering strain and stress data points are incorporated into the material card by using *Define_Curve.
SECTION
The model is a 2D material, and a thickness of 1mm is specified for the dogbone specimen.
Fully integrated shell element formulation "16" is selected.
BOUNDARY CONDITION
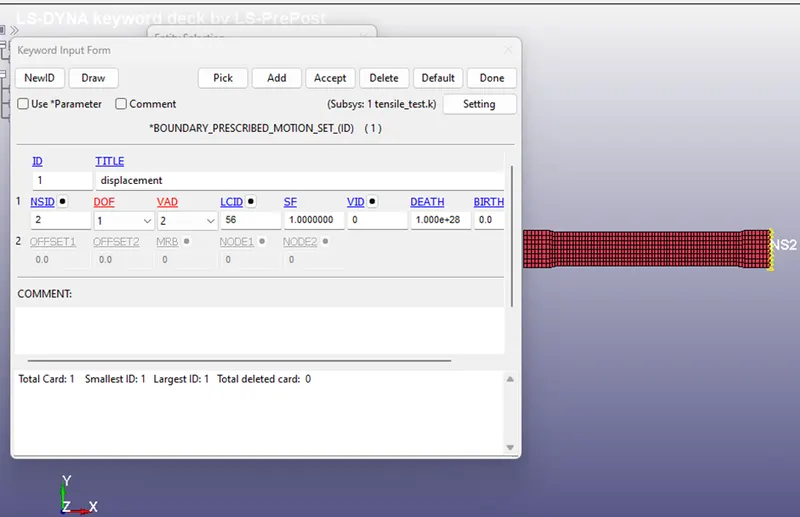
PRESCRIBED MOTION SET is made to define the displacement boundary in the - X direction., a prescribed motion displacement of the rigid body is selected (0 to 1)mm, A load curve is defined below:
Right end side of the specimen nodes is selected for the application of X-axis displacement.
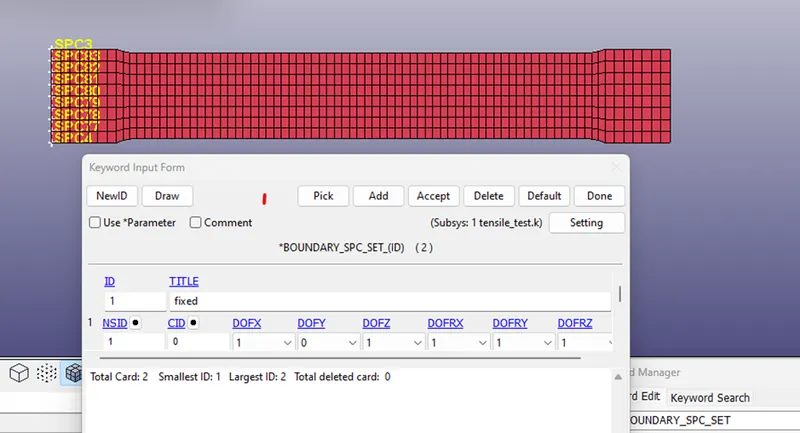
The nodes on the far left side of the dogbone are fixed in all DOF (Degree of freedom) except for vertical Y.
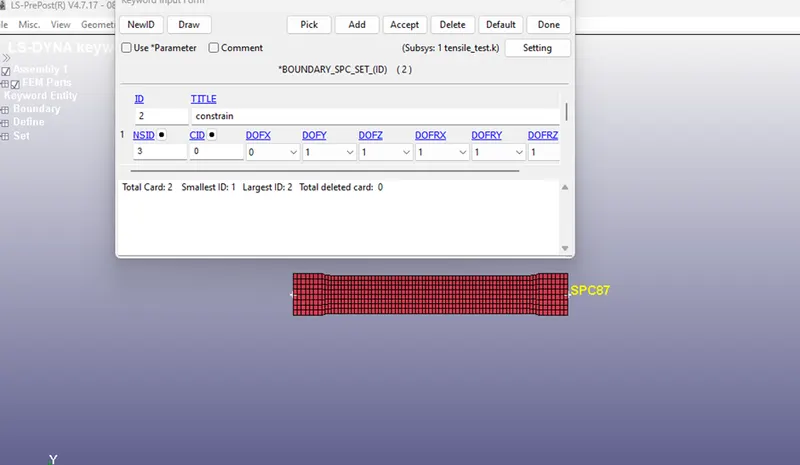
Two midpoint nodes are selected to constrict the specimen in a fixed position on the Y-axis.
CONTROL CARDS
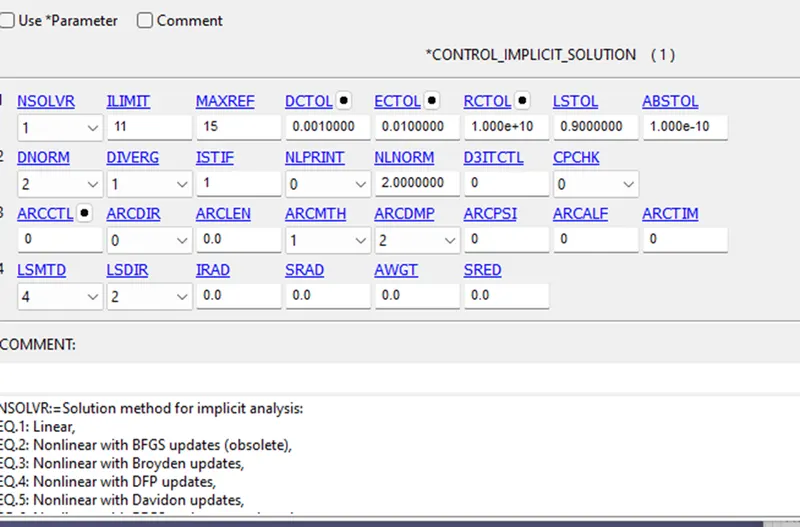
Control_Implicit_Solution
A linear solution is selected as can be seen in the picture below:
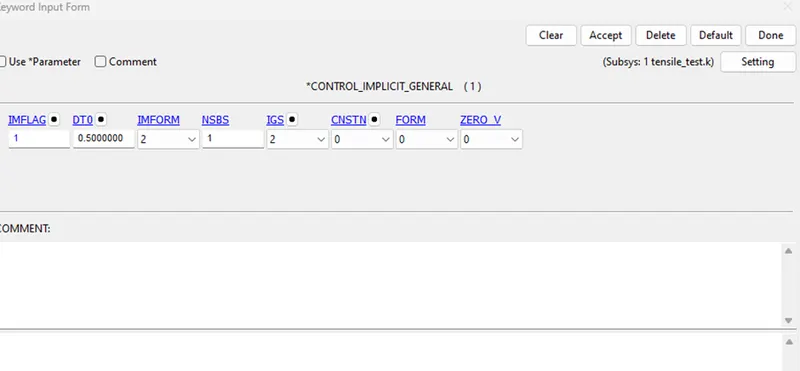
Control_Implicit_General
This card activates and controls the analysis. The parameters specified is seen below
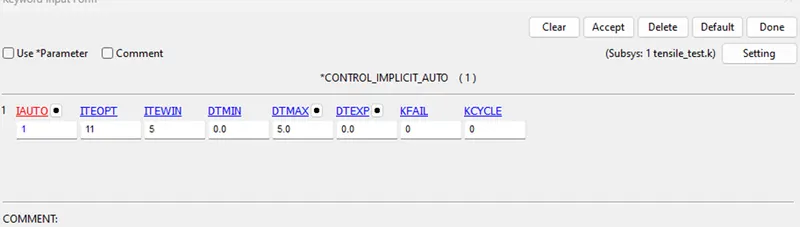
 Control_Implicit_Auto
This card is used for time-step adjustment.
NB: Hourglass control card is activated
DATABASE
Binary D3plot is specified.
Data Extent Binary is specified to get an output for stress/strain by setting STRFLG=1
CONTROL TERMINATION
This keyword controls the end time of the simulation. DT is specified to 1ms.
The simulation is run for both Mooney Rivlin (N=1) and then Ogden rubber (N=2) and the results are compared to the engineering stress experimental data.
POST-PROCESSING
The stress-strain data from the material Mooney Rivlin is taken from the output results of the simulation d3hsp file as seen below:
Mooney Constant 1= 0.1769
Mooney Constant 2= 0.1472
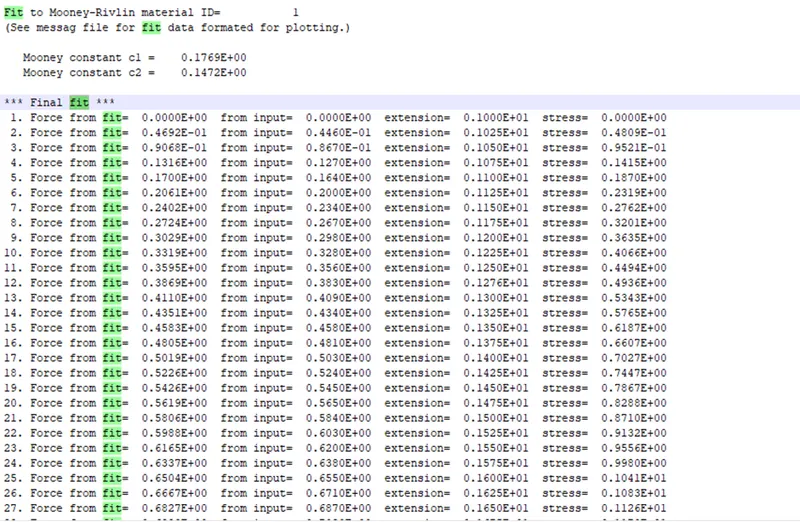
The data above shows the true stress data as well as the extension. The extension is converted to engineering strain by the formula below:
Engineering Strain = λ - 1
Where λ =( extension/stretch)
The true stress data is also converted to engineering stress to be compared with the raw data using the formula:

The stress-strain data from the material Ogden is taken from the output results of the simulation d3hsp file as seen below:
Constant C10= 0.2523
Constant C01= 0.0535
Constant C11= -0.034
Constant C20= 0.0063
Constant C02= 0.0157
Constant C30= 0.0000
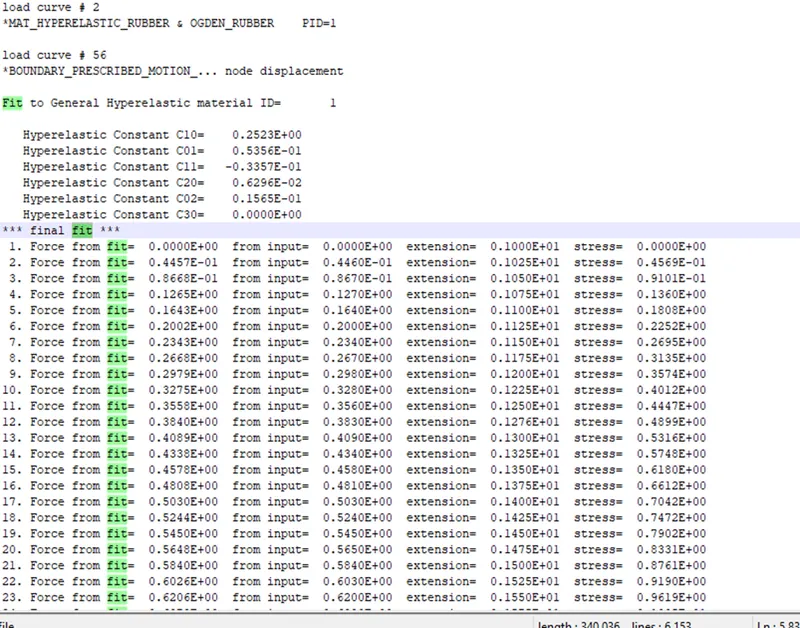
The data is calculated in excel for all engineering strain/stress of both Mooney and Ogden and the data curves are analysed.
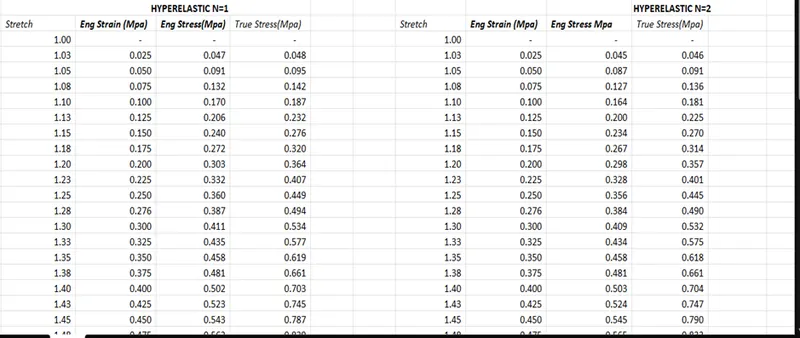
VERIFICATION
To verify the credibility of the simulation data with the physical tensile test material, the curve from the simulation is compared to that of the original curve to check if the resultant stress/strain plot is equal or deviates from its original. Below is the plot which shows all plots for verification. The original plot with curve fit is seen in Blue while the Mooney and Ogden are seen in orange and grey respectively. Both N=1 and N=2 have close fits to the blue curve. Looking at the curve the data, N=2 provided the closet results to the raw experimental data.
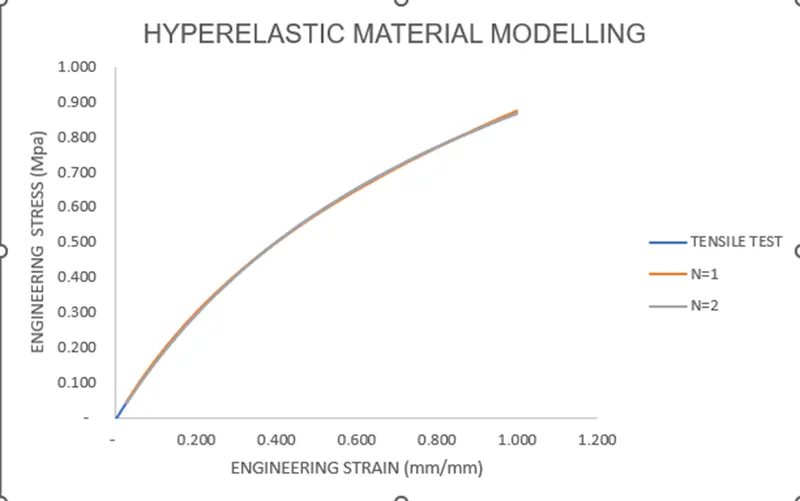
CONCLUSION
From the diagram, the hyperelastic rubber material modelling for the experimental stress/strain curve was successful with MAT_077 in the Ls-Dyna decker. Both N=1 and N=2 Constants as close to the exact representation of the raw data with N=2 being the closest to the experimental data. Therefore, it can be said that the material modelling objective was achieved.