(ANSYS_P12) Bending of iPhone
INTRODUCTION
Safety factor (SF), which is also known as factor of safety (FoS), is a term describing the load carrying capability of a product beyond the actual load. In other words, SF indicates how much stronger the product is than it usually needs to be for intended loading conditions. Almost all products should deliberately be built stronger than required for normal usage to allow for unexpected loads (emergency or incorrect use) or degradation (material defects and environment). SF is a ratio of yield stress to working stress.
(1)
where the working stress is calculated from the maximum load that the part should ever bear in service and the yield stress is a property of the material used in the part.
By the above definition, a product with SF = 1.0 will only support the design load and any additional load will cause the product to fail. A product with SF = 3.0 will fail at three times the design load. Depending on applications and materials, SF value can vary but must be larger than 1.0. As an example, the SF used in standard automobiles is usually 3.0.
Fatigue life is a term describing how long a product will last before the complete failure. Fatigue is the weakening of a material subjected to repeated loads and is progressive and localised structural damage. There are a number of different factors that can affect the fatigue life of a product including material type; its structure, working temperature and environmental conditions. The stress values that can cause the fatigue damage may be much less than the strength of the material typically quoted as the yield stress or the ultimate stress. The material performance is normally characterised by a S-N graph illustrating the magnitude of a cyclic stress (S) against the logarithmic scales of the number of cycles to failure (N). S-N curves are derived from physical experiments on samples of the material. Shown below are example S-N curves for aluminium and steel.
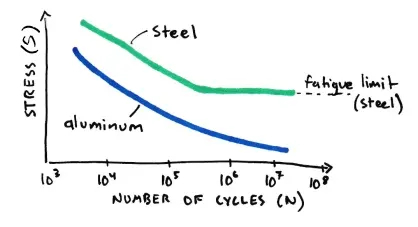
The curve shows how many cycles the material is expected to survive at a given stress. Obviously, as the working stress is increased, the number of cycles that the component can last will decrease. The product is safe to use if, and only if, the working stress is below the curve. With some materials, such as steel, there is what is known as an endurance limit, or a fatigue limit. If the working stress is below the fatigue limit, the component will never fail. If the stress is above the limit, its life will be finite.
The following section provides an example of how SF and fatigue life are analysed by the means of CAE.
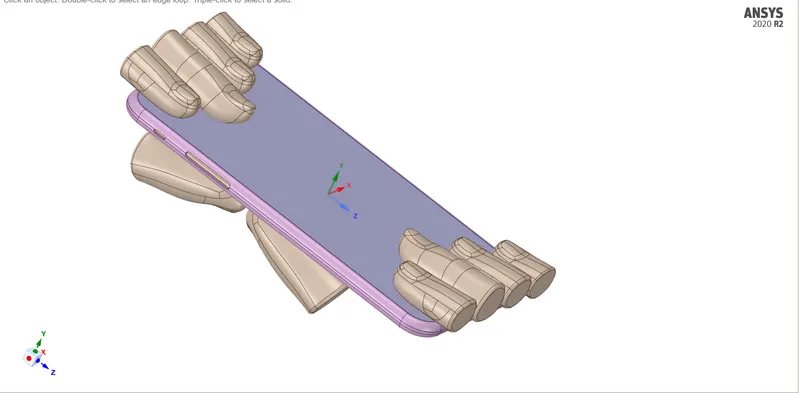
OBJECTIVE: The aim of this project is to simulate the bending of an Iphone 6s by rigid and flexible finger and measuring the fatigue life of the materials used. The finger positions are changed to analyse the changes occured.
TASK
For this challenge, simulate the bending of iPhone as per the given cases below
Case 1: Simulate the model as it is given in the video
Case 2: Move the bottom fingers from their defined position to the given position X= 22.5mm & Z= 10mm and obtain the results for the simulation. Also define the S-N curve for the Aluminium Alloy material as per values given below and determine the fatigue life results for the same.
| Stress, MPa | Number of Cycles, N |
| 225 | 10000 |
| 175 | 100000 |
| 143 | 1000000 |
| 110 | 10000000 |
| 80 | 100000000 |
Results and Deliverables
- Obtain the directional deformation for the model
- Factor of Aluminium Alloy NL
- Life of the Aluminium alloy for the case
- Compare the results and present with the conclusion.
GEOMETRY
The geometry is imported into the workbench and edited using space-claim
MATERIAL AND THEIR PROPERTIES
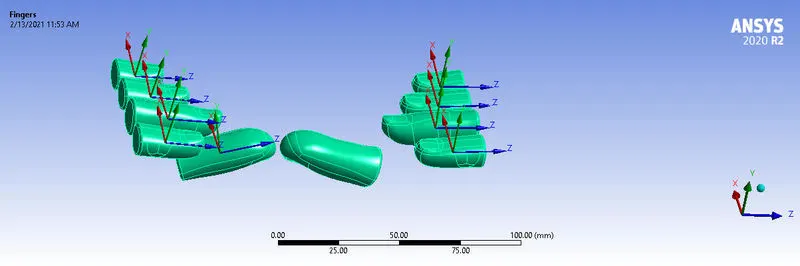
Stainless Steel-(finger)
Density: 7850 kg/m^3
Youngs Modulus: 200000Mpa
Poisson Ratio: 0.3
Tensile Yield Strength: 460 Mpa
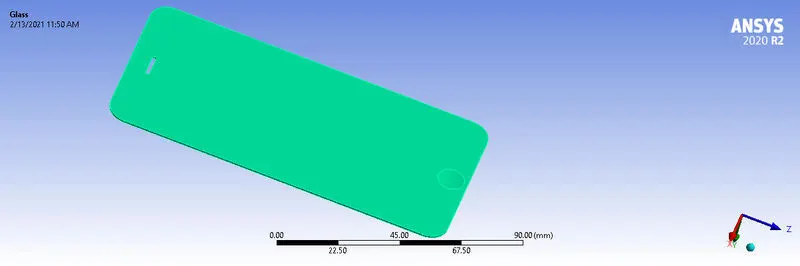
Glass-(Screen)
Density: 2520 kg/m^3
Youngs Modulus: 72000Mpa
Poisson Ratio: 0.2
Tensile Yield Strength: 250 Mpa
Polyethylene-(Inside_Components)
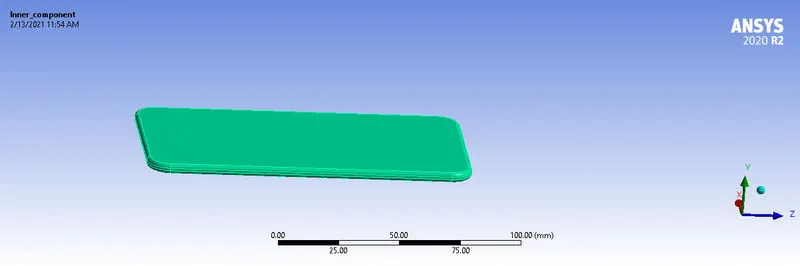
Density: 950 kg/m^3
Youngs Modulus: 1100Mpa
Poisson Ratio: 0.42
Tensile Yield Strength: 25 Mpa
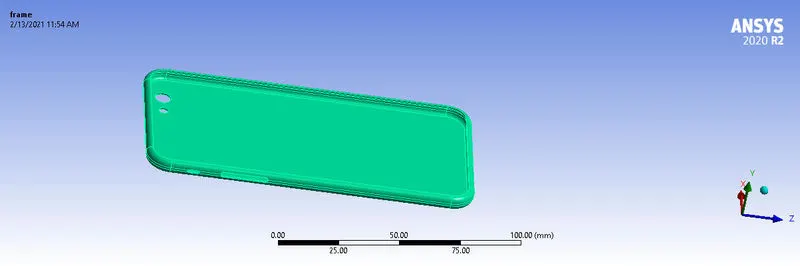
Aluminium Non-Linear-(frame)
| Stress, MPa | Number of Cycles, N |
| 225 | 10000 |
| 175 | 100000 |
| 143 | 1000000 |
| 110 | 10000000 |
| 80 | 100000000 |
Density: 2770 kg/m^3
Youngs Modulus: 71000Mpa
Poisson Ratio: 0.33
Yield Strength: 280 Mpa
These materials are assigned to their respective components as described. The stiffness of all fingers are set to rigid except for one of the thumbs which was left at default flexible.
MESHING
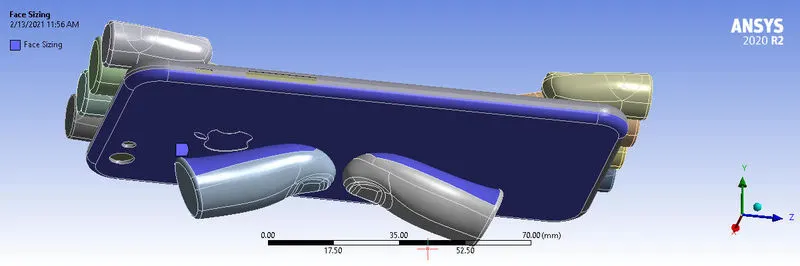
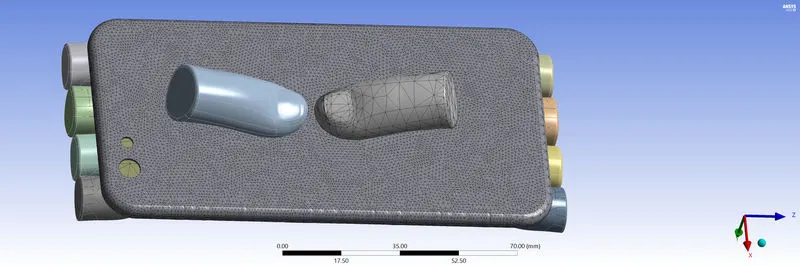
A mesh sizing to the critical part being te upper surface of the two tumbs and the frame is created with a mesh size of 1.5mm is selected after mesh grid dependency. The selected parts can be seen below together with the final mesh.
CONTACT
General seting used
- Augumented Lagrange
- Add offest , no ramping
- Default for all others unless specified below
- Frictionless
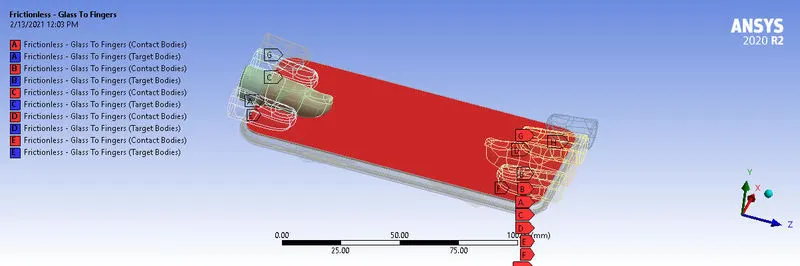
- Contacts are defined between all the glass (Contact) and the Fingers (Target)
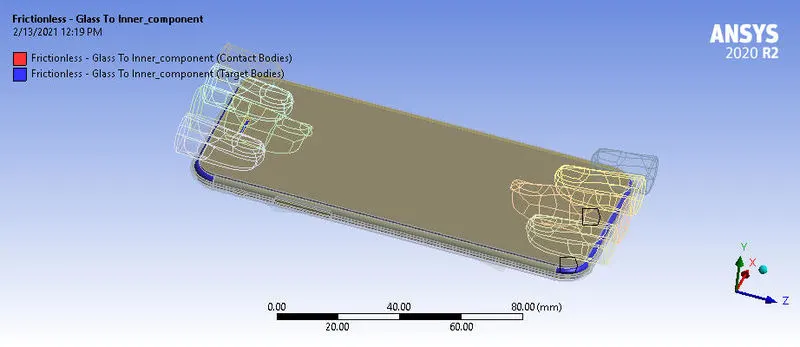
- Contacts are defined between all the glass (Contact) and the Inner-component (Target).
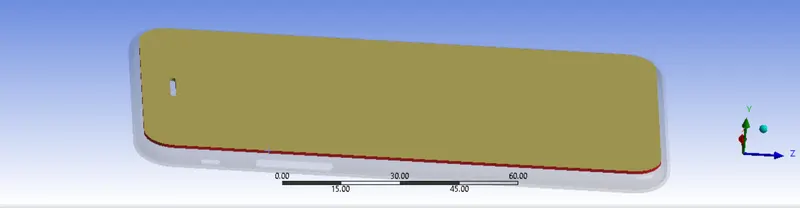
- Contacts are defined between all the glass (Contact) and the frame (Target)=BONDED
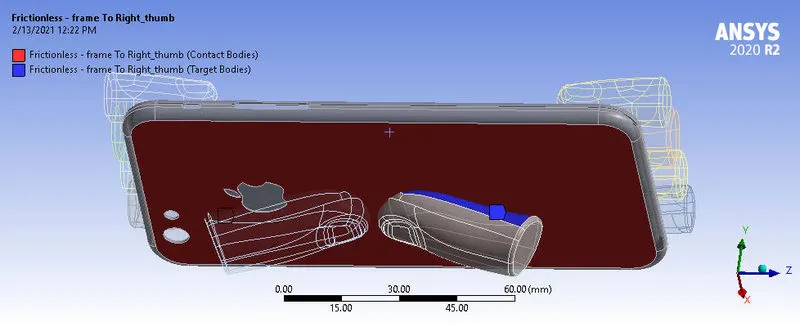
- Contacts are defined between all the frame(Contact) and the Right thumb (Target).
- Contacts are defined between all the frame (Contact) and the inner-component(Target).
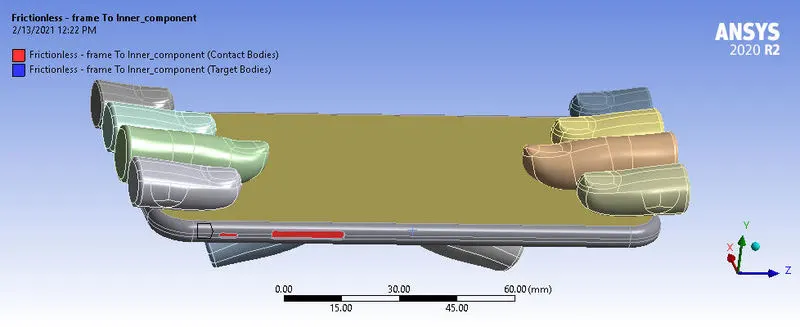
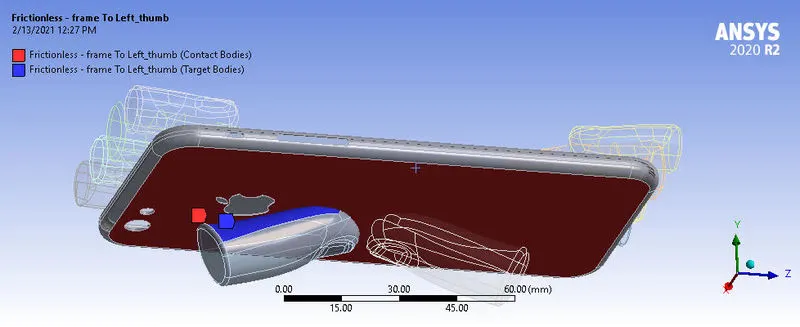
- Contacts are defined between all the frame (Contact) and the Left Thumb(Target).
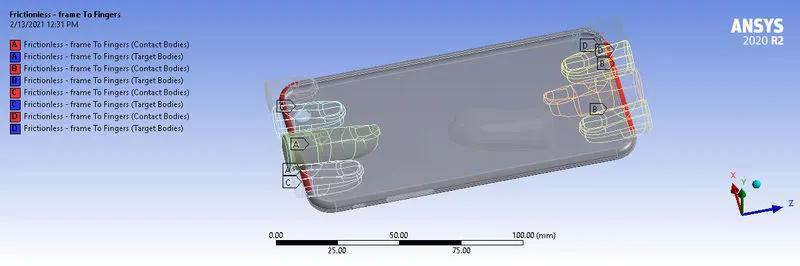
- Contacts are defined between all the frame (Contact) and the fingers(Target).
ANALYSIS SETTINGS
Auto Time Stepping: Program Controlled
No of Steps : 8
Large Deflection : ON
Stabilization :Constant
Method : Energy
Energy Dissipation :0.1
Solver Type: Program Controlled
BOUNDARY CONNECTIONS
FIXED JOINTS
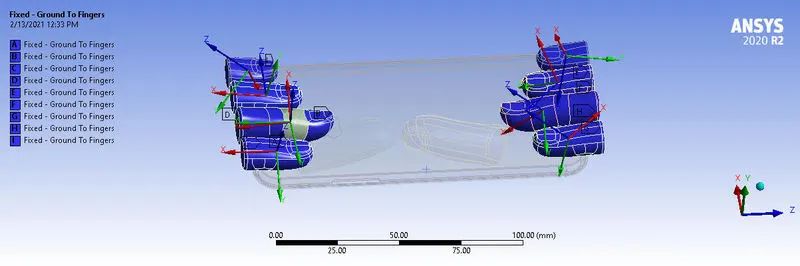
Fixed joints are specified for all the fingers below
TRANSLATIONAL JOINTS
Two translational joints are assigned for both thumbs with the dirextion of motion in the x-axis corresponding to Y axis on the global axis.
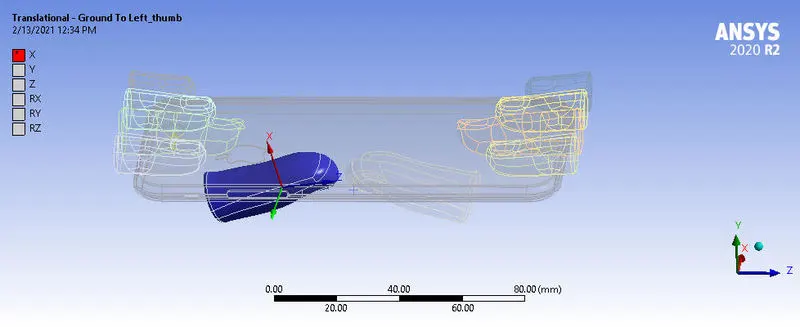
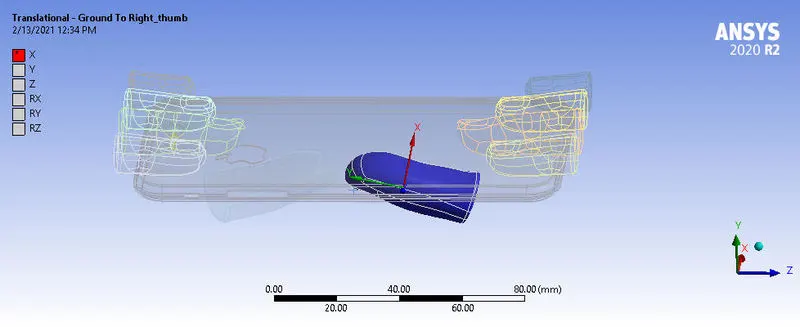
DISPLACEMENT
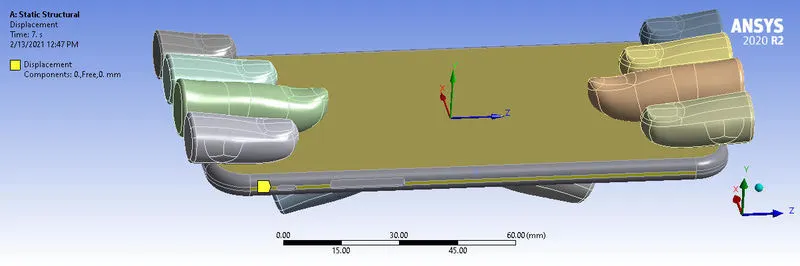
Four faces of the fram is seleted to restrict displacement in the y and z axis .
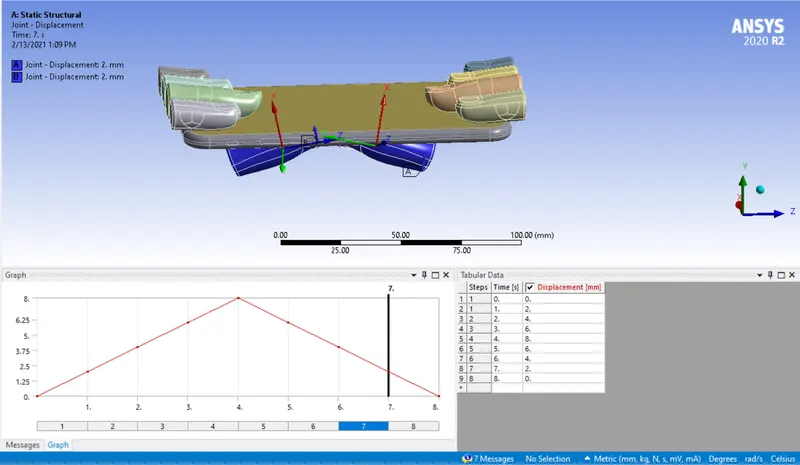
Joint Load is specified for the left and right thumb to enforce vertical displacement of 8mm. This is done by specifying tabuar data.
SOLUTION
Solution specified is.
- Directional Deformation of the model
- Equivalent Stress of the frame
- Life of the aluminium frame
- Safety factor of the aluminium frame
RESULTS
CASE_1
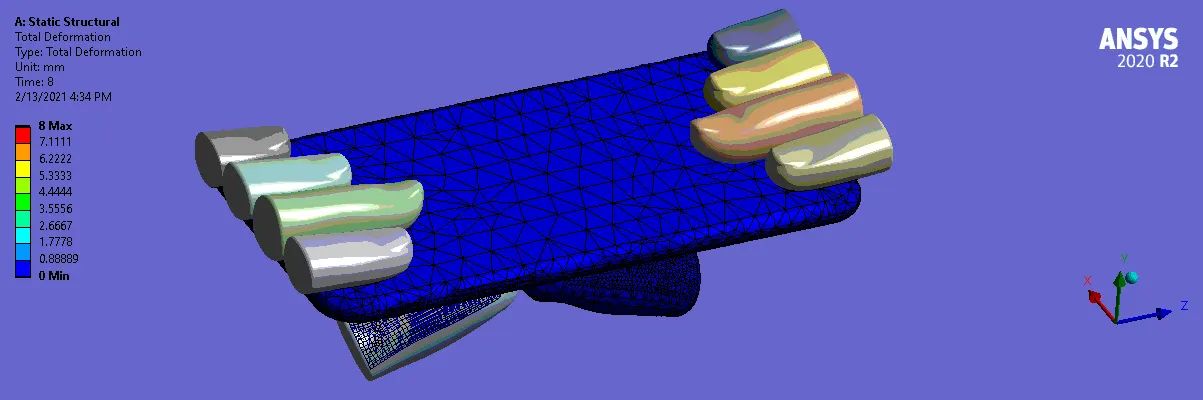
Directional deformation
The model was deformed in the vertical x -axis with a maximum deformation of 5.88mm at the centre of the iphone where the vertical load was applied.
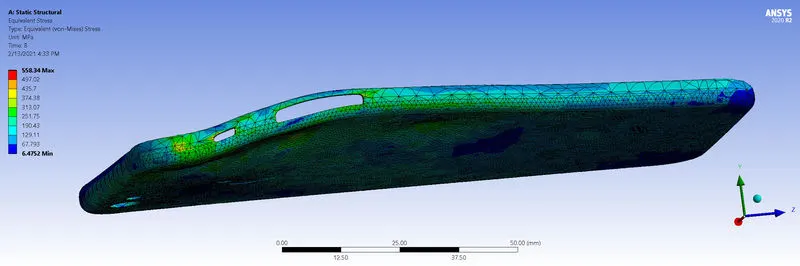
Equivalent Stress of frame
The maximum stress developed on the aluminium frame is developed at the ends with a magnitude of 558 Mpa
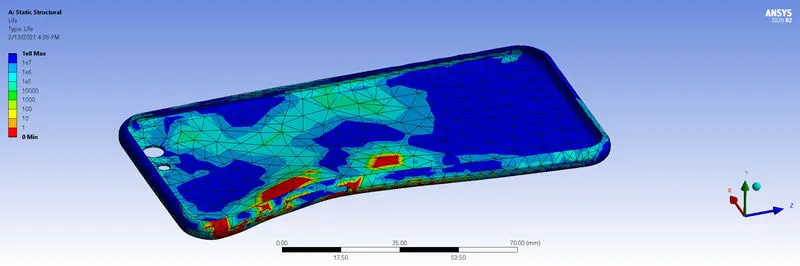
Life of the aluminium frame
It can be seen below the fatigue life of the frame from the input S/N data.
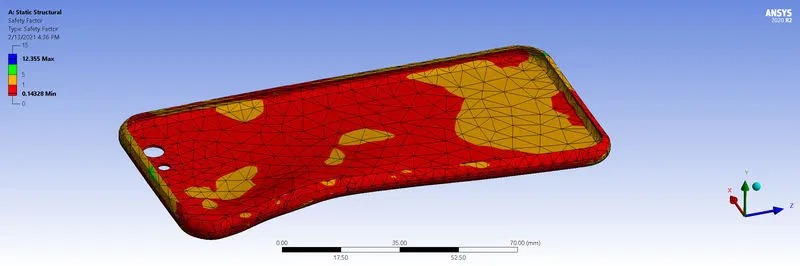
Factor of Safety
CASE_2
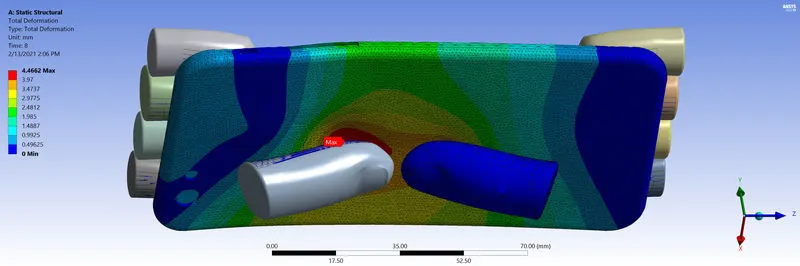
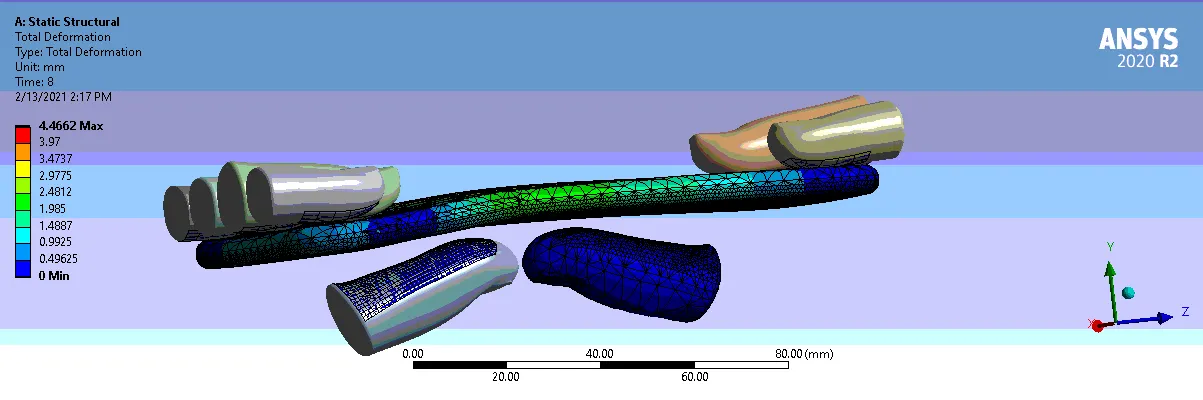
Directional deformation
The model was deformed in the vertical x -axis with a maximum deformation of 4.46mm at the centre of the iphone where the vertical load was applied.
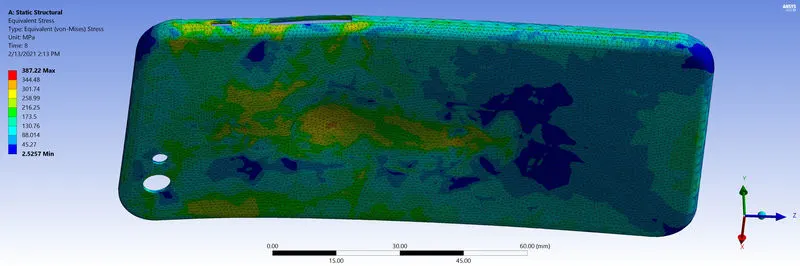
Equivalent Stress of frame
The maximum stress developed on the aluminium frame is developed at the ends with a magnitude of 382 Mpa
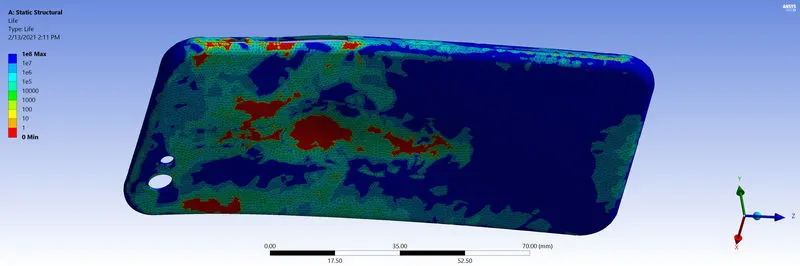
Life of the aluminium frame
It can be seen below the fatigue life of the frame from the input S/N data.
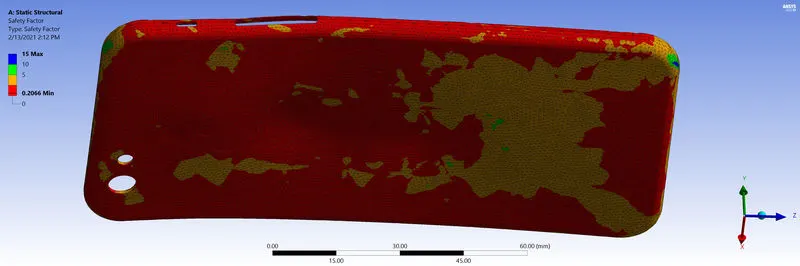
Factor of Safety
DISCUSSION
Comparing the two cases with the different thumb position , a table is developed to analyse the final results
| CASE | MAXIMUM STRESS (Mpa) | DEFORMATION | YIELD STRENGTH |
Fatigue Life (Min) |
FACTOR OF SAFETY(min) |
| 1 | 558 | 5.88 | 280 | 0 | 0.14 |
| 2 | 382 | 4.46 | 280 | 0 | 0.26 |
It can be seen that, the maximum stress developed in both cases exceeded the minimum yield strength of Aluminium. This would results in evidence of high deformations and very low life and factor of safety.
From the above simulation, it can be seen that the change in the position of the thumbs affected the results.The maximum stress was reduced as the greater area of contact increased the resistance to deformation at the middle portion of the phone. As a results the frame is stronger when deformed from the middle rather than the edge.
Due to the increase in strength , there was less deformation of the fram from the middle compared to the first case. The fatigue life of the frame is very bad for both cases as majority of the parts would rather fail immediately from the get go as the stresses developed is above the yied strength of the frame. But comparing both cases , there was a slight increase in the fatigue life in case 2 as lesser stresses was developed.
Concerning the factor of safety, the applied load is to large for the material as it can be seen that that majority part of the material which is in red cannot withstand the load . Both cases have very low factor of safety but again the case two had a slight better factor of saftey. This mean majority part of the frame cannot withstand the load but the strength of the frame is increased if the load is directed from the middle.
CONCLUSION
This experiment was succesful as fatigue and factor of sasfety was demonstrated on the bending of an iphone 6s.
Files available through the google drive link below
https://drive.google.com/file/d/1BqdTsSh_eeskThJz2W7ViPrdhkwp60by/view?usp=sharing