Week 5 - Curve fitting
AIM: The aim of this is to perform a curve fit analysis using Python
METHOD
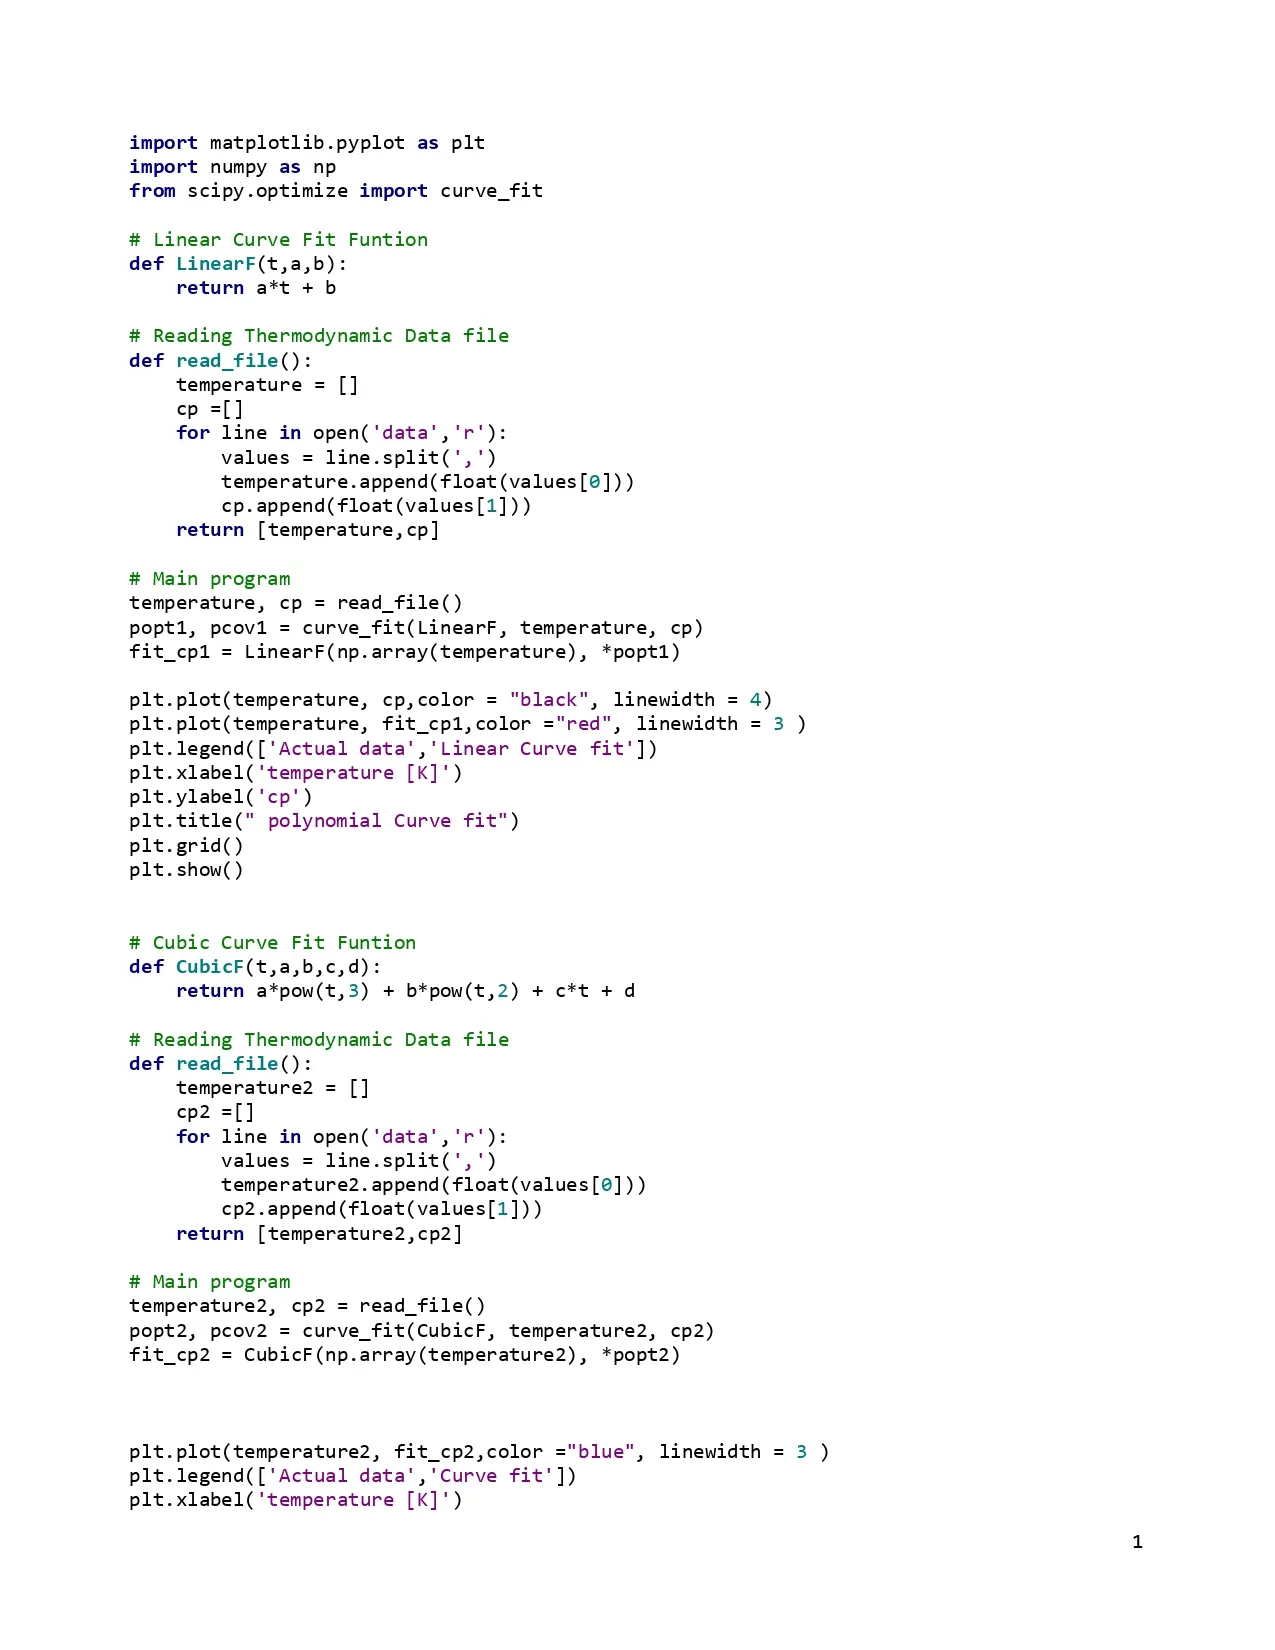
The code above is used to perform a curve fit on a set of data values. The popt stores as an output all the coefficients calculated from the curve fit function. Pcov......
The function np.array(temperature) converts the variable temperature, into a NumPy array.
*popt is
- It is the output of
curve_fit, which contains the optimized parameters for the curve-fitting function in the case of theLinearFfunction - f(t),
popt1is a tuple with two values:[a, b].
To improve the curve fit, ensure the data is clean by removing outliers, scaling values, and having enough points to capture the trend. Choose an appropriate model that matches the data's behavior, such as switching from linear to polynomial, exponential, or other functions if needed.
Linear and Cubic Polynomial Fit
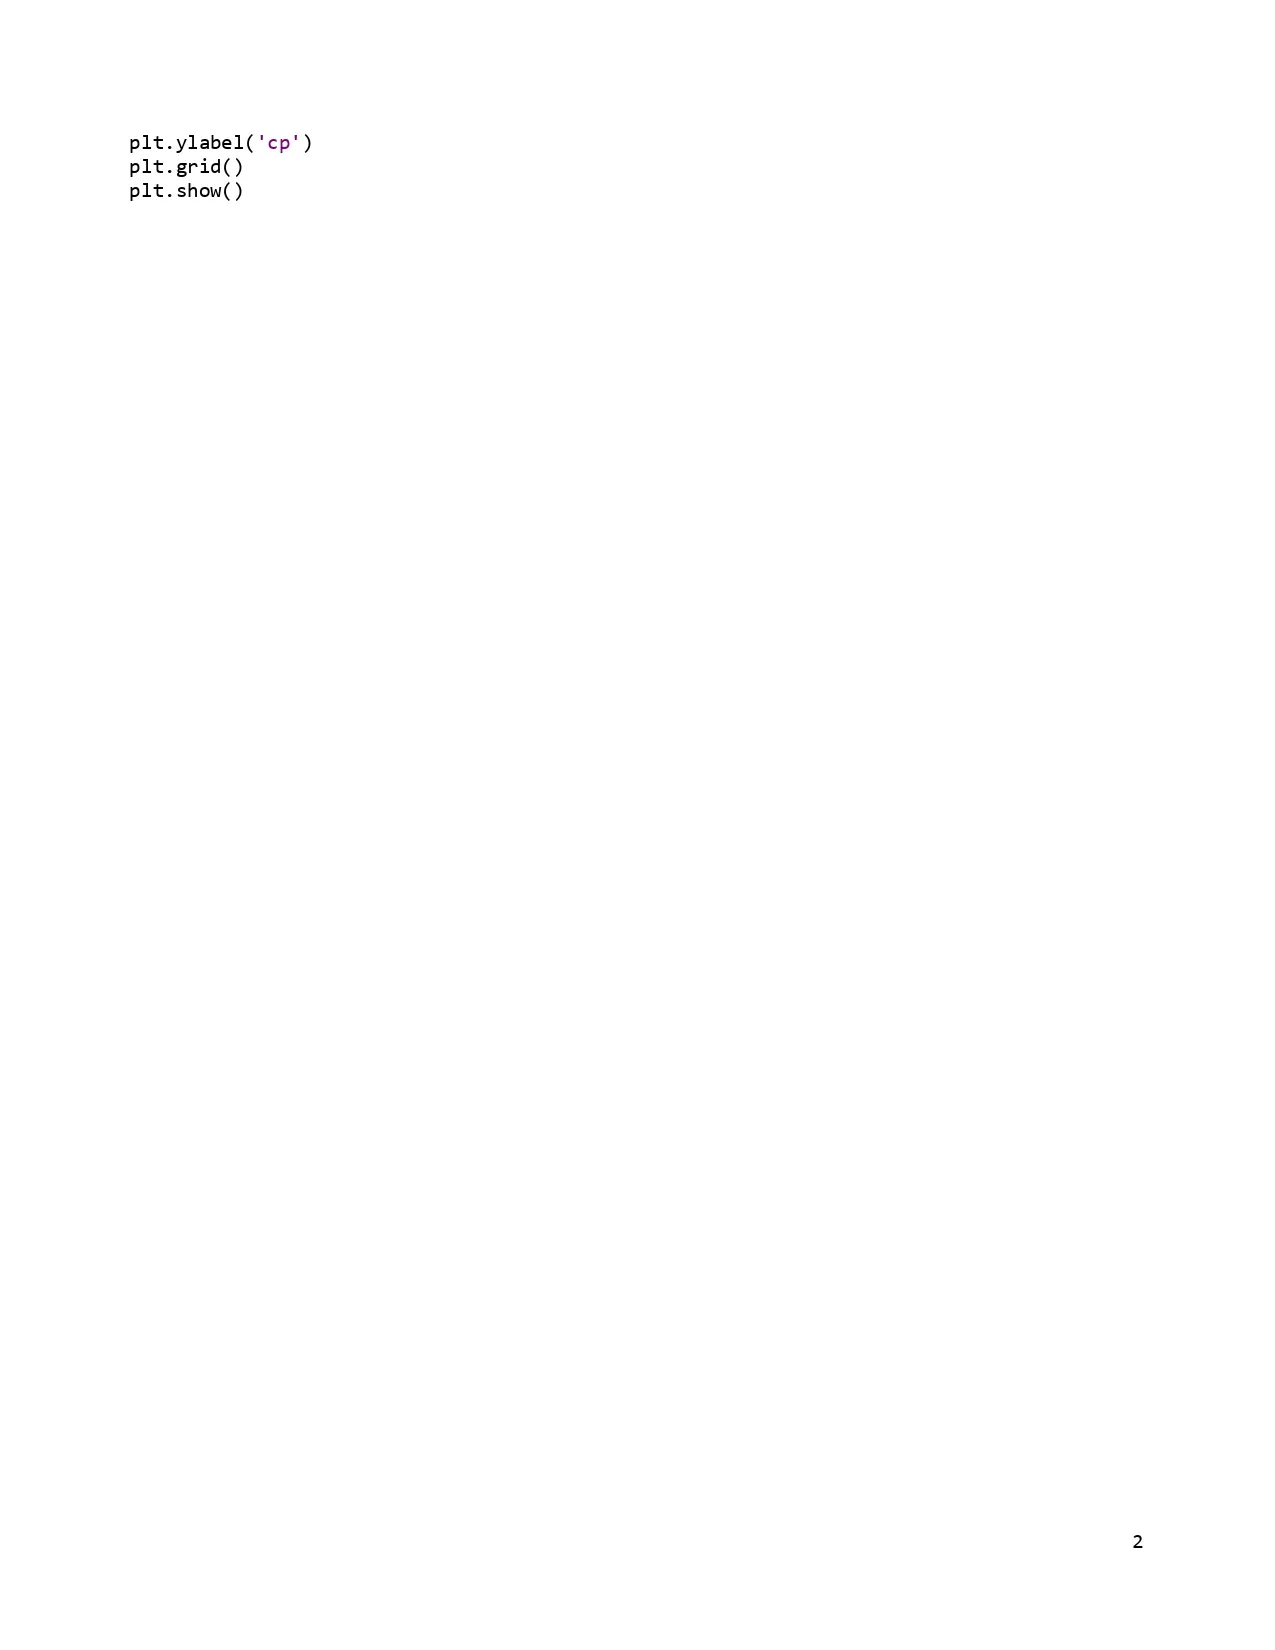
The program will be written in three major parts. Firstly, a fucntion is defined which has the equation for the curve fit equation be it linear, quadratic, or cubic polynomial fit.
Secondly, the data to be analyzed is read using def read_file(): and the values are placed in an array. We create empty arrays for temperature and specific heat. We use for loop to read ('r') each line of data. The split command splits the two between (,). The first would be an array of the first column and the second of the second column. We append the first arrays to temperature empty array and we use float to convert from strings. specific heat is done likewise.
Lastly, the function with the data is called as temperature, cp. The Coefficients are computed and plotted.
curve_fit(LinearF, temperature, cp):
- Finds the best-fit parameters (
popt1) and their covariance (pcov1) for the linear functionLinearF. fit_cp1 = LinearF(np.array(temperature), *popt1):- Uses the fitted parameters (
*popt1) to calculate cp values for the given temperatures.np.array(temperature)ensures the input is an array.
CONCLUSION
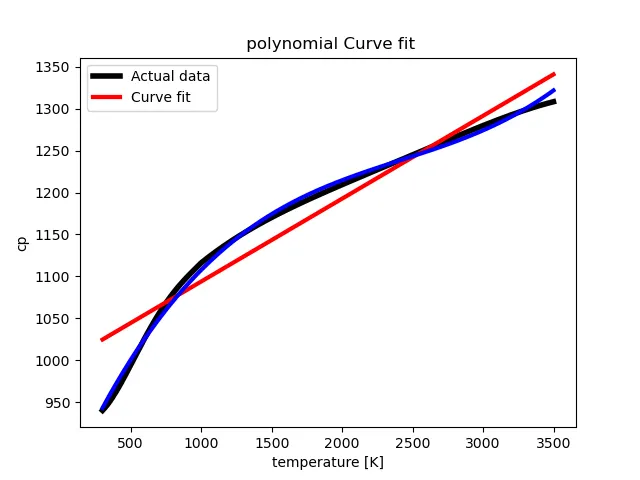
From the diagram below, it can be seen the two different curve fits being the linear red and cubic green. the linear curve deviates completely from the actual black curve deeming it unfit for curve fitting. The cubic green curve however matches the actual curve almost perfectly. This proves to be a good curve fit. The coding of linear and cubic curve fit was coded successfully, and this is shown in the report.