Assignment 6
Objective:-
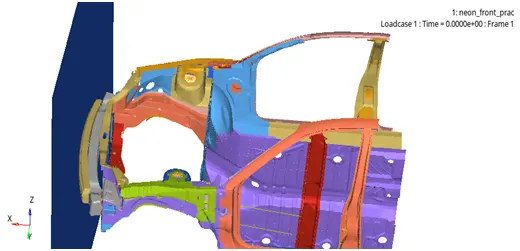
To run and analyze the frontal crash of a BIW car model. It is done to study the crash analysis of a car during frontal crash and to study the behavior of the model in various parts during collision.
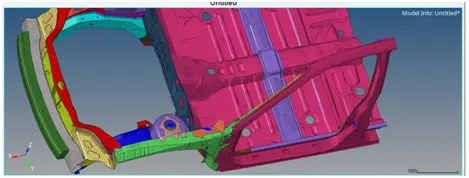
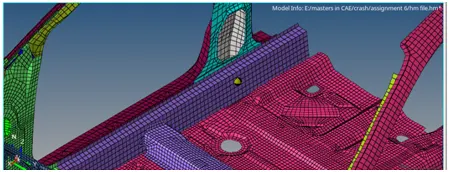
Import the model.
Check for unit system. In our model I am proceeding with kg mm ms.
On comparing with the original 300k model we are comparing for interface and recommended paramaters.
Also we will be checking for any penetrations and intersections
Check for any issues with rigid bodies.
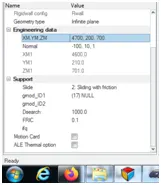
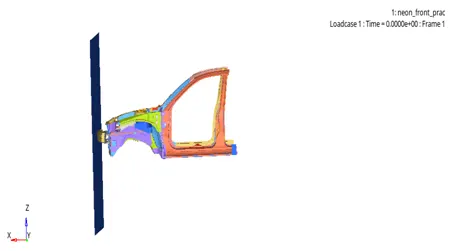
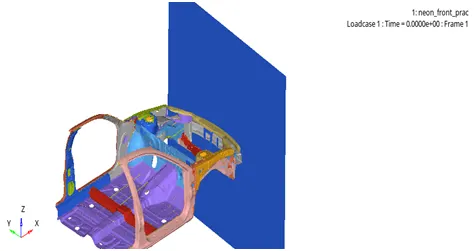
Create rigid wall with friction 0.1
Now the mass of the segment is ____________- and we have to add the mass and reach it to 700 kg for the crash simulation requirement.
Initial vrlocity is to implemented at 35 mph
To ensure good quality use model checker.
- First of all before anything we have to check the unit system and confirm that we are using the correct unit system. I will help us for further assigning properties to the materials.
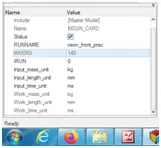
- Creating Type 7 interfaces and deleting all the others interfaces, with the values
Istf =4
Igap=3
Idel 2
Fscale gap = .8
Fric = 0.2
Gapmin = .5
Inacti =6
& iform = 2
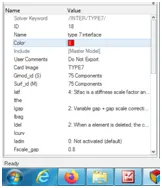
- Applying rigid-wall with sliding friction 0.1, And assigning properties as per the requirements
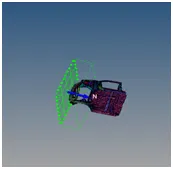
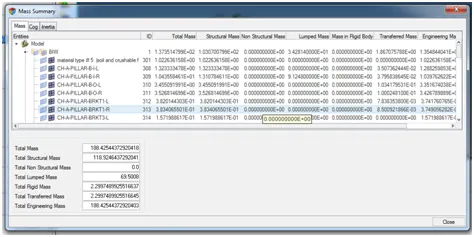
- Added mass is found to be 188.425 which we have to make 700 kg
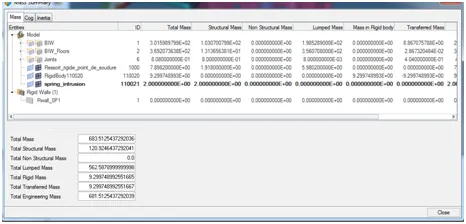
With adding mass to the nodes wherever required, Mass which needs to be about 700 kg is settled at = 683 kg
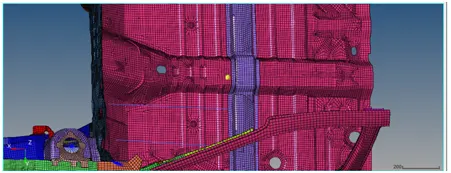
Cog is at a some point here. It must not be their and must be some point here. So for attaining it adding mass to the the model.
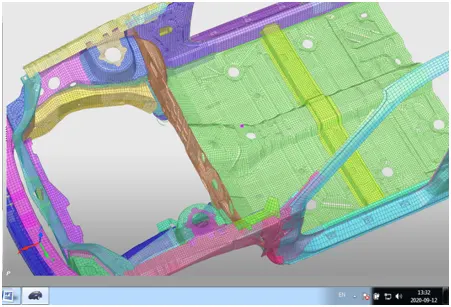
COG is settled near to the cabin seat reinforcement front. The coordinates after adding the mass and changed COG is as follows:
X= 2739.29
Y= 52.73
Z= 300.03
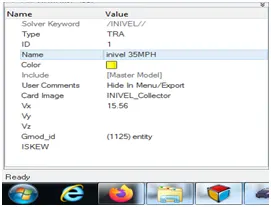
- Imposing initial velocity to the model. We have given the inivel of 35mph which gives us 15.56 mm/ms velocity.
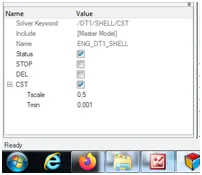
- Assigning Time-step control with minimum time step as 0.1 ms and t scale factor as 0.5.
- Checking intersections and penetrations
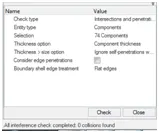
With the model we have, there is no intersections and penetrations.
- As previously told in the videos that the sectional forces are maximum at the headlight brackets, shotgun(fender) rails and the A-pillar. So to know the sectional forces in thee members we are creating sections and also creating moving frames and assigning these frames to these sections for both headlight brackets, fenders, side rails and A-pillars. Sections for all the components for which the sectional force are to be obtained.
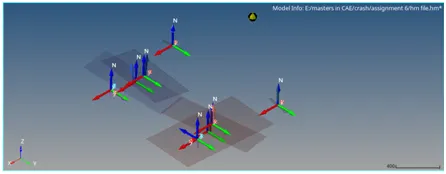
- Created sections for sectional forces for with values as
Delta t = 0.1
Alpha = 1.67
Iframe = 12 COG of the section
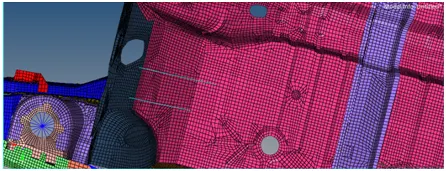
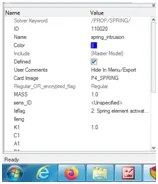
- Creating spring intrusion in hypermesh in the dash walls 66244 and 66695
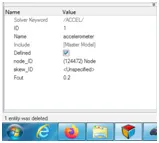
- And accelerometer is placed at the b-pillar to know the accelerations at B-pillar, with f-cut value as 0.2
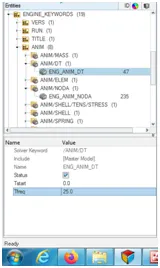
- The frequency for writing the animation files is kept as Tstart= 0
- And Tfreq = 25 for at least the 25 animations per cycle so that the simulation is clear.
- Output request
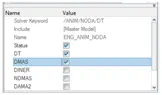
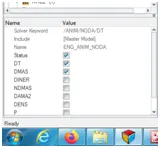
Anim/noda/dt for time step animation output request
& anim/noda/dmas for mass variation due to mass scaling during the mass addition.
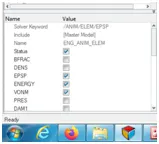
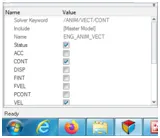
- Output request for VON mises stress by going through
Solver - engine keywords – anim - anim/shell - VONM,hourglass energy, and EPSP(elastric strain & Plastic strain)
Output requests requested for the simulation are as under
Simulation run and diagnosis:
After all the changes we have made, we have to run the simulation and check for the results. While running the simulation mass error and energy error is to be tracked. If any abnormality is their both the errors then that means there is some error in the simulation which is to be avoided fully to get the better result.
The mass error and energy error as accounted at the end of simulation are:
Mass error = 0.3104E-01
Energy error = -1.5%


Both the mass and energy error are within the limits, therefore commencing further steps of plotting the graphs.
Simulation results:
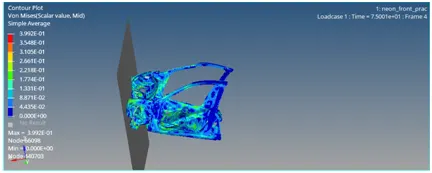
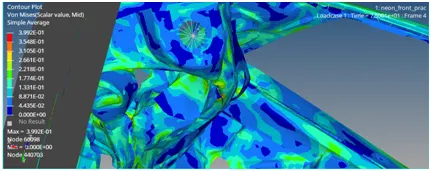
Von mises plot:
The maximum value of von mises is 3.992E-01 i.e. 0.399KN/mm2. It must be somewhere in between the front cross rail and the dash wall region as from the animation it is evident that the the area where the shockup is placed is getting crushed in between the fender/Rail and dash wall region.
Energy plot:
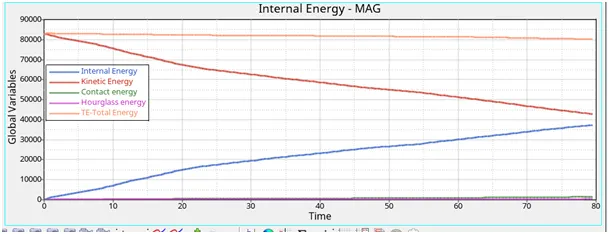
From the above plot it can be seen that:
- Total energy starts from 83000 and ends near 80000, i.e. there is a decrease in total energy during the simuation.
- KE is decreasing gradually, as expected due to slowing down of the car after the crash.
- Hourglass and contact energy are much small compared to the total energy.
- IE increases as the rigid wall deforms the car.
Sectional forces are recorded as below:
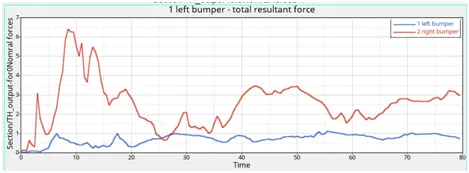
Bumpers to rails:
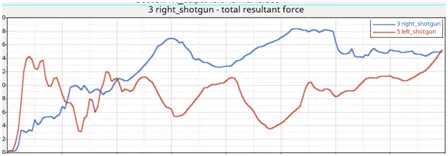
Left and right shotgun
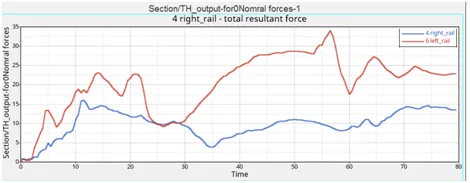
Left and right rail
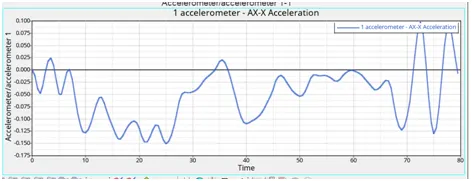
Acceleration curve
Conclusion:-
We have conducted the crash simulation for the frontal crash of the model.
Based on the above results a short summary is as follows:
- Total energy decreases a little at the end as recorded due to losses.
- The mean negative acceleration i.e. mean deceleration recorded by the sensor is near to 0.03 mm/ms2
- Max von mises is noted at 0.399 KN/mm2 between the dashwall and fender.
Finally we can summarize that as expected the max destruction goes at the front part of the model and there is minor effects in the rear part i.e. passenger cabin compartment which satisfies crash test that the occupant is safe to an extent.