Assignment 5-RADIOSS Interfaces & Study of Effect of Notches Challenge
To mesh the bumper component using Hypermesh and also run the simulation on crush tube by using Radioss.
Aim:
- Create the mesh for bumper assembly,mesh size should be 6mm.
- Run the crash tube model as it is.
- Change the Inacti=6 and run.
- Create the type 11 contact and run.
- Remove both notches and remove boundary condition on rigid body node then run.
- Create a new notch in the middle ,select the whole section and run.
- Create a new notch with nodes only from opposing 2 faces and run.
Steps followed:
Case 1:
1) To perform mesh operation on bumper component as per quality criteria.
- Open the hypermesh software and set user profile interface as Radioss,which is an explicit solver type to handle large deformations.
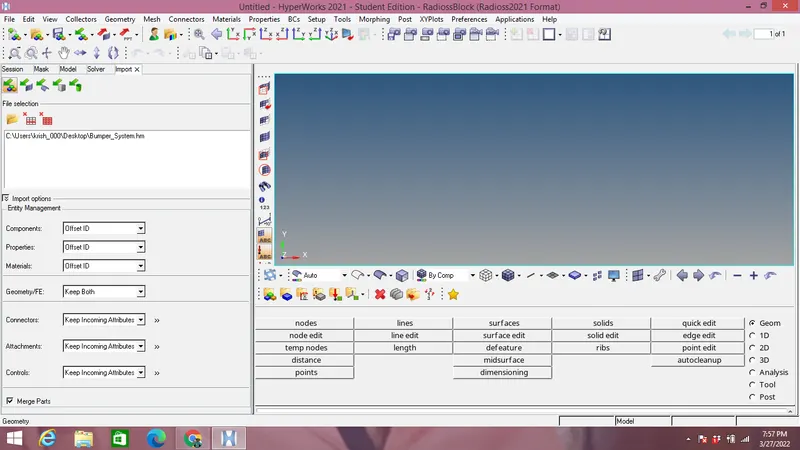
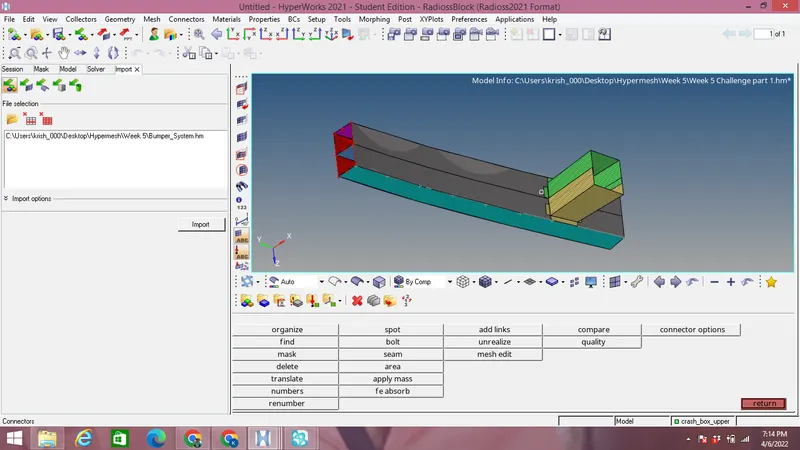
- Import the .hm file of bumper model as shown in the image below:
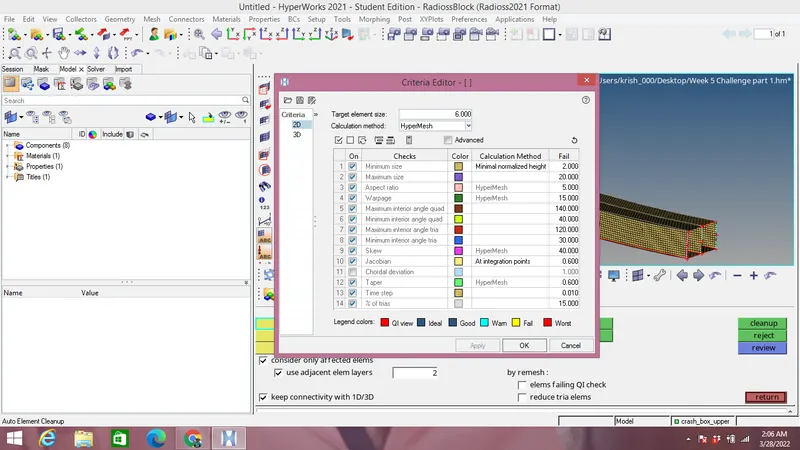
- Assign the quality parameters by selecting Preference and clicking on Criteria menu settings and Target length of 6mm to the element size & click OK as shown in the image below:
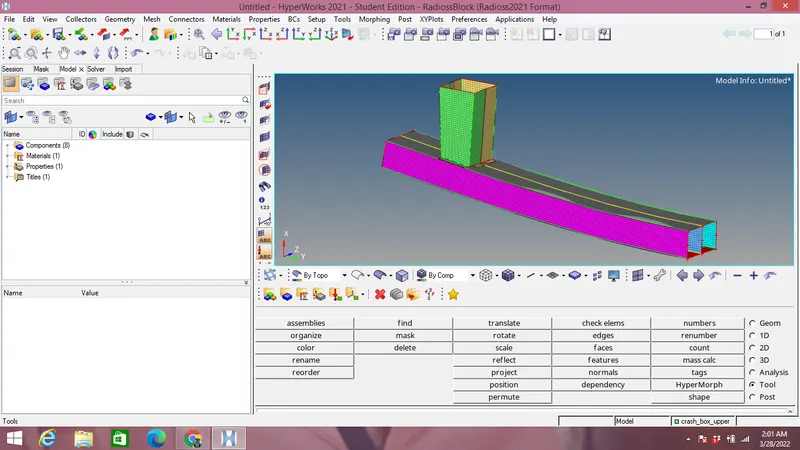
- Now click on Automesh from 2D panel as shown in the image below wih 6mm element size during meshing as shown in the image below:
- Now connect the crash boxes with Bumper using Spot weld which is present in 1D panel under connector-spot-spot weld.In the loaction select the nodes of the crash box,in the connector select the components to be connected i.e crash box & bumper rear, enter the number of layers as 2 and search tolerance as 2.5 Select type as weld with diameter=2 and click on create. Connectors created as shown in the image below:
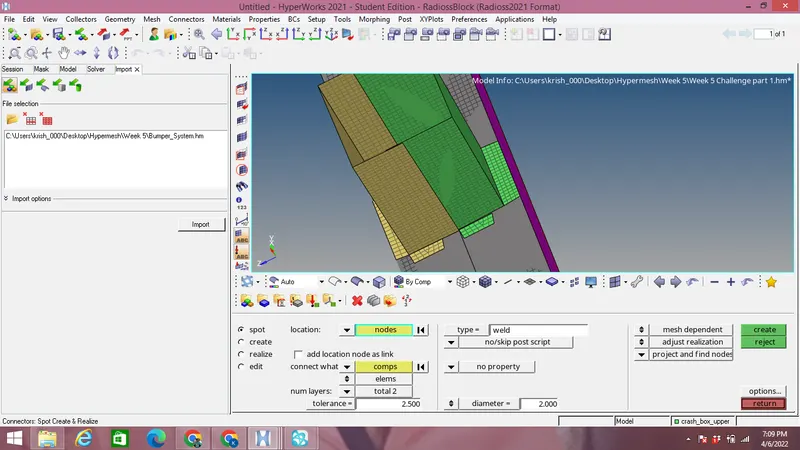
Thus meshing is doen on the bumper & crash boxes are connected to the bumper using 1D connectors.
Now we proceed to run the simulation for the imported crash tube:
Case 2:
We have to run the simulation with no changes.Open Hypermesh and import the 0000.rad files in solver deck as shown in the image below:
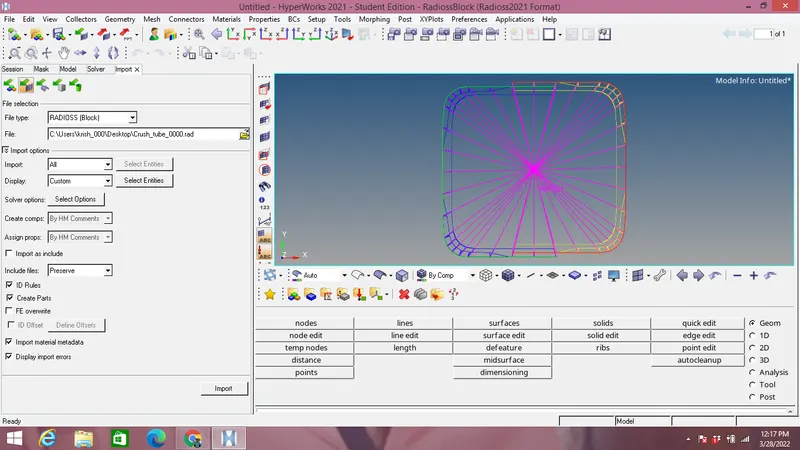
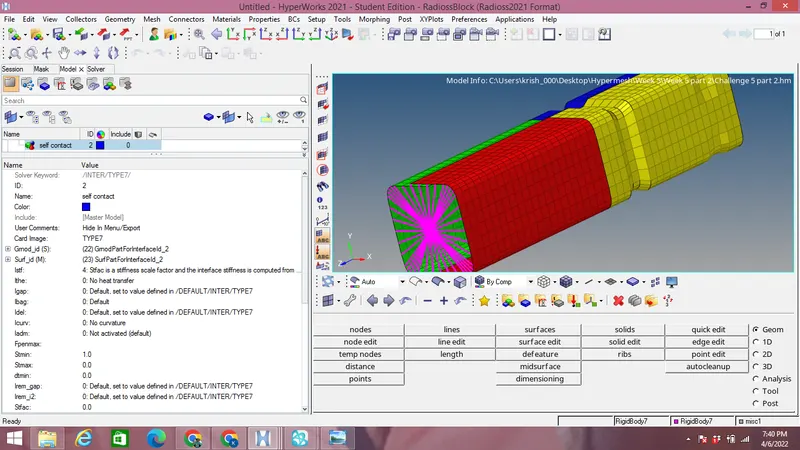
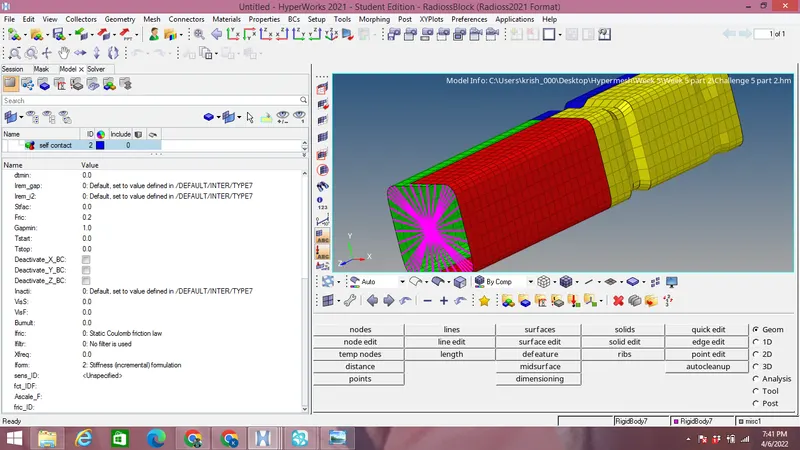
- After importing the model we can check interfaces in the model as Type 7 interface is used with the following defined parameters as:
| Istiff(will set the interface based on softer of master & slave) | 4 |
| Igap(How size of gap is calculated) | 0 |
| Inacti(action to take if intial penetration occurs) | 0 |
| Iform(Stiffness based on formulation of sliding forces) | 2 |
| Stmin(min thickness to avoid too soft contact) | 1 |
| Gapmin(min gap for activation of interface) | 1 |
Image containing parameters is shown in the image below:
For material law we are defining Type2 card for elasto-plastic material law with density,Possion's ratio & Young's modulus as shown in the image below:
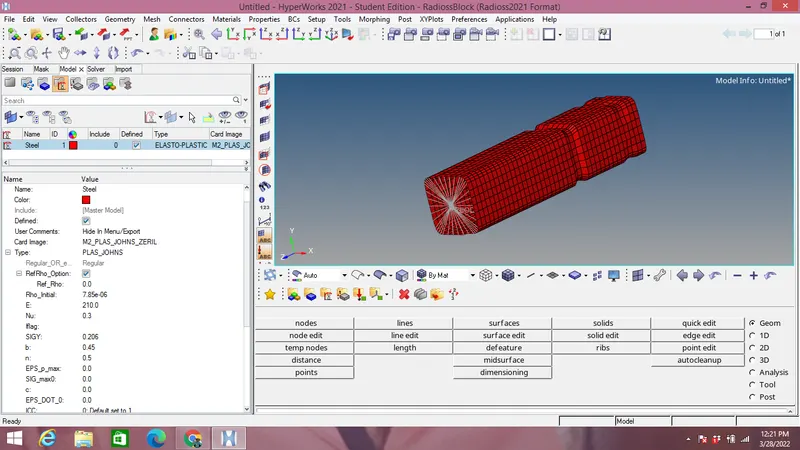
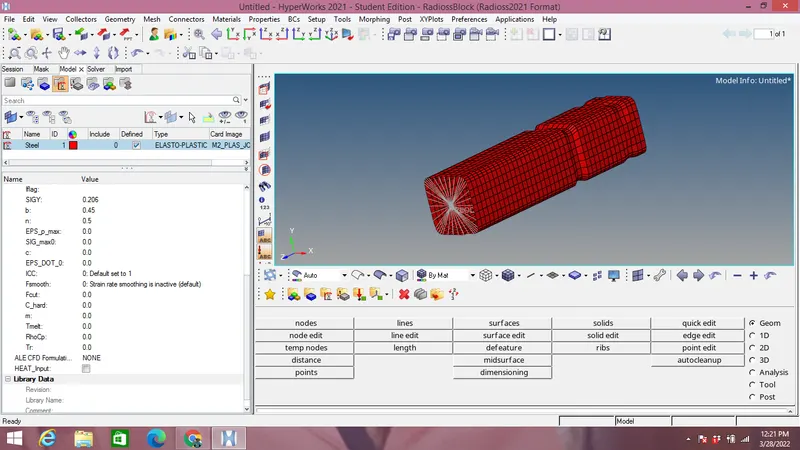
- Now we can run the simulation under Analysis panel with Radioss option and CPU threading as -nt 4.
- After running the output files obtained as shown in figure below with mass & energy errors as shown in the image below:
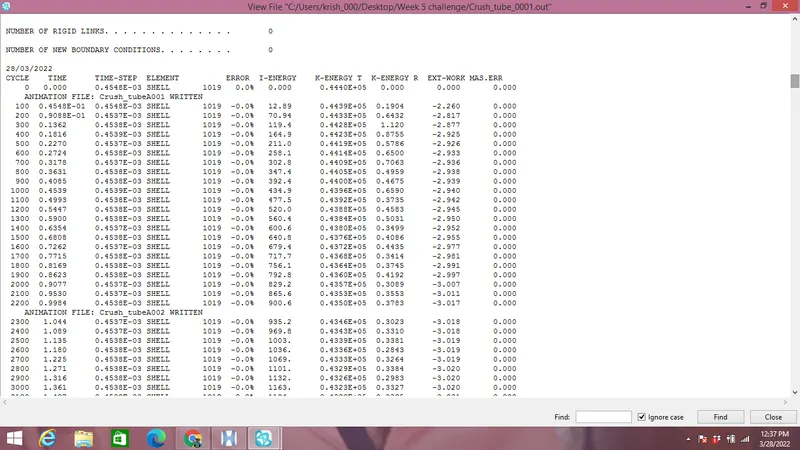
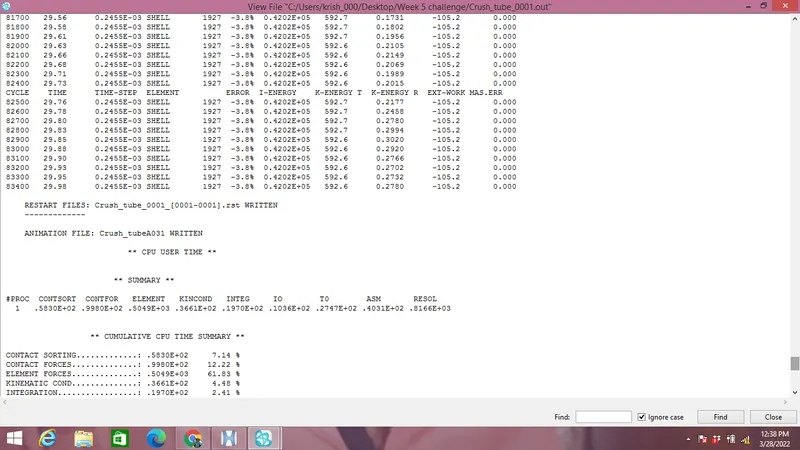
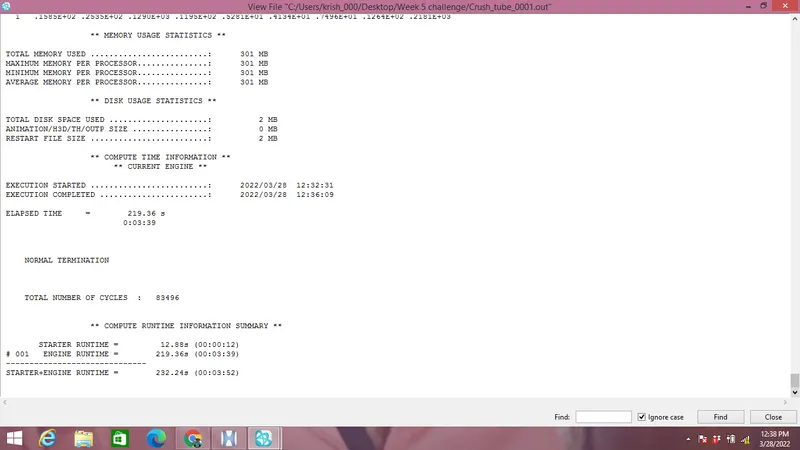
It can be observed from the image below that maximum energy error as -3.8% which is between -15% to 5% so acceptable and maximum mass error is 0 which is between 0 to 2% again acceptable.
- Go to Hyperview mode from hypermesh mode & select the .h3d file as shown in the image below & plot the Von Mises stress animation as shown in the image below:
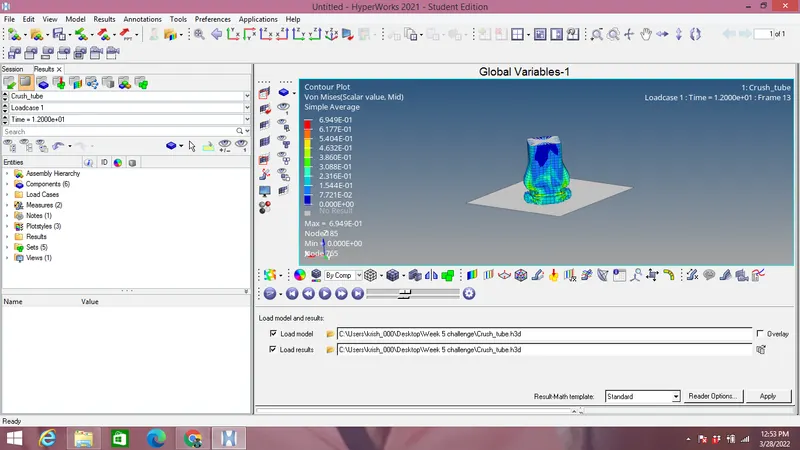
Maximum Von mises stress reached upto 0.694 MPa over the period of time.
From the images above we can see that stress starts at the notch region first then propogates from the middle notch to the bottom of crush tube.
- Now we have to switch from Hyperview to Hypergraph 2D mode and plot Internal,Kinetic & Contact energy as shown in the image below:
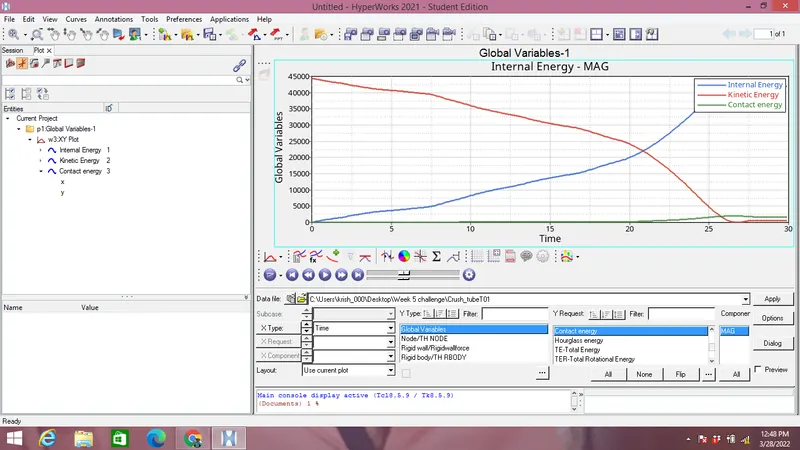
We can see from the image above that Kinetic energy is decreasing from start time to end time as displacement rate is reduced.
As we know that internal energy,there is no heat transfer to the system.So we have to consider work doen for calculating the internal energy. As displacement is increasing over a period of time so work doen is also increasing.
- Now we are plotting the Total resultant force at the Rigid wall as shown in the image below:
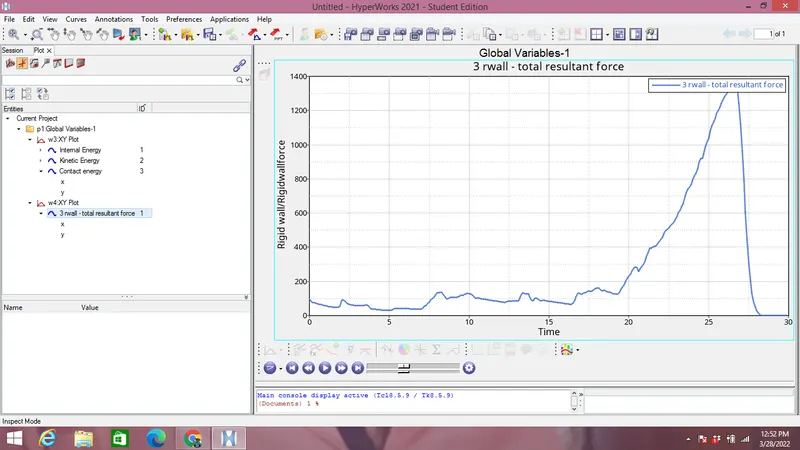
Intially rigid wall forces starts from the lower value because intially there is no contact between crush tube & rigid wall. The graph goes on increasing because elements are getting deformed & once rigid wall reached at peak entire crush tube collides with rigid wall.
Case 3:
All the steps are same as above only Inacti=6 which removes the intial penetration wherever possible else reduces it to 30% of the defined gap value and adjust the gap as shown in the image below:
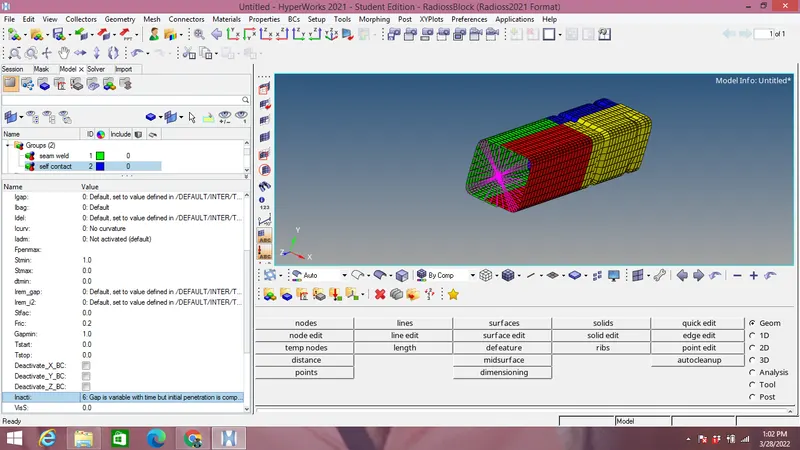
- Run the simulation like in case 2 under analysis panel and output files obtained are shown in the image below:
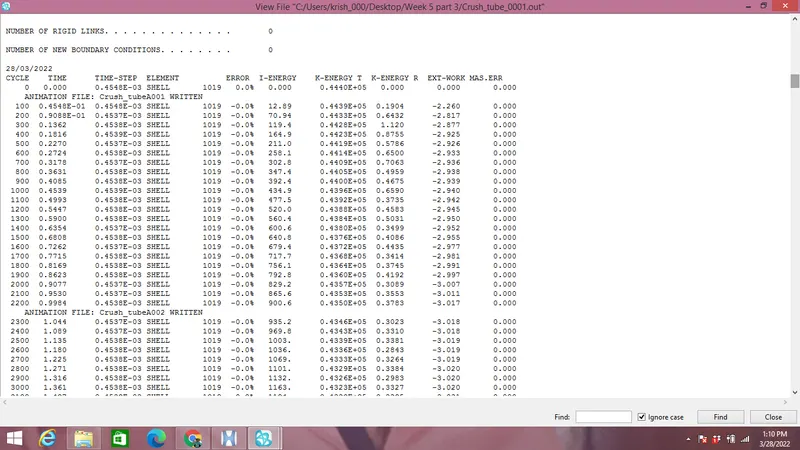
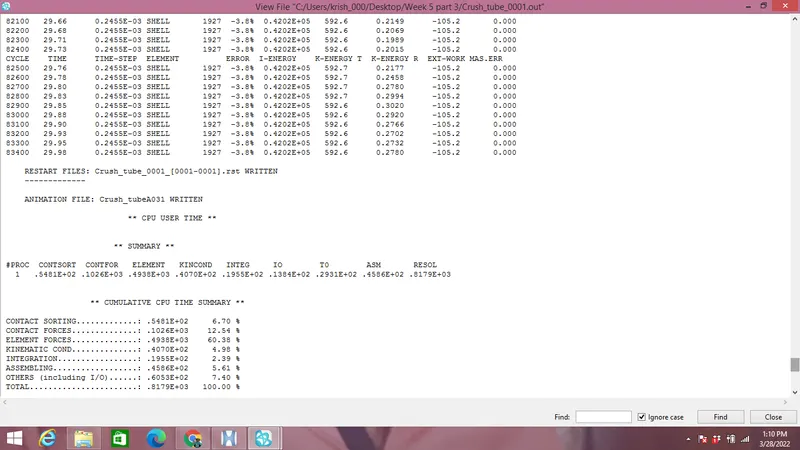
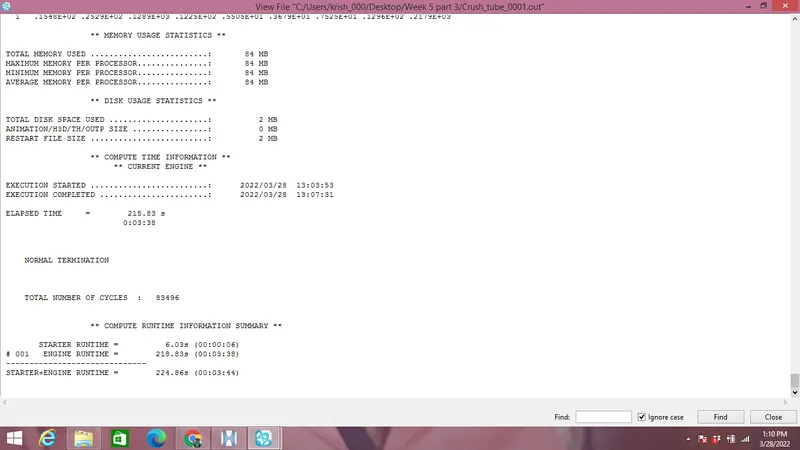
It can be observed from the image below that maximum energy error as -3.8% which is between -15% to 5% so acceptable and maximum mass error is 0 which is between 0 to 2% again acceptable.
- Go to Hyperview mode from hypermesh mode & select the .h3d file as shown in the image below & plot the Von Mises stress animation as shown in the image below:
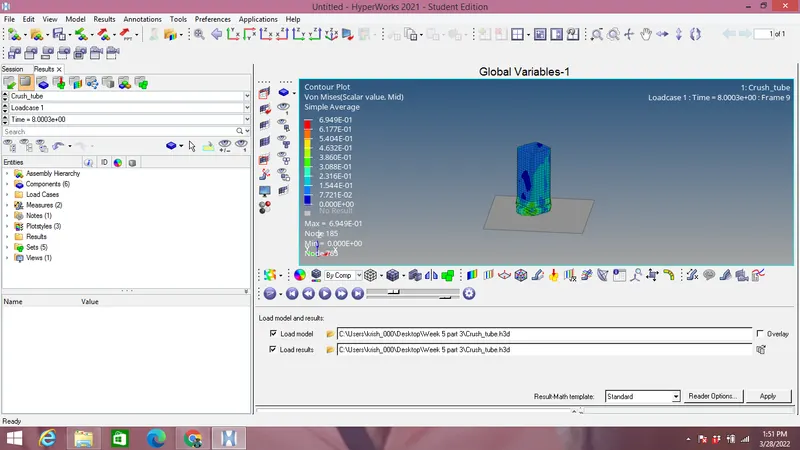
Maximum Von mises stress reached upto 0.694 MPa over the period of time.
From the images above we can see that stress starts at the notch region first then propogates from the middle notch to the bottom of crush tube.
- Now we have to switch from Hyperview to Hypergraph 2D mode and plot Internal,Kinetic & Contact energy as shown in the image below:
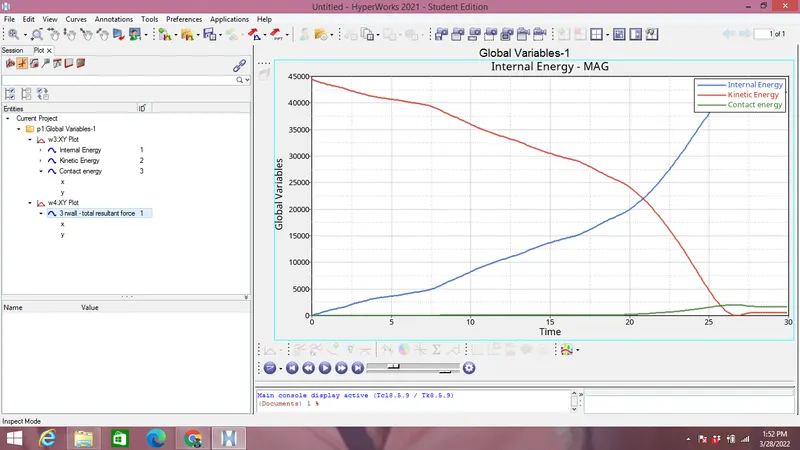
We can see from the image above that Kinetic energy is decreasing from start time to end time as displacement rate is reduced.
As we know that internal energy,there is no heat transfer to the system.So we have to consider work doen for calculating the internal energy. As displacement is increasing over a period of time so work doen is also increasing.
- Now we are plotting the Total resultant force at the Rigid wall as shown in the image below:
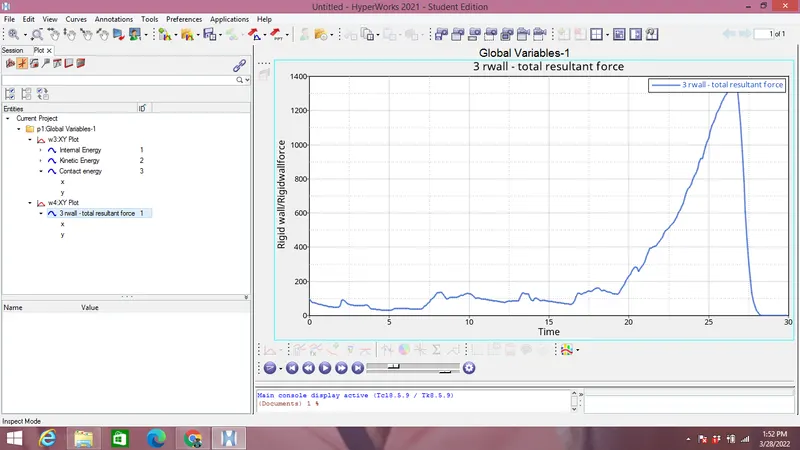
Intially rigid wall forces starts from the lower value because intially there is no contact between crush tube & rigid wall. The graph goes on increasing because elements are getting deformed & once rigid wall reached at peak entire crush tube collides with rigid wall.
case 4:
To run the model creating type 11 contact:
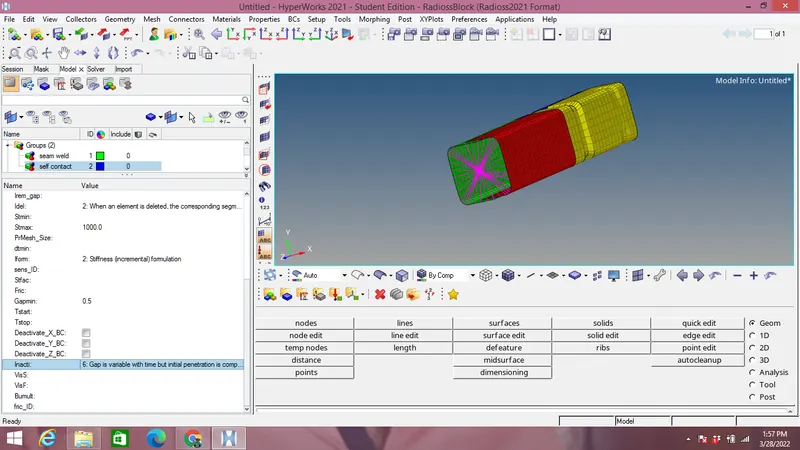
For this we are changing the interface card to type 11 with Inacti=6 and all other parameter as shown in the image below:
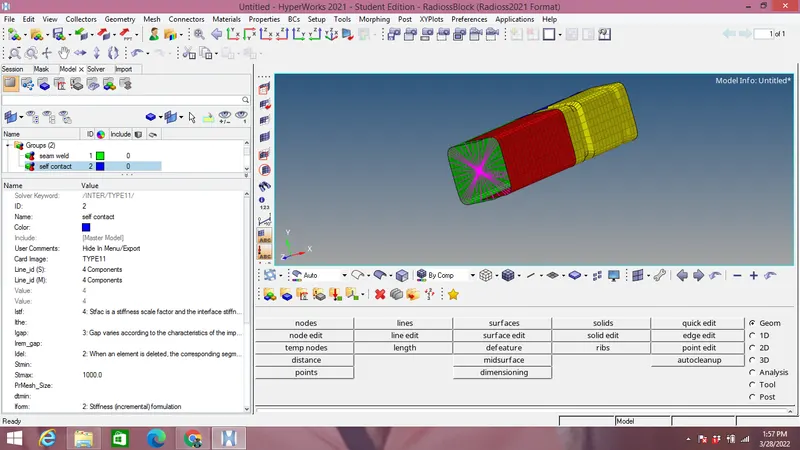
Now run the file like in case 2 and output files are obtained in the image below:
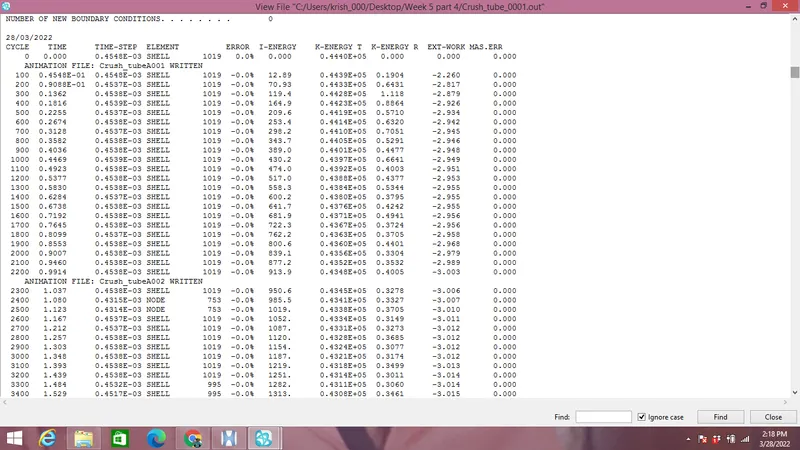
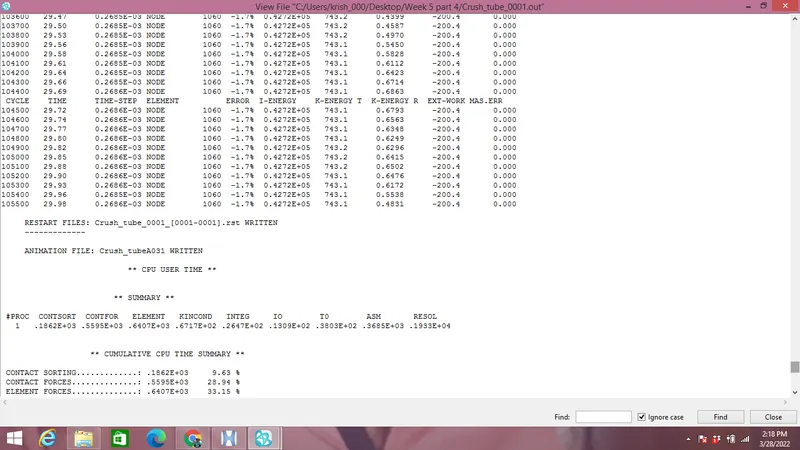
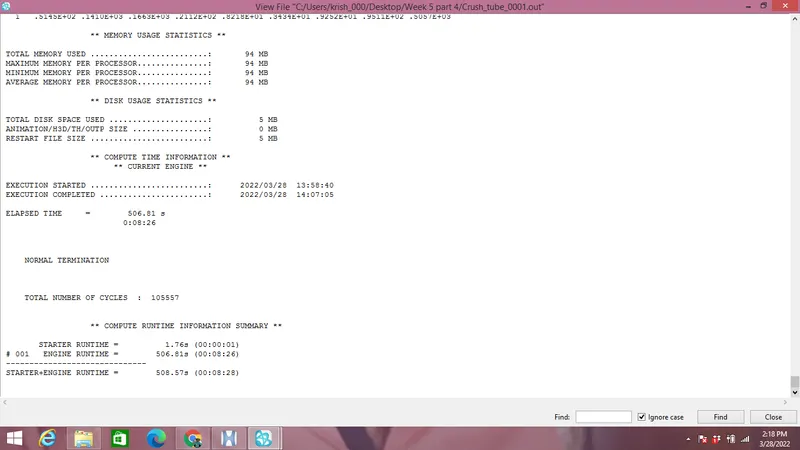
It can be observed from the image below that maximum energy error as -1.7% which is between -15% to 5% so acceptable and maximum mass error is 0 which is between 0 to 2% again acceptable.
- Go to Hyperview mode from hypermesh mode & select the .h3d file as shown in the image below & plot the Von Mises stress animation as shown in the image below:
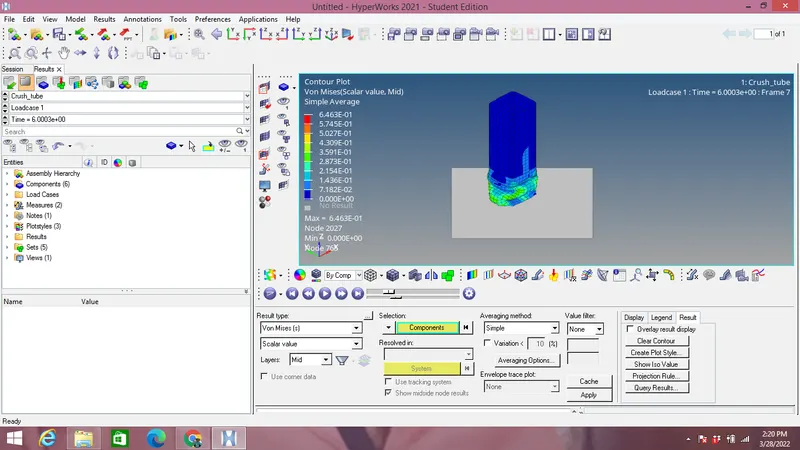
Maximum Von mises stress reached upto 0.6463 MPa over the period of time.
From the images above we can see that stress starts at the notch region first then propogates from the middle notch to the bottom of crush tube.
- Now we have to switch from Hyperview to Hypergraph 2D mode and plot Internal,Kinetic & Contact energy as shown in the image below:
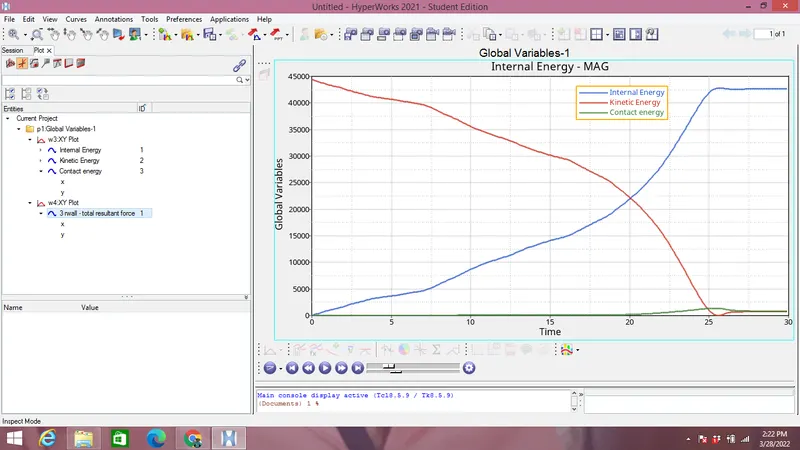
We can see from the image above that Kinetic energy is decreasing from start time to end time as displacement rate is reduced.
As we know that internal energy,there is no heat transfer to the system.So we have to consider work doen for calculating the internal energy. As displacement is increasing over a period of time so work doen is also increasing.
- Now we are plotting the Total resultant force at the Rigid wall as shown in the image below:
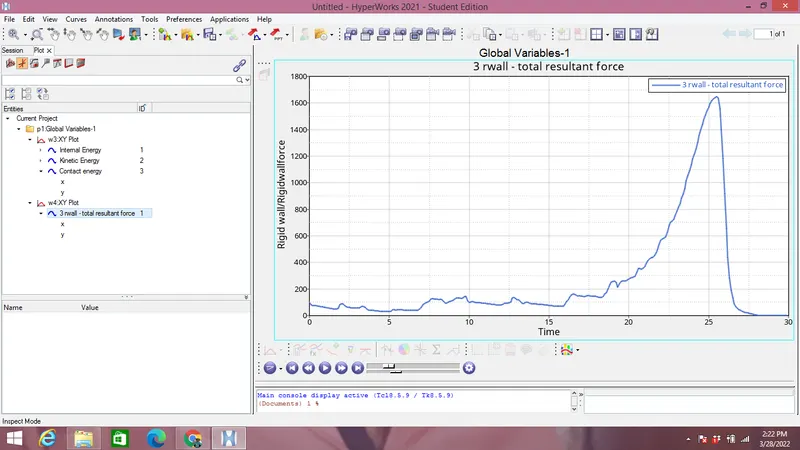
Intially rigid wall forces starts from the lower value because intially there is no contact between crush tube & rigid wall. The graph goes on increasing because elements are getting deformed & once rigid wall reached at peak entire crush tube collides with rigid wall.
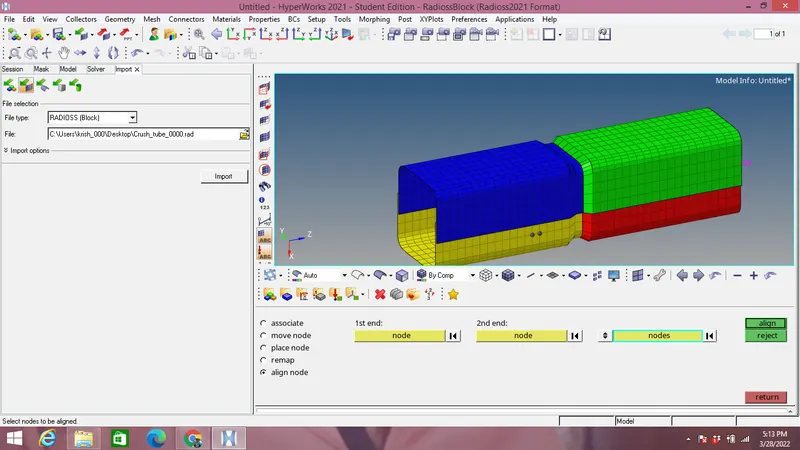
Case 5: To run the model by removing notches & boundary canditions on rigid bodies:
Import the file as above and to remove the notches go to Geometery-Node edit-Align node-Select the nodes to be modified as shown in the image below:
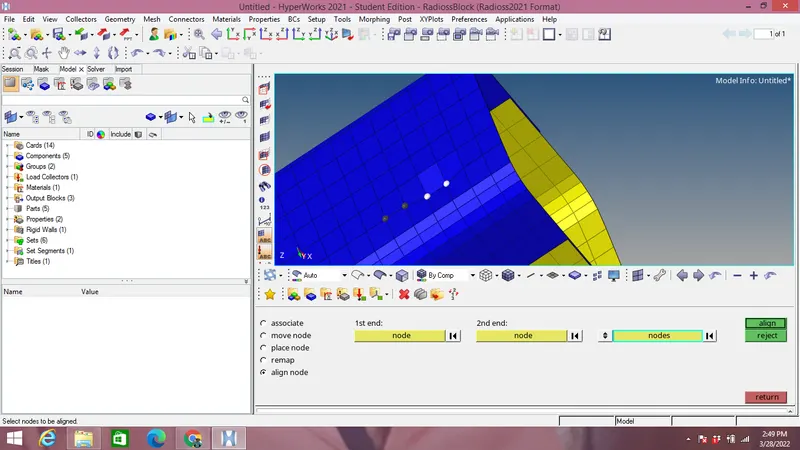
After notches are removed model looks like as shown below:
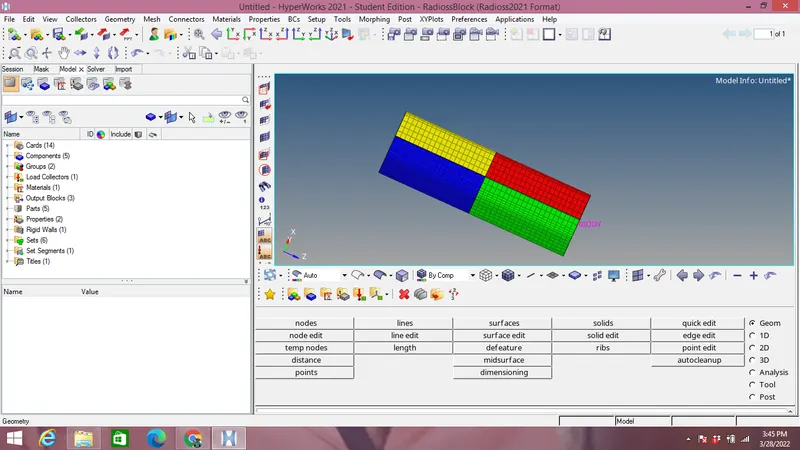
Next step is to remove the boundary canditions from solver browser as shown in the image below:
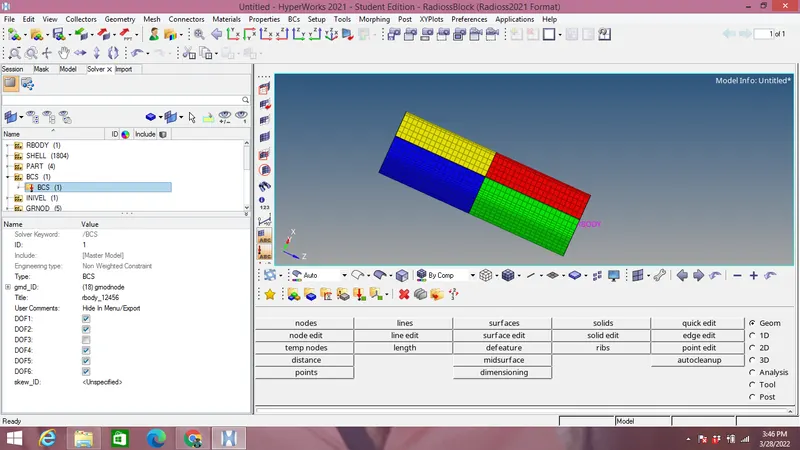
Now run the file like in case 2 and output files are obtained in the image below:
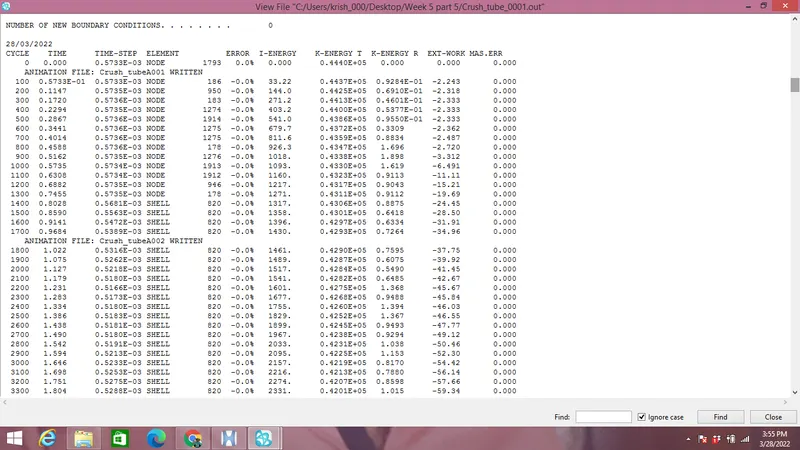
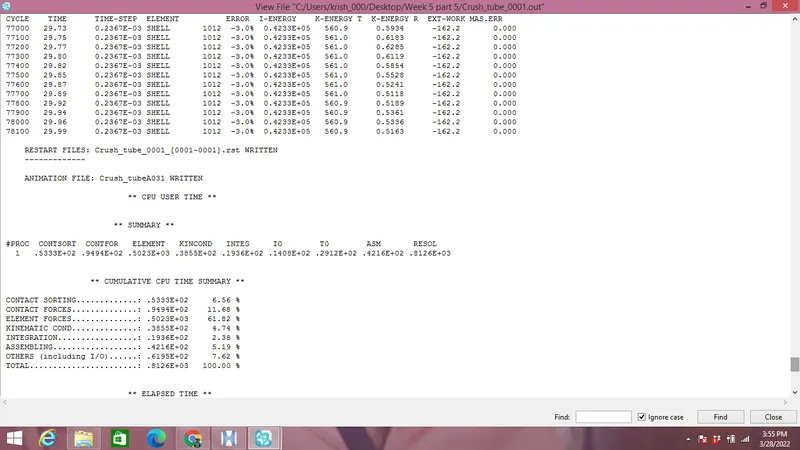
It can be observed from the image below that maximum energy error as -3% which is between -15% to 5% so acceptable and maximum mass error is 0 which is between 0 to 2% again acceptable.
- Go to Hyperview mode from hypermesh mode & select the .h3d file as shown in the image below & plot the Von Mises stress animation as shown in the image below:
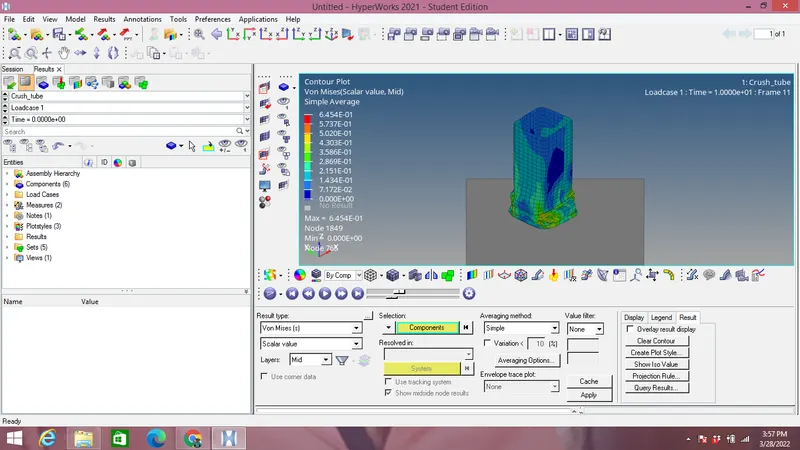
Maximum Von mises stress reached upto 0.6454 MPa over the period of time.
From the images above we can see that stress starts at the notch region first then propogates from the middle notch to the bottom of crush tube.
- Now we have to switch from Hyperview to Hypergraph 2D mode and plot Internal,Kinetic & Contact energy as shown in the image below:
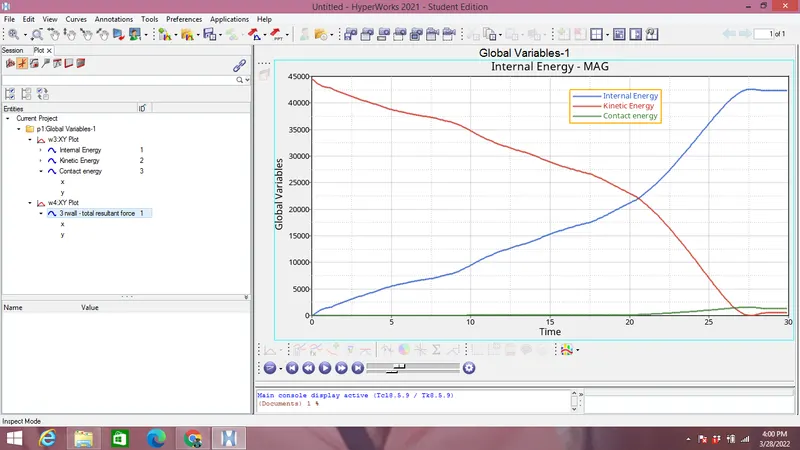
We can see from the image above that Kinetic energy is decreasing from start time to end time as displacement rate is reduced.
As we know that internal energy,there is no heat transfer to the system.So we have to consider work doen for calculating the internal energy. As displacement is increasing over a period of time so work doen is also increasing.
- Now we are plotting the Total resultant force at the Rigid wall as shown in the image below:
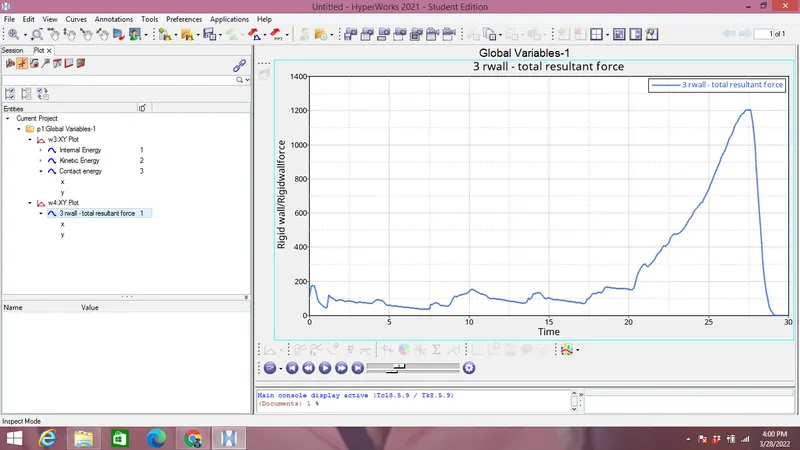
Intially rigid wall forces starts from the lower value because intially there is no contact between crush tube & rigid wall. The graph goes on increasing upto 1200 N because elements are getting deformed & once rigid wall reached at peak entire crush tube collides with rigid wall.
Case 6:
To run the node by creating notch at the middle & boundary candition on the middle node.
Import the file as above and to remove the notches go to Geometery-Node edit-Align node-Select the nodes to be modified as shown in case 5 and generate node in the middle as shown in the image below:
Now run the file like in case 2 and output files are obtained in the image below: 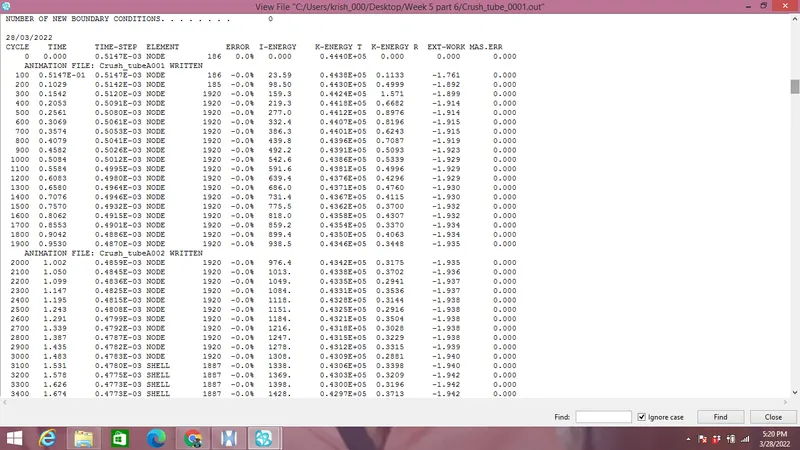
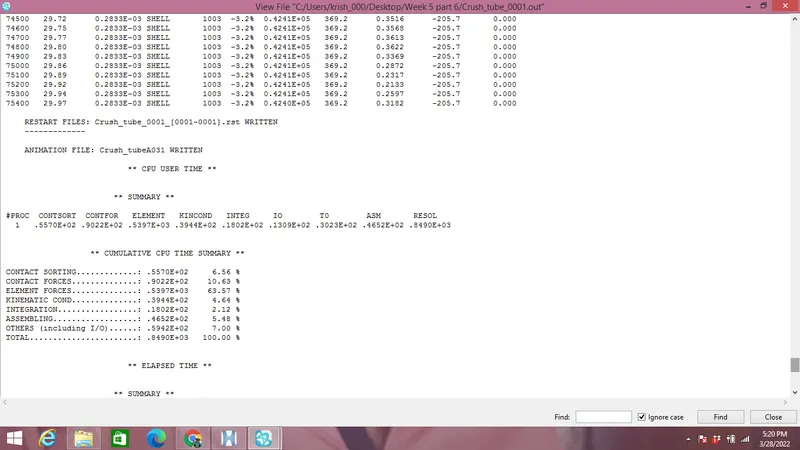
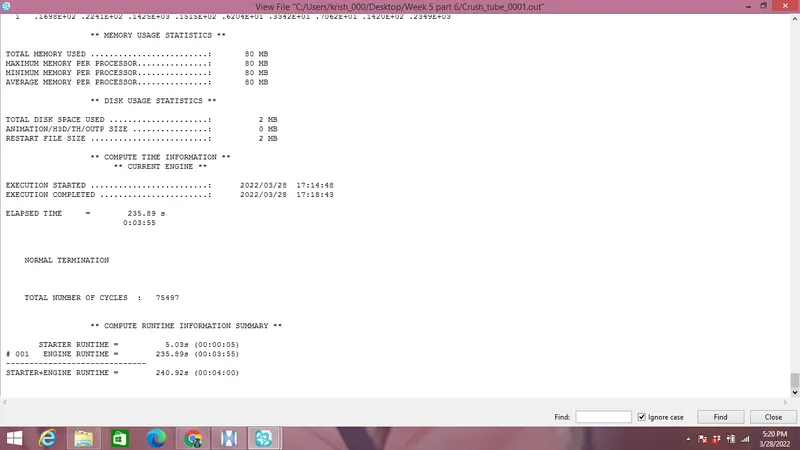
It can be observed from the image below that maximum energy error as -3.2% which is between -15% to 5% so acceptable and maximum mass error is 0 which is between 0 to 2% again acceptable.
- Go to Hyperview mode from hypermesh mode & select the .h3d file as shown in the image below & plot the Von Mises stress animation as shown in the image below:
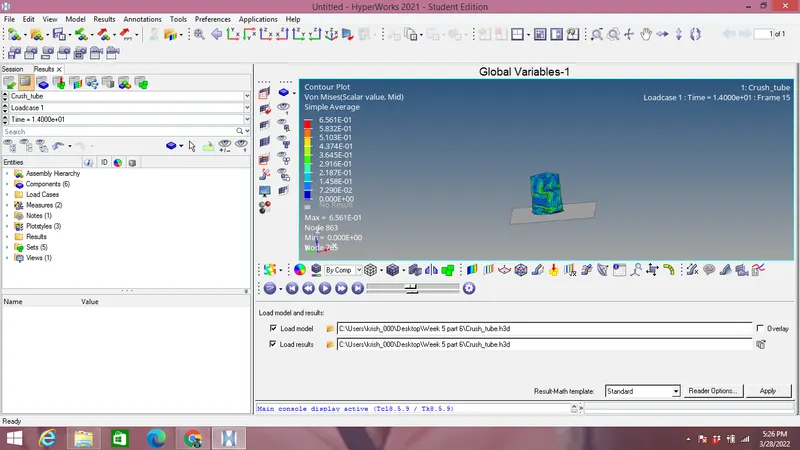
Maximum Von mises stress reached upto 0.6561 MPa over the period of time.
From the images above we can see that once notch region is shifted to middle then deformation start from middle first then propogates to the bottom of crush tube.
- Now we have to switch from Hyperview to Hypergraph 2D mode and plot Internal,Kinetic & Contact energy as shown in the image below:
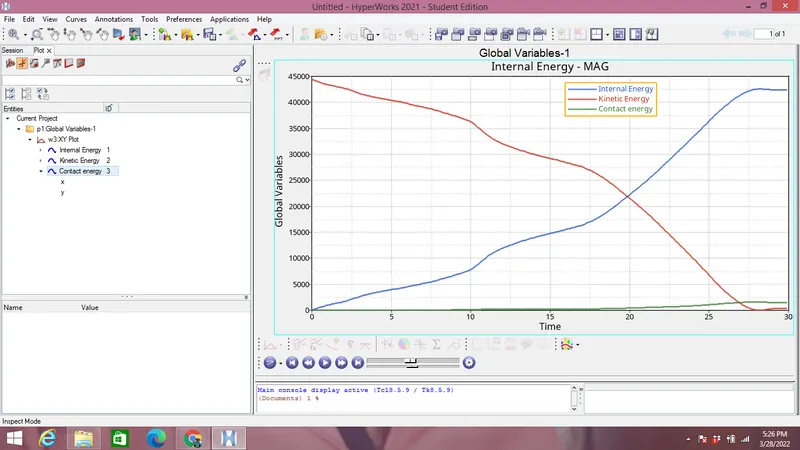
We can see from the image above that Kinetic energy is decreasing from start time to end time as displacement rate is reduced.
As we know that internal energy,there is no heat transfer to the system.So we have to consider work doen for calculating the internal energy. As displacement is increasing over a period of time so work doen is also increasing.
- Now we are plotting the Total resultant force at the Rigid wall as shown in the image below:
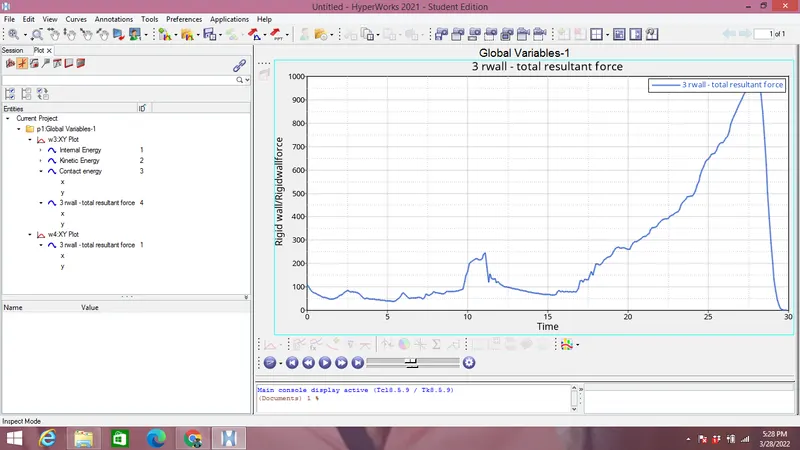
Intially rigid wall forces starts from the lower value because intially there is no contact between crush tube & rigid wall. The graph goes on increasing because elements are getting deformed & once rigid wall reached at peak entire crush tube collides with rigid wall.
Case 7: To create notch between opposite two faces & run:
In order to add notches between 2 opposing faces import the file as above and to remove the notches go to Geometery-Node edit-Align node-Select the nodes to be modified as shown in the image below between 2 opposite faces:
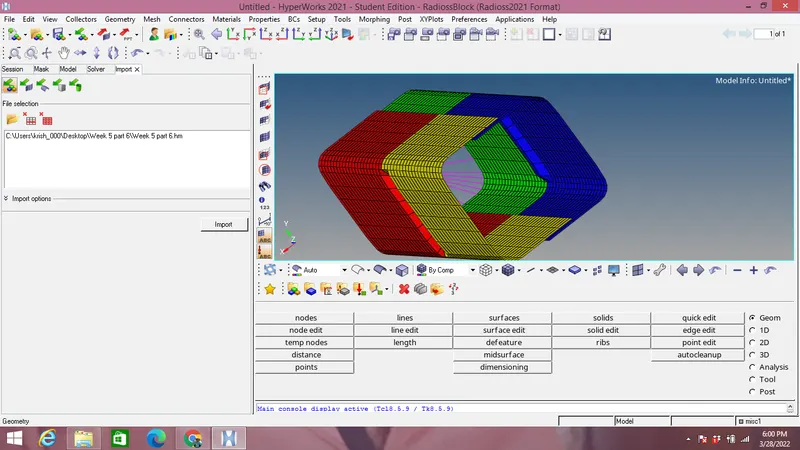
Now run the file like in case 2 under Analysis panel and output files are obtained in the image below:
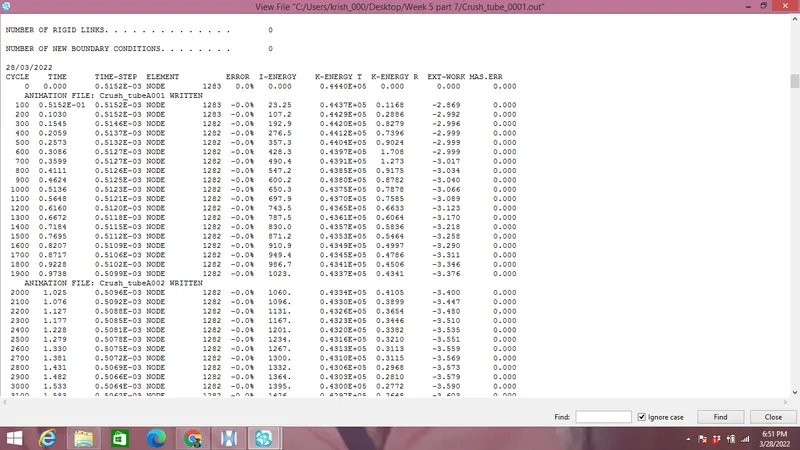
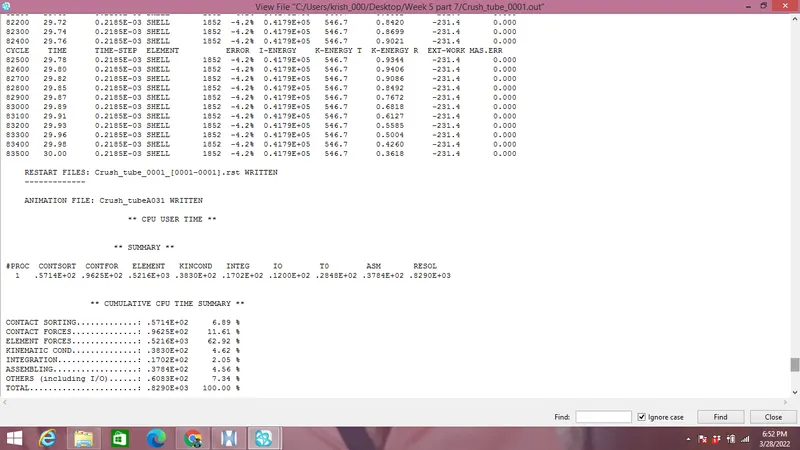
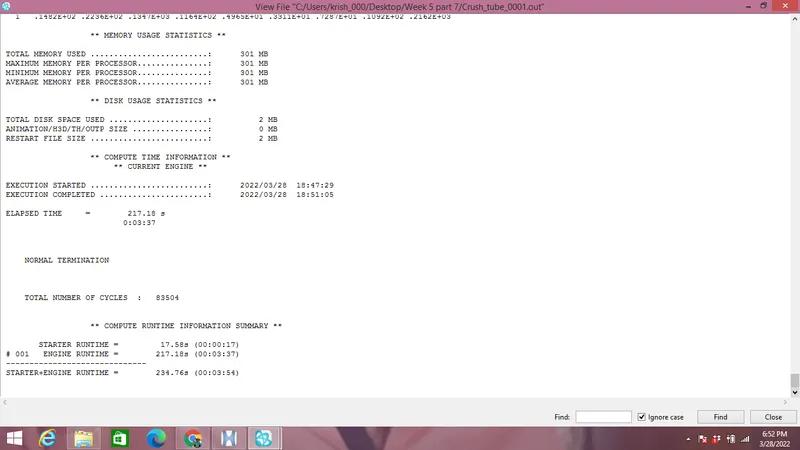
It can be observed from the image below that maximum energy error as -4.2% which is between -15% to 5% so acceptable and maximum mass error is 0 which is between 0 to 2% again acceptable.
- Go to Hyperview mode from hypermesh mode & select the .h3d file as shown in the image below & plot the Von Mises stress animation as shown in the image below:
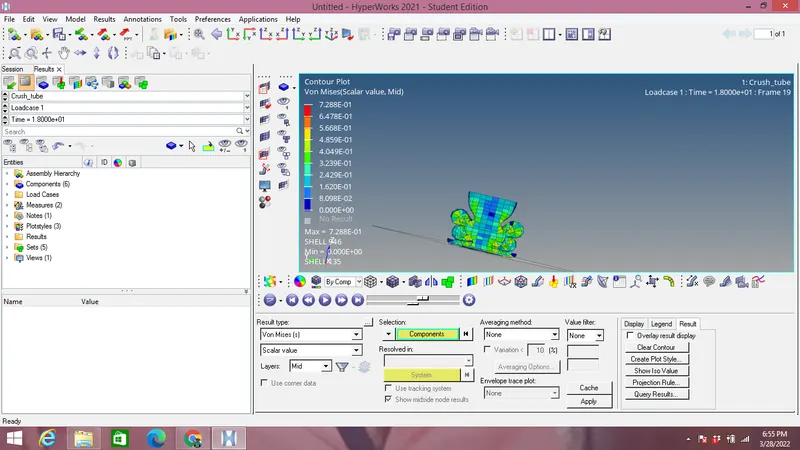
Maximum Von mises stress reached upto 0.7288 MPa over the period of time.
From the images above we can see that once notch region is shifted to middle then deformation start from middle region of crush tube.
- Now we have to switch from Hyperview to Hypergraph 2D mode and plot Internal,Kinetic & Contact energy as shown in the image below:
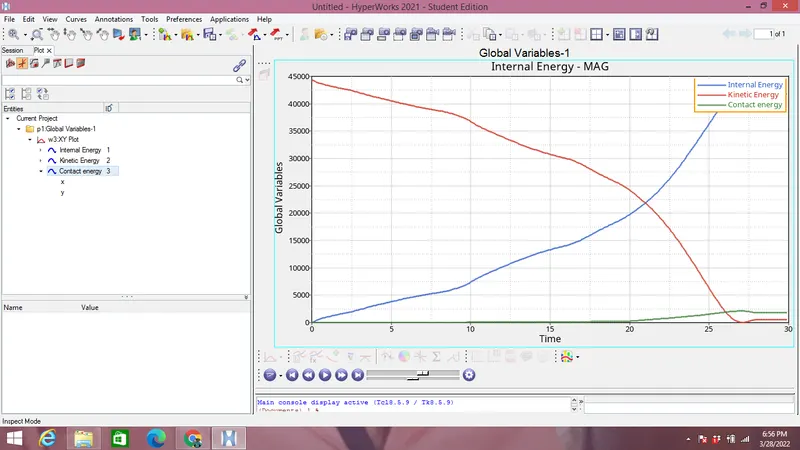
We can see from the image above that Kinetic energy is decreasing from start time to end time as displacement rate is reduced.
As we know that internal energy,there is no heat transfer to the system.So we have to consider work doen for calculating the internal energy. As displacement is increasing over a period of time so work doen is also increasing.
- Now we are plotting the Total resultant force at the Rigid wall as shown in the image below:
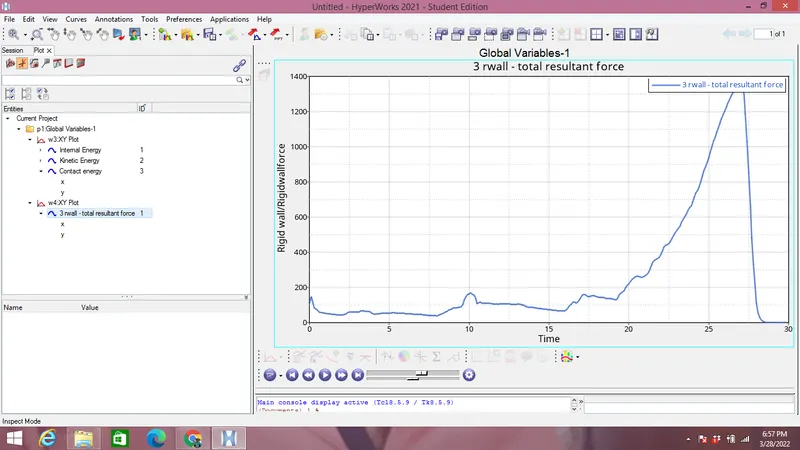
Intially rigid wall forces starts from the lower value because intially there is no contact between crush tube & rigid wall. The graph goes on increasing upto 1400 N because elements are getting deformed & once rigid wall reached at peak entire crush tube collides with rigid wall.
A notch is bascially a region where change in cross section area occurs of the component happens.In notch uneven stress distribution occurs with internal stress starts generating.
Comparision:
| Cases | 2 | 3 | 4 | 5 | 6 | 7 |
| Contact Interface | Type 7 | Type 7 | Type 11 | Type 7 | Type 7 | Type 7 |
| Change in model | No change | Inacti=6 | No change | Remove notches & Boundary canditions | Create a new notch in the middle | Create a new notch with nodes only from opposing 2 faces |
| Energy Error(%) | -3.8 | -3.8 | -1.7 | -3 | -3.2 | -4.2 |
| Maximum Stress(MPa) | 0.6949 | 0.6949 | 0.6463 | 0.6454 | 0.6561 | 0.7288 |
| No. of cycles | 83496 | 83496 | 105557 | 78155 | 75497 | 83504 |
| Rigid walls | 1400 | 1400 | 1680 | 1200 | 1000 | 1400 |
Conclusion:
- Meshing is doen on the Bumper model.
- Simulation has been doen for all the cases of crush tube.