Week 1 Stress Concentration on a Plate with hole
AIM:
To perform static structural analysis on two plates of the same dimensions but with a different numbers of holes and analyze the stress, deformation etc. acting on the plates.
Procedure followed:
Case 1:
1.)Design Plate A with a single hole.
2.)Meshing
Case 2:
1.)Design Plate B with 3 holes.
2.)Meshing
3.)Compare the simulation results.
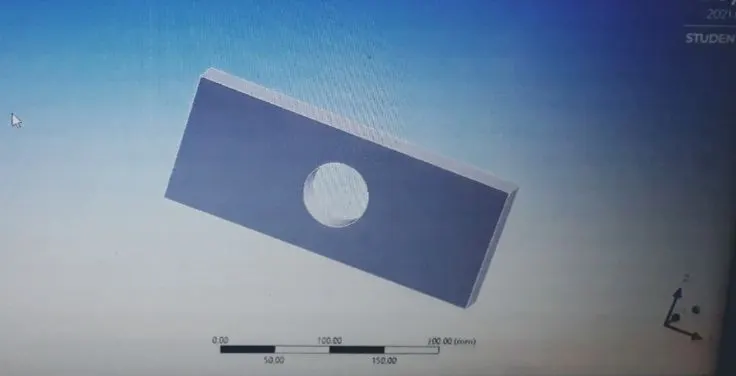
Designing of plates of structural steel with Ansys spaceclaim software.
The plate is modelled with the following dimensions of 300 mm length,120mm width & 30 mm thickness with 60 mm diameter hole with centre atbthe midpoint of lines of length & width.
Material specification:
| Density | 7.85e-006 kg mm-3 |
| Isotropic Secant Coefficient of Thermal Expansion | 1.2e-005 C-1 |
| Specific Heat Constant Pressure | 4.34e+005 mJ kg-1 C-1 |
| Isotropic Thermal Conductivity | 6.05e-002 W mm-1 C-1 |
| Isotropic Resistivity | 1.7e-004 ohm mm |
- Desiging of plate A with 1 hole:
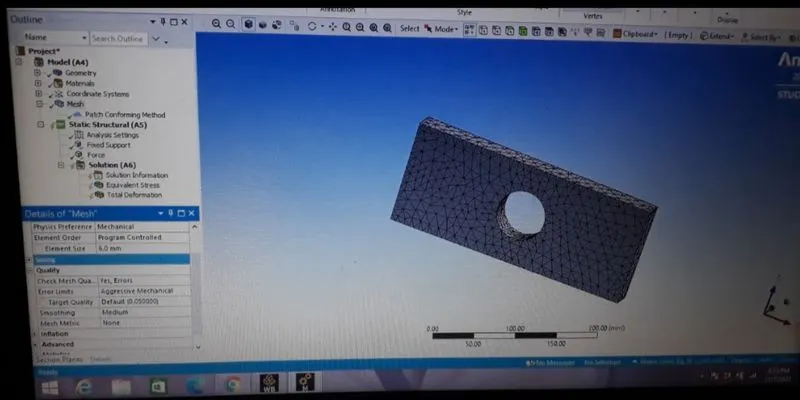
- Meshing of single hole plate:
- The plate is meshed with tetrahedron elements of 6mm size under Ansys Academic License.
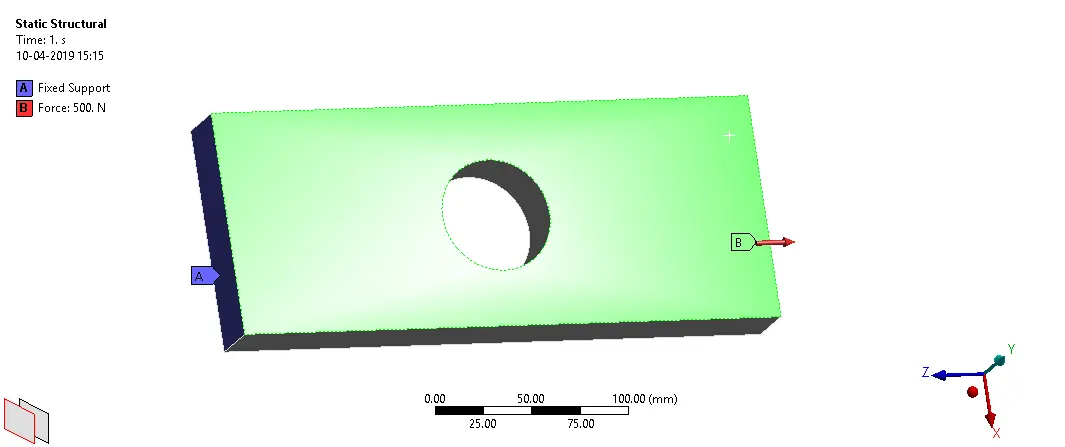
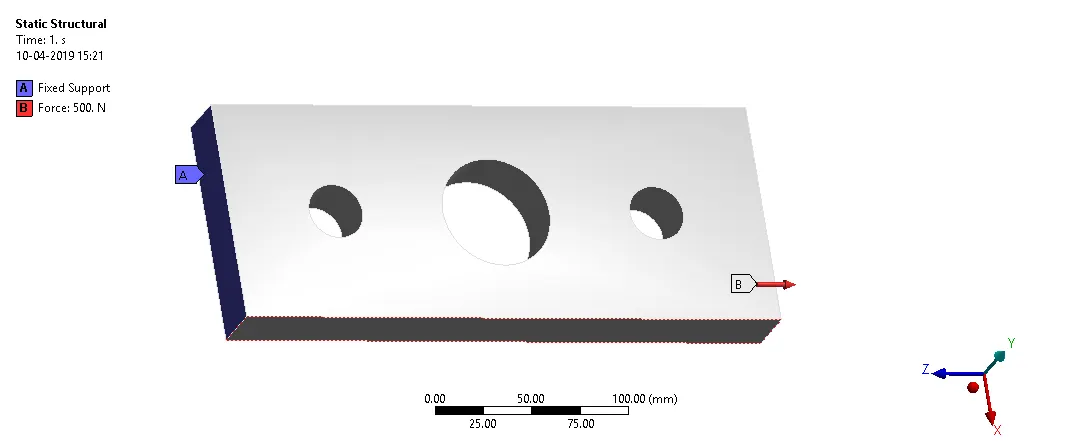
After the model is meshed, the loads are applied on the model. A fixed support is given on one side while a tensile load of 500 N is given on the other. The loads are as shown in the image below:
The solutions are applied & at the end Von mises stress applied with total deformation.
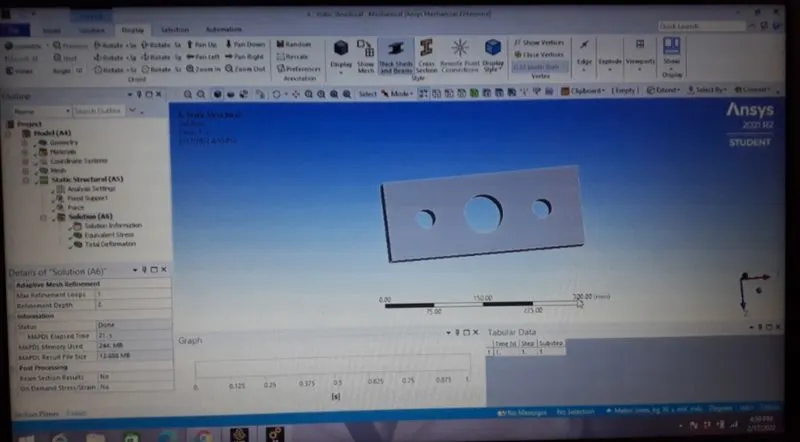
Desiging of plates B with 3 holes one at the centre of 60 mm diameter & other two at 90 mm from centre with 30 mm diameter with Ansys spaceclaim:
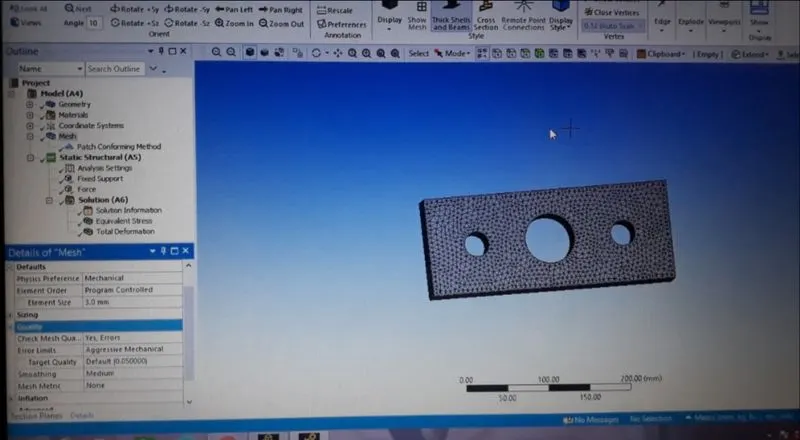
- Meshing of 3 hole plate B:
- The plate is meshed with tetrahedron elements of 3mm size under Ansys Academic License.
- After meshing plate B is fixed at one end & at the other end 500N tensile force is applied.
Results obtained:
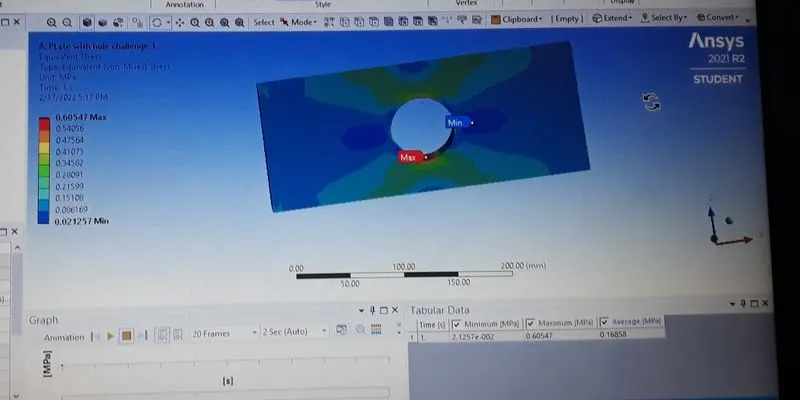
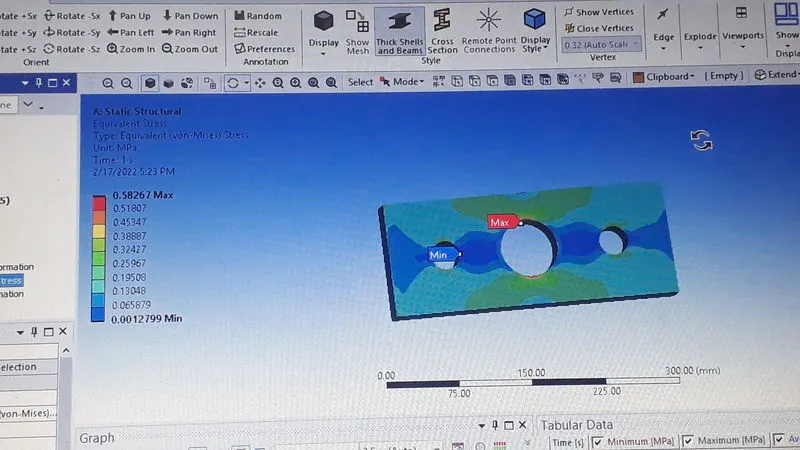
The Equivalent stress for the two cases are compared.
| Time [s] | Minimum [MPa] | Maximum [MPa] | Average [MPa] |
| 1. | 2.1257e-002 | 0.60547 | 0.16858 |
| 2. | 1.2799e-003 | 0.58267 | 0.16807 |
The Equivalent stress comparision is plotted below:
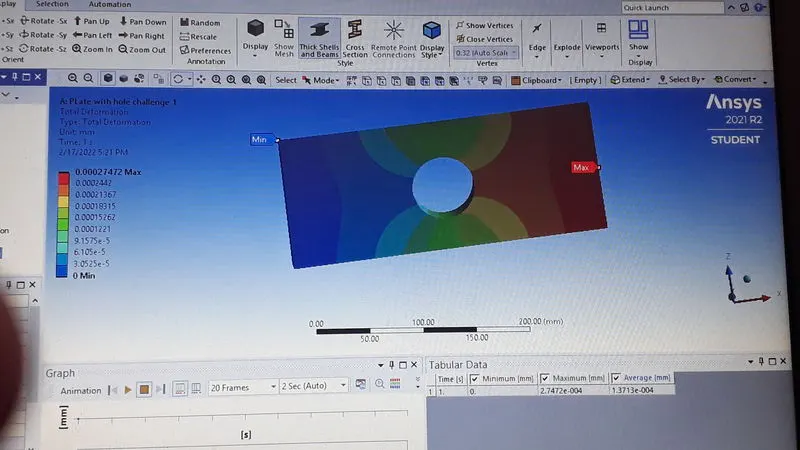
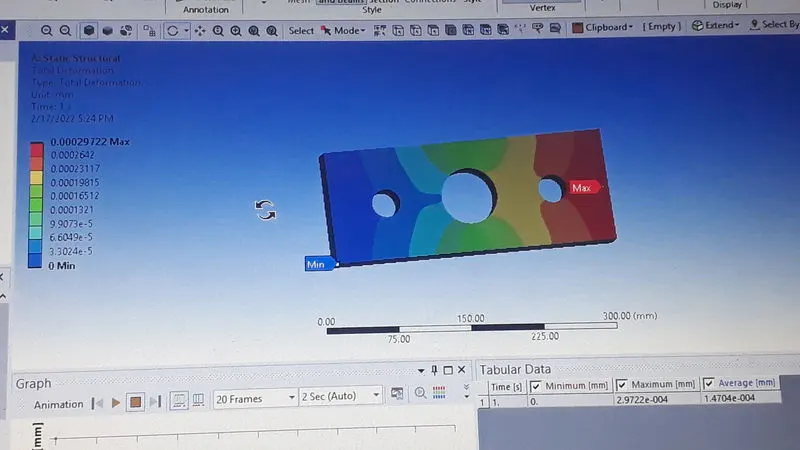
The Total Deformation for the two cases are compared below.
| Time [s] | Minimum [mm] | Maximum [mm] | Average [mm] |
| 1. | 0. | 2.7472e-004 | 1.3713e-004 |
| 2. | 0. | 2.9722e-004 | 1.4704e-004 |
Total deformation comparision of plate A & B is plotted below:
Conclusion:
Analysis was doen keeping into account nodes & elements as per Ansys Academic License.
In plate B due to presence of 3 holes lesser material present so low size element of 3 mm used during meshing so we get more accurate result for plate B compared to plate A.From analysis standpoint plate B is more close to accuracy than plate A.
On comparison of the Total Deformation experienced by the model A having only a slight difference in the average value is evident of the order of 0.0991mm with Case 2 having a higher value. Maximum deformation in the two models has a difference of the order of 0.225mm.
On comparison of the Equivalent stress experienced by the model in the A having a difference of 0.00051 MPa is evident in the average value of equivalent stress. But the tension force experienced in case 2 is lesser than than Case 1.
From the manufacturing point of view of the component in case 1 involves lesser drilling than Case 2. This means lesser work involved whereas in Case 2, lesser material is used. So from manufacturing point of view design 1 is to be selected.