Assignment 4-RADIOSS Material Laws Challenge
RADIOSS Material Laws Challenge:
Aim: To apply different material types to the simulation model & compare the behaviour of model with different element and failure formulations.
Steps followed:
Case 1:
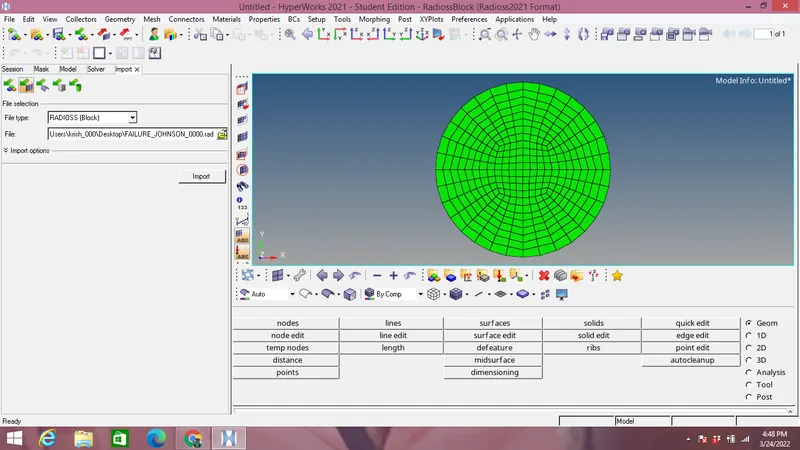
- Import the provided 0000 .rad file in Solver deck as shown in the image below:
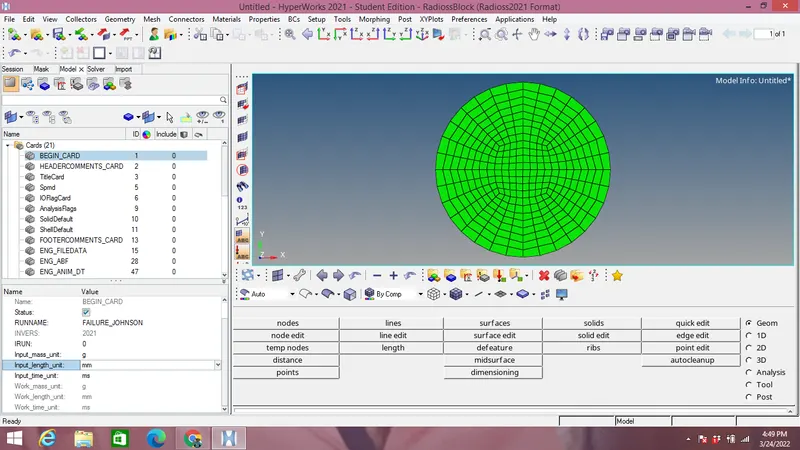
- Check the units under Card panel Begin Card option as shown in the image below:
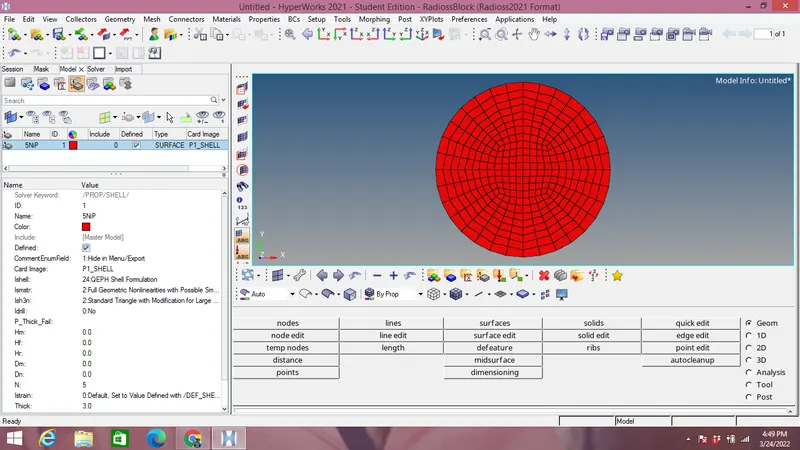
- Properties of shell are changed to recommended properties as shown in the image below:
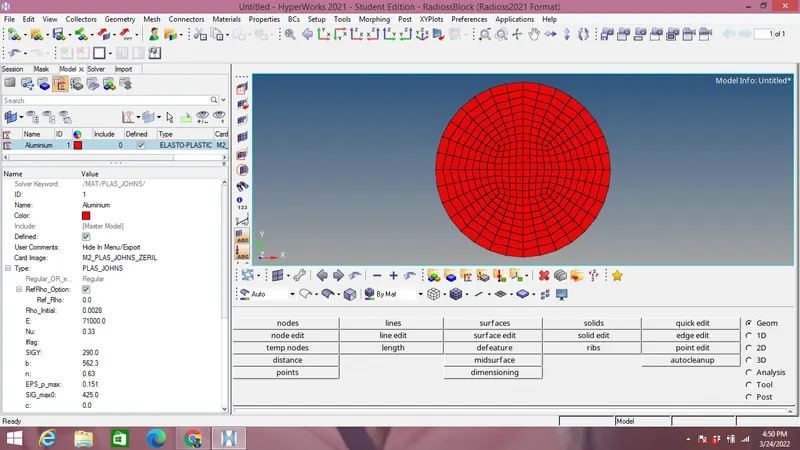
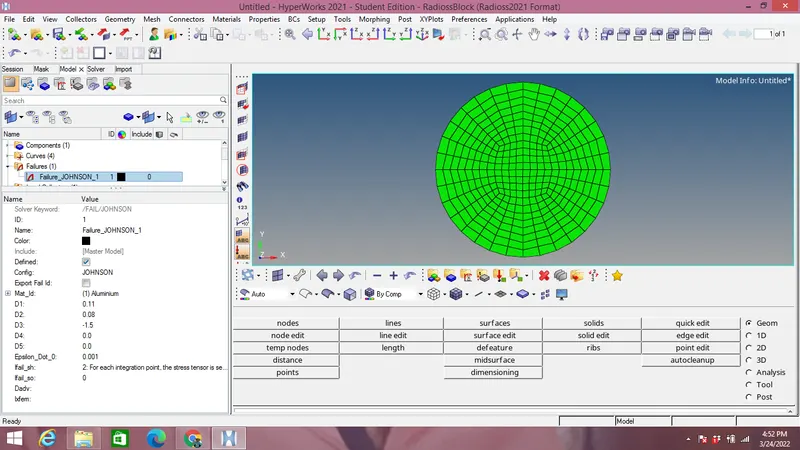
- Material card selected for Aluminium was M2 Plastic Johnson & failure cards are kept as shown in the image below:
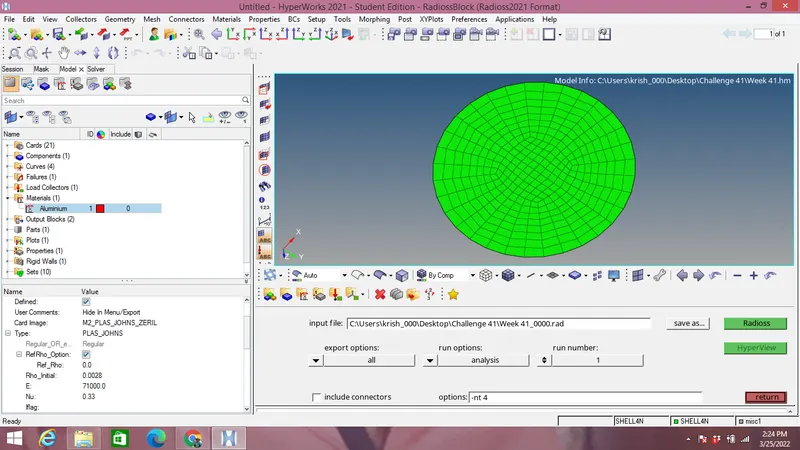
- Under Analysis panel we are selecting Radioss option under which we are exporting 0000.rad file & saving it to a particular location before clicking on radioss buttton as shown in the image below:
- 0001.rad file at the end of simulation is shown with Energy & mass errors under acceptable range as shown in the image below:
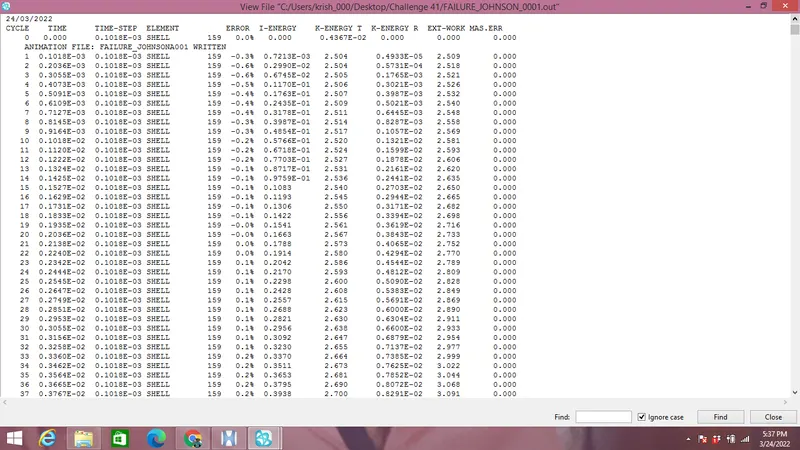
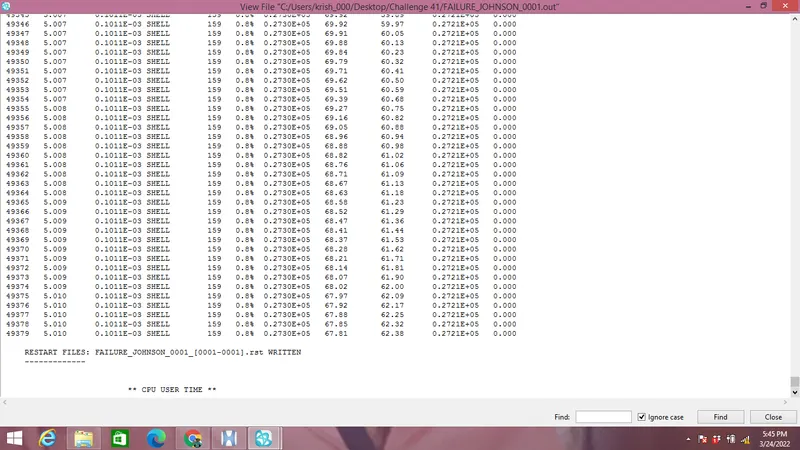
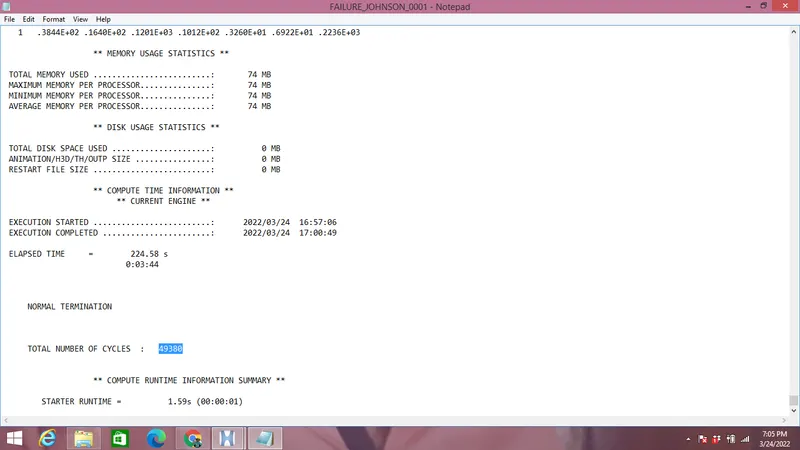
- Energy error is 0.8% while mass error is 0 thus both are in acceptable range with total number of cycles as 49180 at the end of 5ms as observed from the image above.
- Energy graphs of Internal,Kinetic,Total & Hourglass energy are shown in the image below:
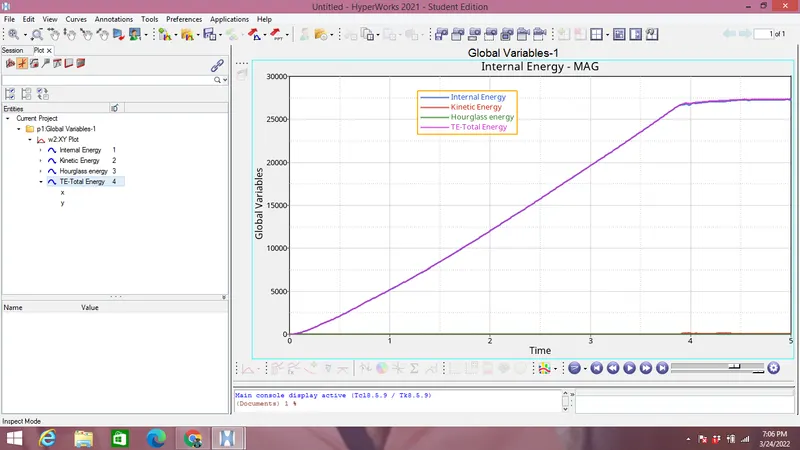
No hourglass energy is observed from the image above, Internal energy is increasing with time because elements are absorbing kinetic energy.
- Plastic strain contour simulations is shown in the image below in hyperview format by selecting proper .h3d files generated during simulation:
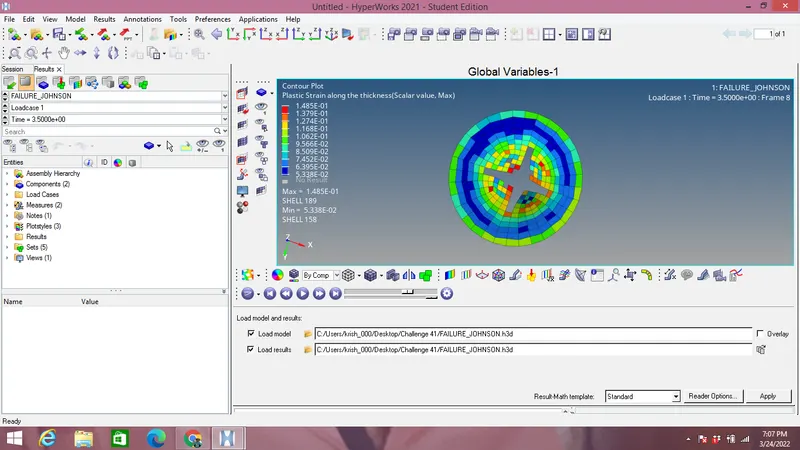
In the image above it can be seen that elements are deleted when they reach 15% of plastic strain value after yield stress values.
- Von mises Stress plot is shown in the image below in hyperview format by selecting proper .h3d files generated during simulation:
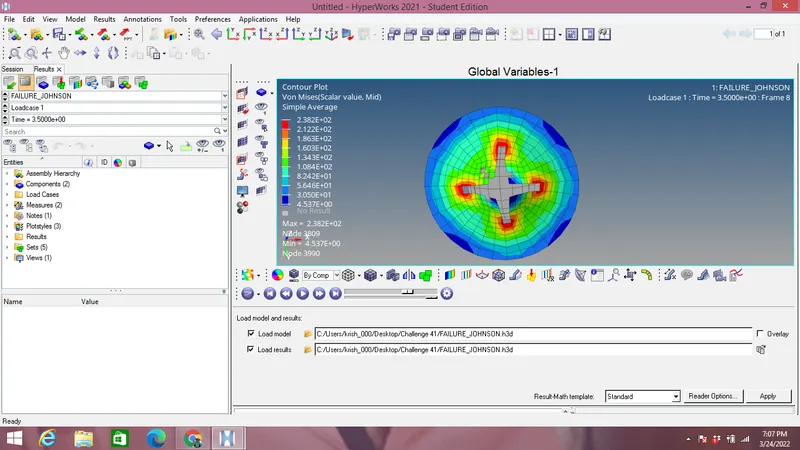
Here also elements are deleted when they reach 15 % of plastic strain after yield stress of 290 MPa, maximum stress in the simulation is 238.2 MPa.
The elements break because Johnson-Cook failure card is applied to Aluminum material, which takes both tensile & compressive failures into account, when the elements reaches Eps_p_max value which is 0.151 by default here, they are deleted during simulation.
Case 2:
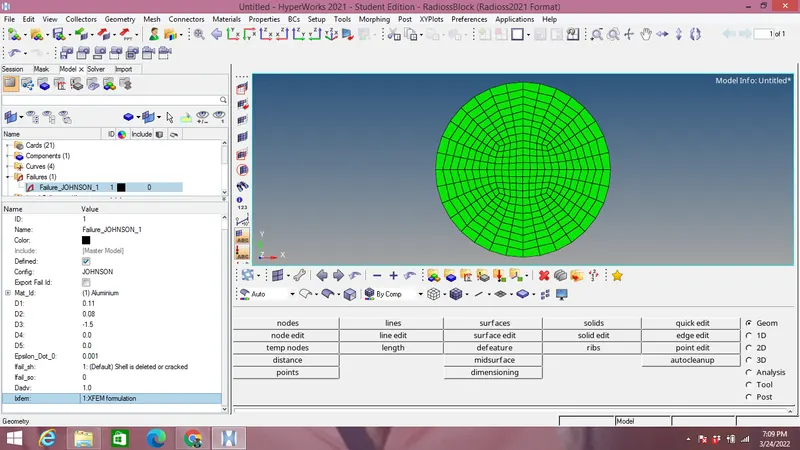
- Failure cards are edited as per question with Ifail_sh(Shell failure flag feature) set to 1 in order to generate crack in the shell element when Ixfem is set to 1 & Dadv is set to 1.0 which is criteria for crack advancement as shown in the image below:
- Under Analysis panel we are selecting Radioss option under which we are exporting 0000.rad file & saving it to a particular location before clicking on radioss buttton as shown in Case 1.
- 0001.rad file at the end of simulation is shown with Energy & mass errors under acceptable range as shown in the image below:
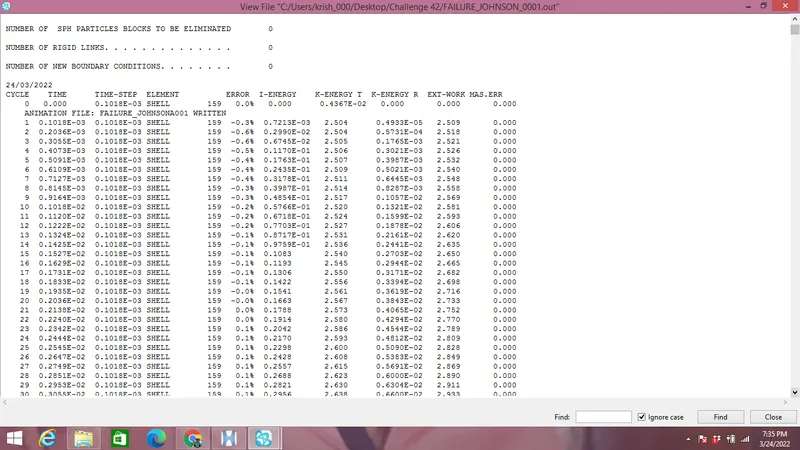
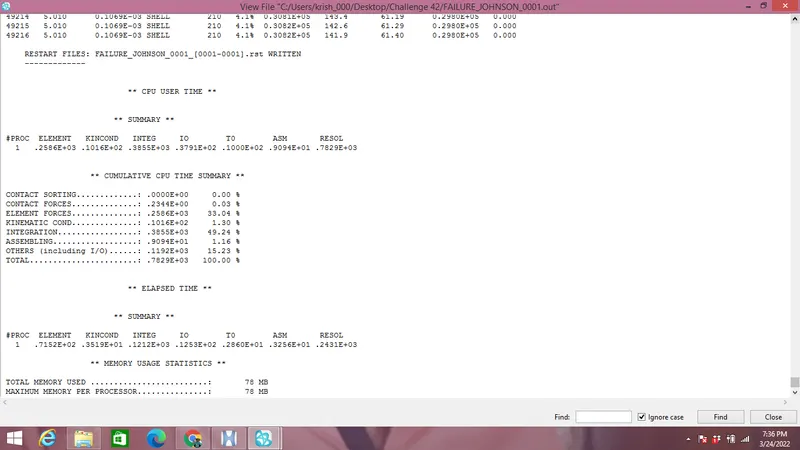
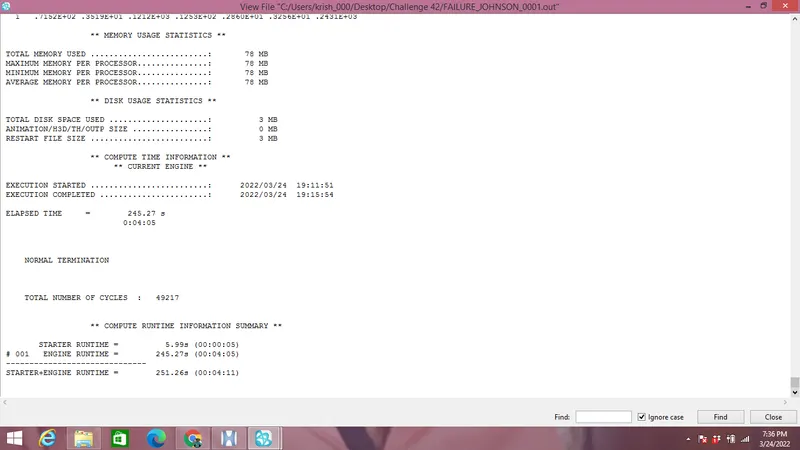
- Energy error is 4.1% while mass error is 0 thus both are in acceptable range with total number of cycles as 49217 at the end of 5ms as observed from the image above.
- Energy graphs of Internal,Kinetic,Total & Hourglass energy are shown in the image below:
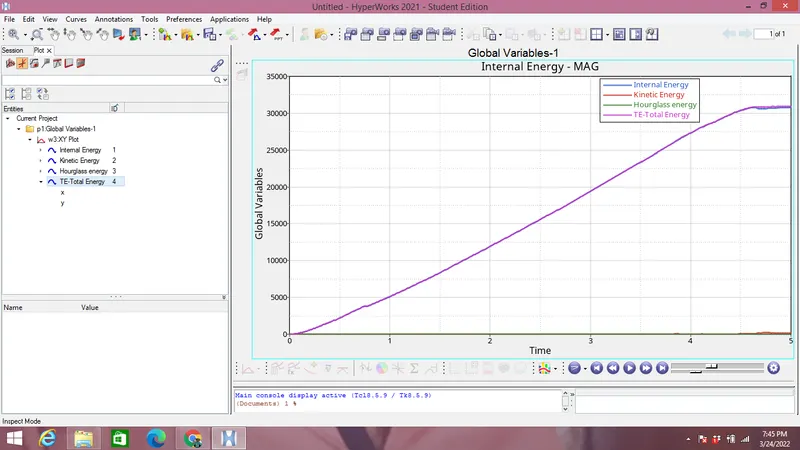
No hourglass energy is observed from the image above, Internal energy is increasing with time because elements are absorbing kinetic energy.
- Plastic strain contour simulations is shown in the image below in hyperview format by selecting proper .h3d files generated during simulation:
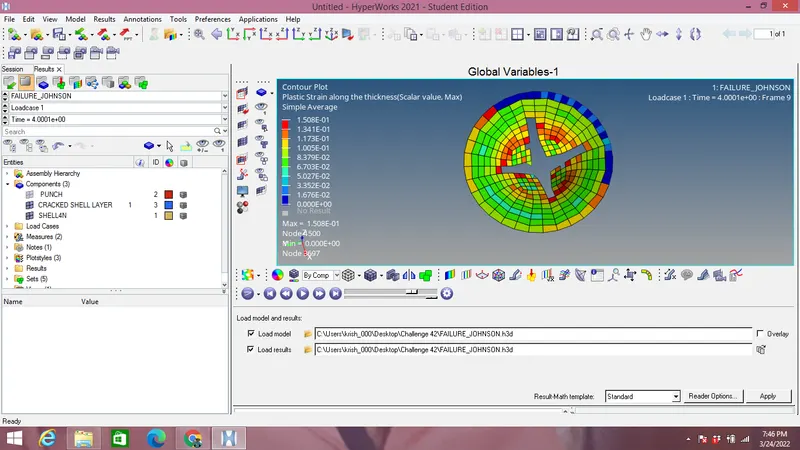
In the image above it can be seen that elements are deleted when they reach 15% of plastic strain value after yield stress values.
- Von mises Stress plot is shown in the image below in hyperview format by selecting proper .h3d files generated during simulation:
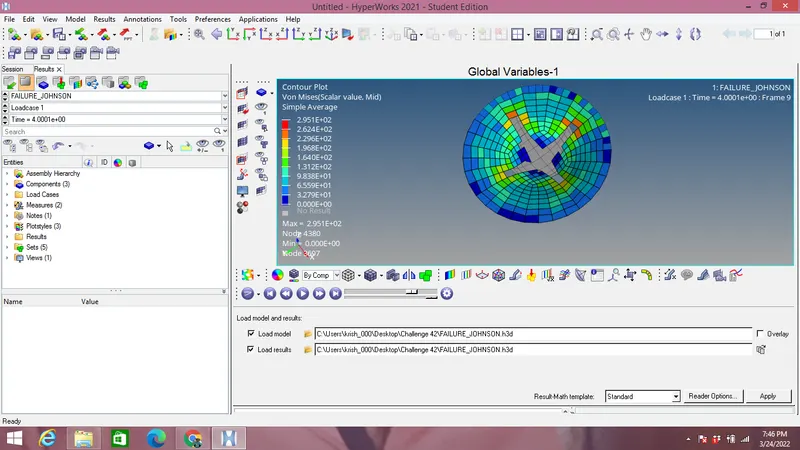
Here also elements are deleted when they reach 15 % of plastic strain after yield stress of 290 MPa, maximum stress in the simulation is 295.1 MPa, which is higher than case 1 & crack devlopment can be seen during simulation with crack advancement maximum value being 1 & Ifail_sh is activated for all shell elements.The elements break because Johnson-Cook failure card is applied to Aluminum material, which takes both tensile & compressive failures into account, when the elements reaches Eps_p_max value which is 0.151 by default here, they are deleted during simulation.
Case 3:
- Failure card is deleted from the Assembly panel.
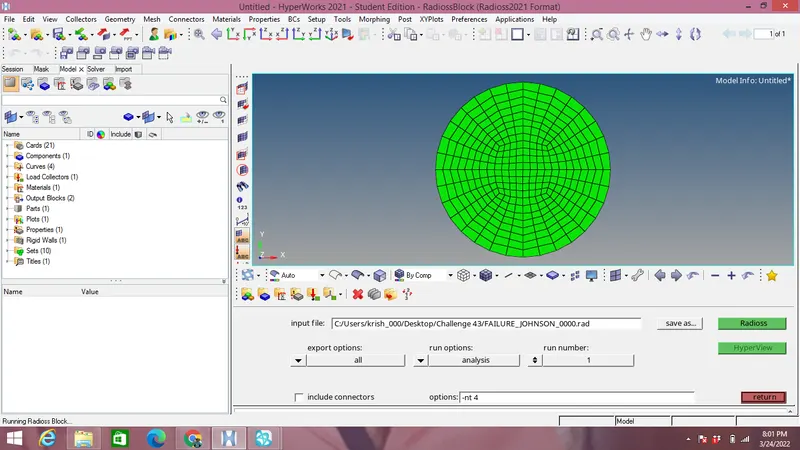
- Under Analysis panel we are selecting Radioss option under which we are exporting 0000.rad file & saving it to a particular location before clicking on radioss buttton as shown in Case 1.
- 0001.rad file at the end of simulation is shown with Energy & mass errors under acceptable range as shown in the image below:
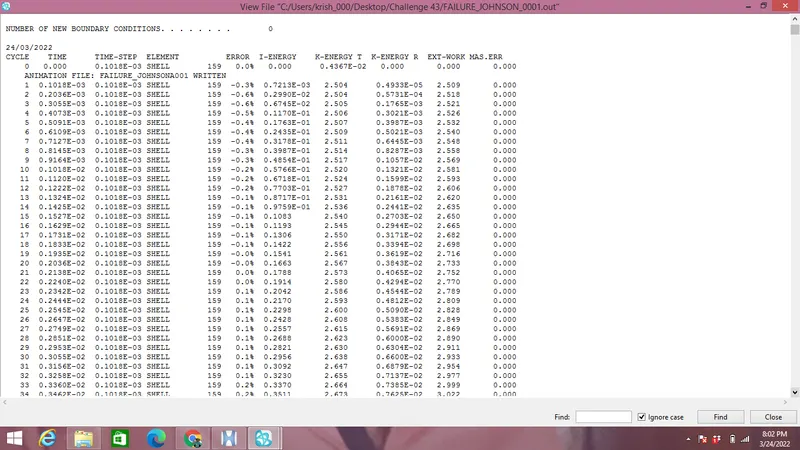
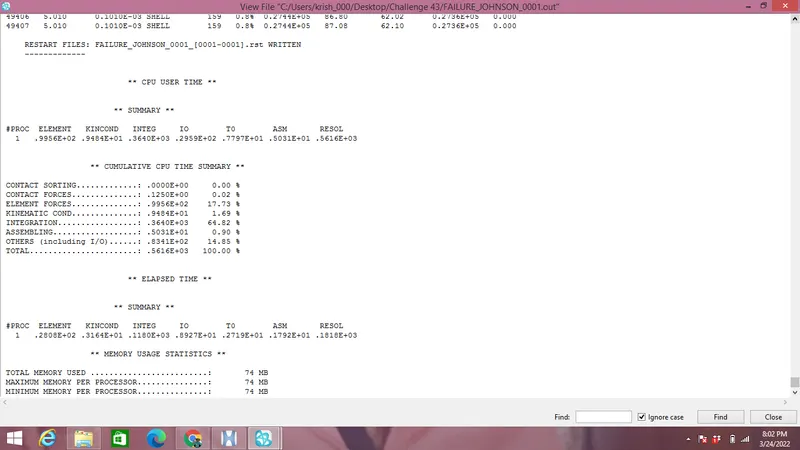
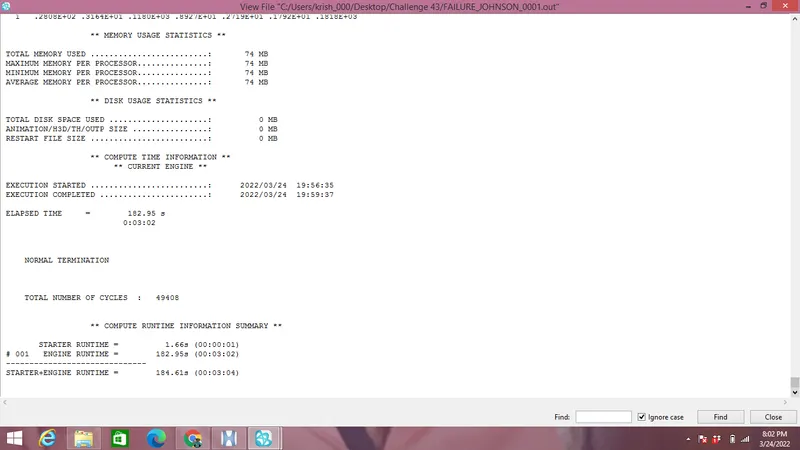
- Energy error is 0.8% while mass error is 0 thus both are in acceptable range with total number of cycles as 49408 at the end of 5ms as observed from the image above.
- Energy graphs of Internal,Kinetic,Total & Hourglass energy are shown in the image below:
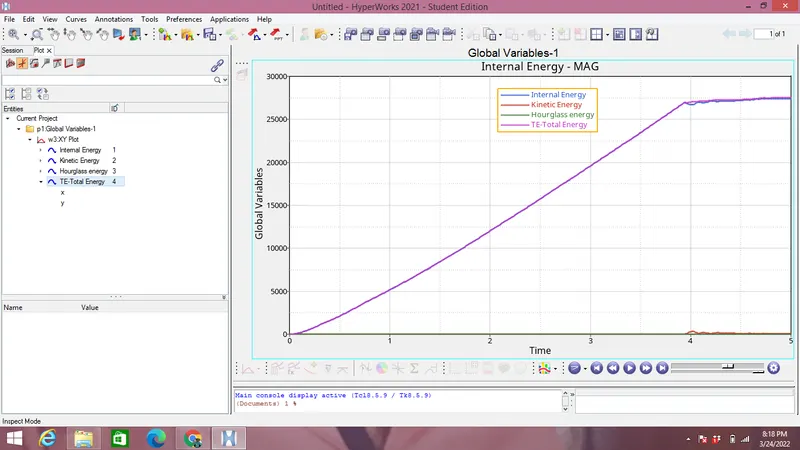
No hourglass energy is observed from the image above, Internal energy is increasing with time because elements are absorbing kinetic energy.
- Plastic strain contour simulations is shown in the image below in hyperview format by selecting proper .h3d files generated during simulation:
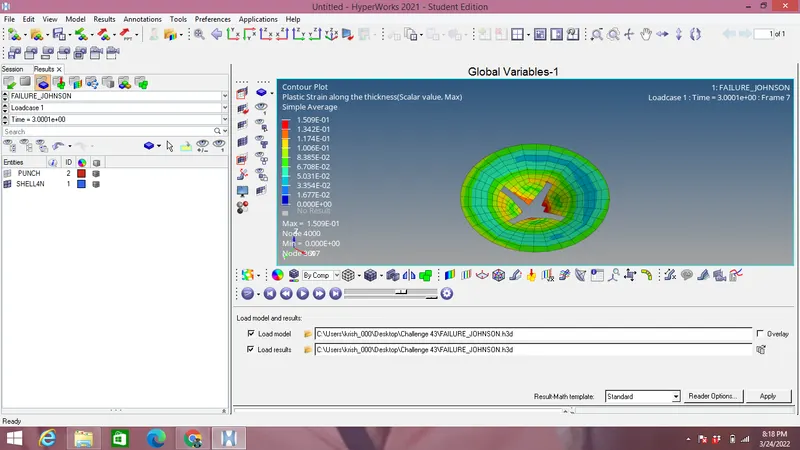
In the image above it can be seen that elements are deleted when they reach 15% of plastic strain value after yield stress values.
- Von mises Stress plot is shown in the image below in hyperview format by selecting proper .h3d files generated during simulation:
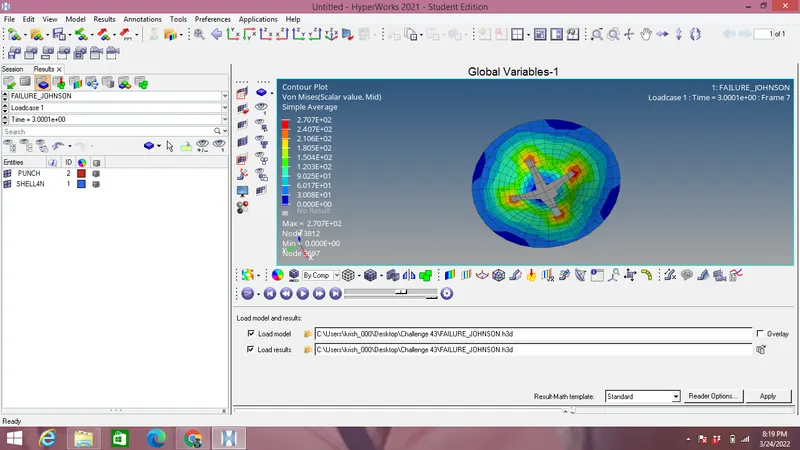
The maximum Von mises stress observed from the image above is 270.7MPa without any crack.
Case 4:
- Running the model with Eps_p_max=0 as shown in the image below:
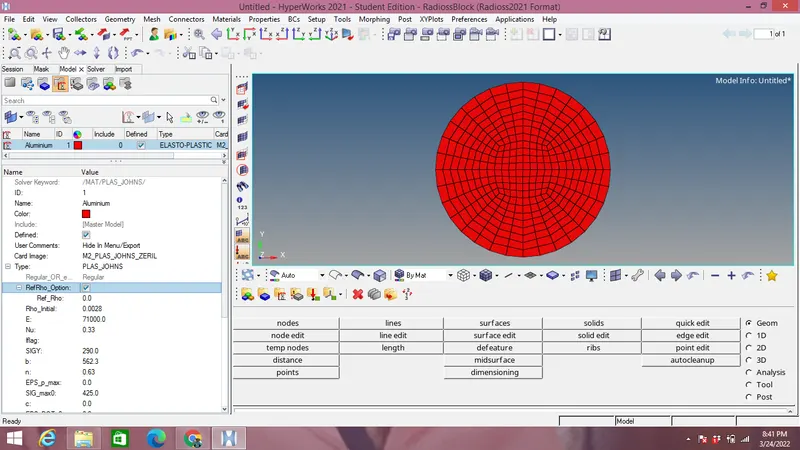
- Under Analysis panel we are selecting Radioss option under which we are exporting 0000.rad file & saving it to a particular location before clicking on radioss buttton as shown in Case 1.
- 0001.rad file at the end of simulation is shown with Energy & mass errors under acceptable range as shown in the image below:
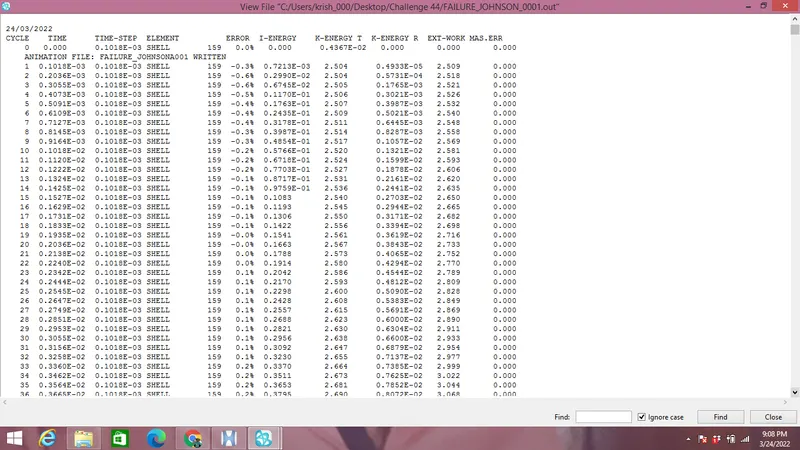
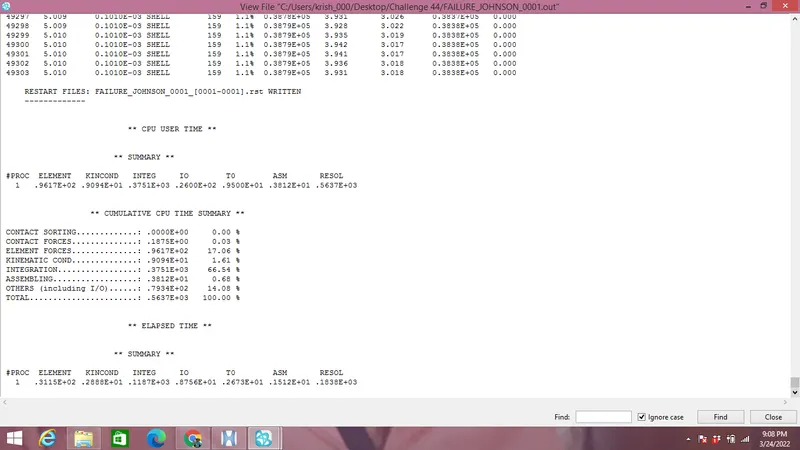
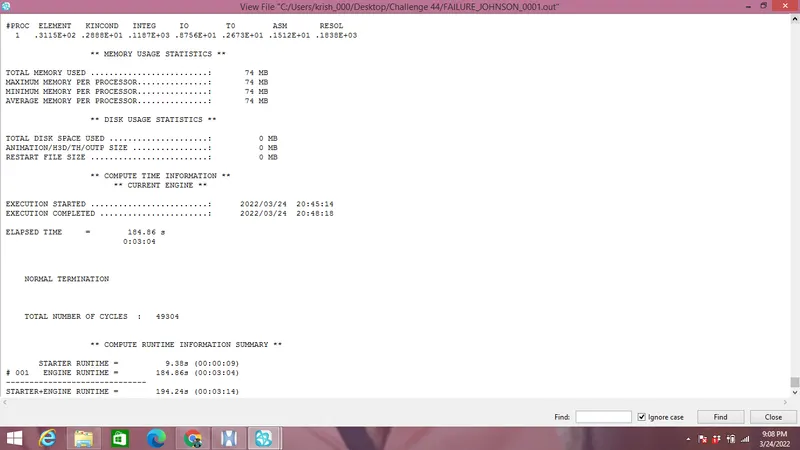
- Energy error is 1.1% while mass error is 0 thus both are in acceptable range with total number of cycles as 49304 at the end of 5ms as observed from the image above.
- Energy graphs of Internal,Kinetic,Total & Hourglass energy are shown in the image below:
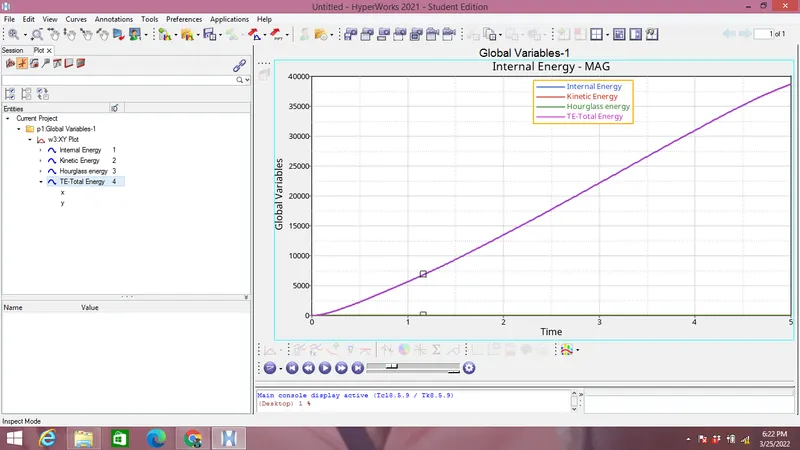
No hourglass energy is observed from the image above, Internal energy & total enegy intercept each other and increases with time because elements are absorbing kinetic energy.
- Von mises Stress plot is shown in the image below in hyperview format by selecting proper .h3d files generated during simulation:
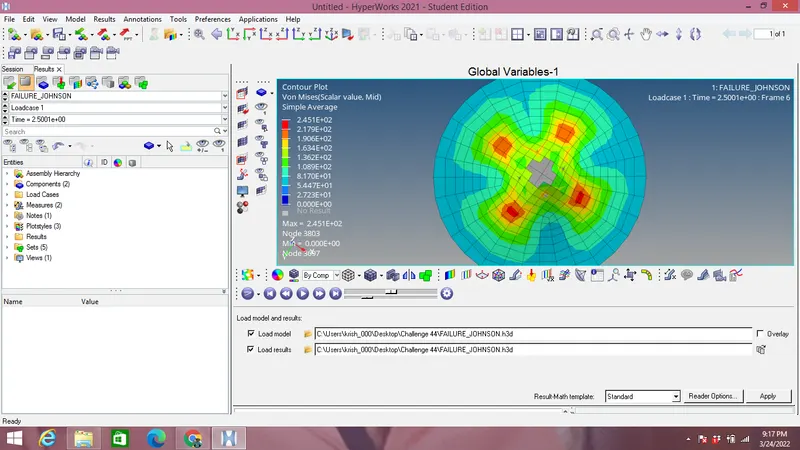
In this case model does not fail as there is no failure criteria applied to the model plastic strain value(Eps_p_max) is deleted which sets it to default value of 10^30 and maximum stress 245.1 MPa.
Case 5:
- Changing the Law 2(Elasto-plastic material) to Law 1(Linear elastic material) with same values of Young's modulus(E),density & Possion's ratio as shown in the image below:
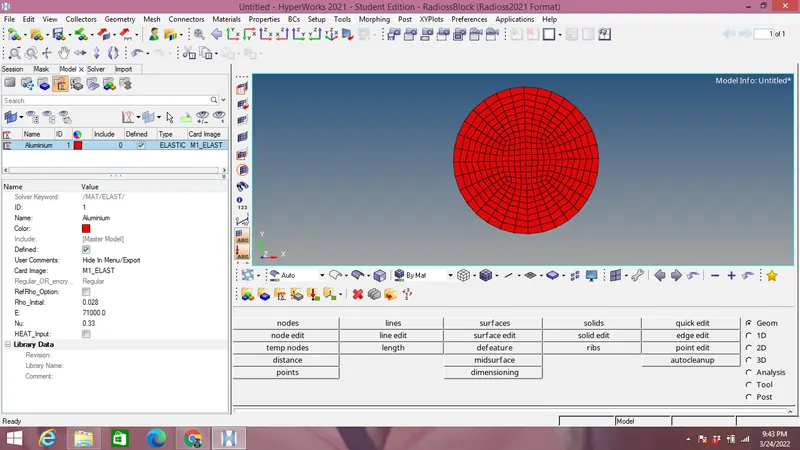
- Material card after analysis simulation is shown in the image below:
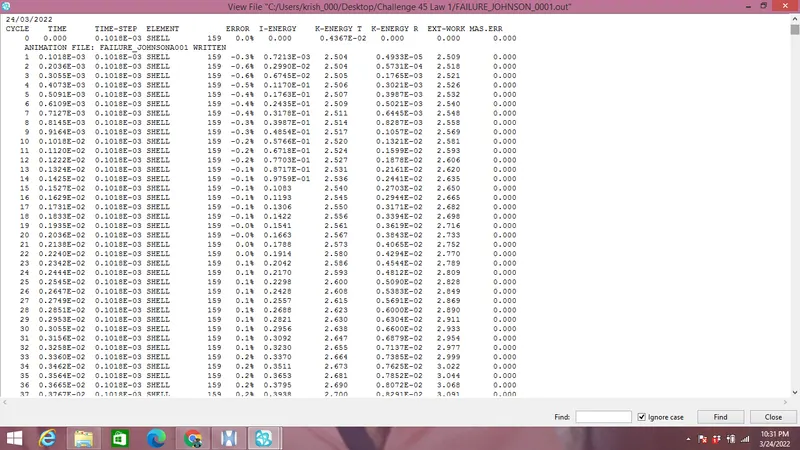
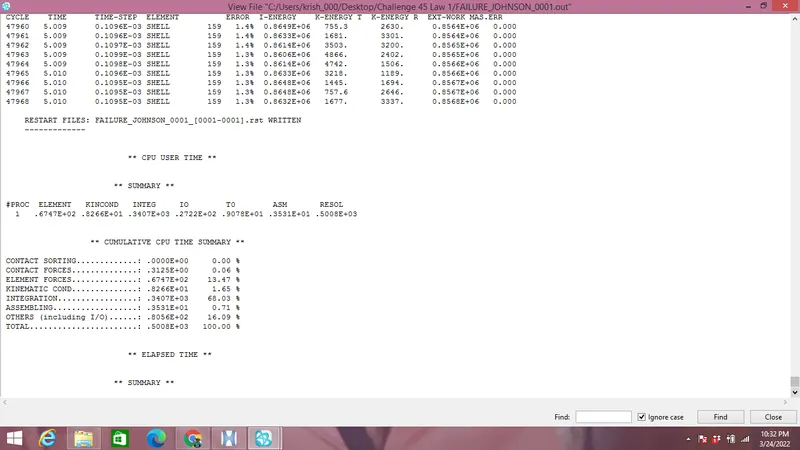
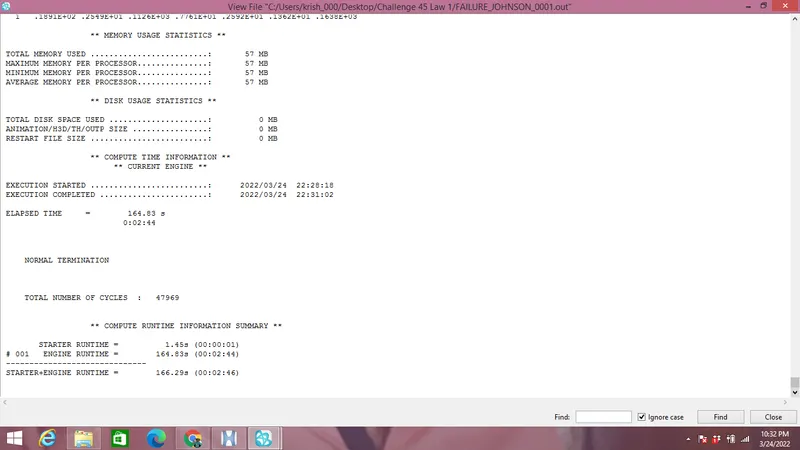
- Energy error is 1.3% while mass error is 0 thus both are in acceptable range with total number of cycles as 47565 at the end of 5ms as observed from the image above.
- Energy graphs of Internal,Kinetic,Total & Hourglass energy are shown in the image below:
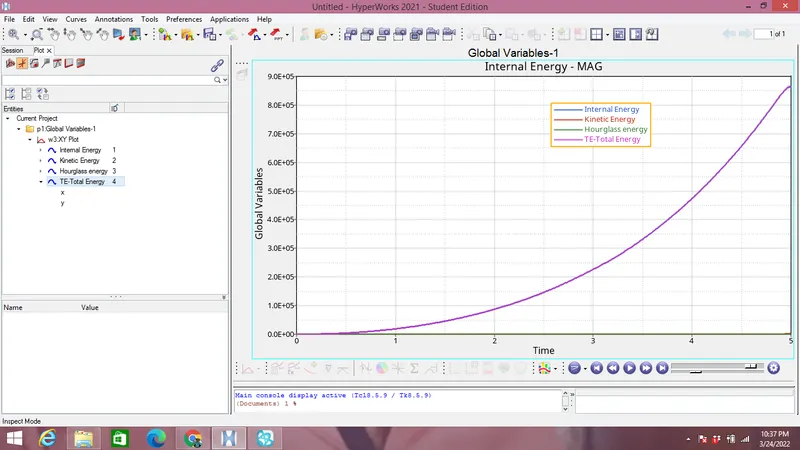
No hourglass energy is observed from the image above, Internal energy & total enegy intercept each other and increases with time because elements are absorbing kinetic energy.
- Von mises Stress plot is shown in the image below in hyperview format by selecting proper .h3d files generated during simulation:
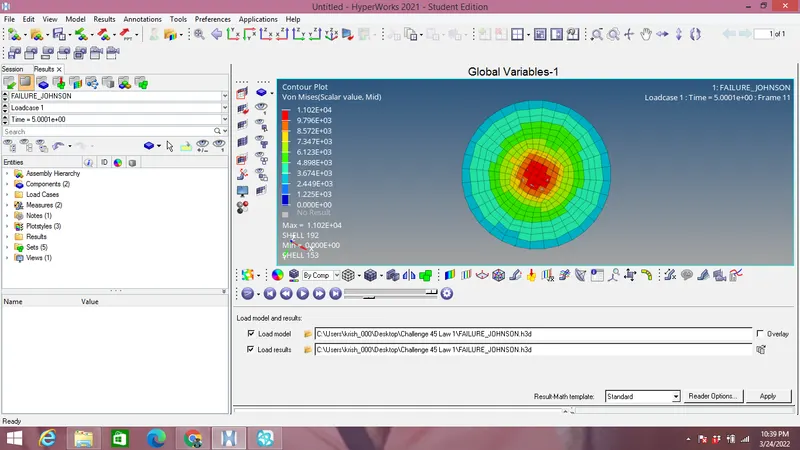
The stress-strain relationship here is linear hence there is no failure of elements after impact of ball.
- Elastic Von mises strain is plotted in the simulation as shown in the image below:
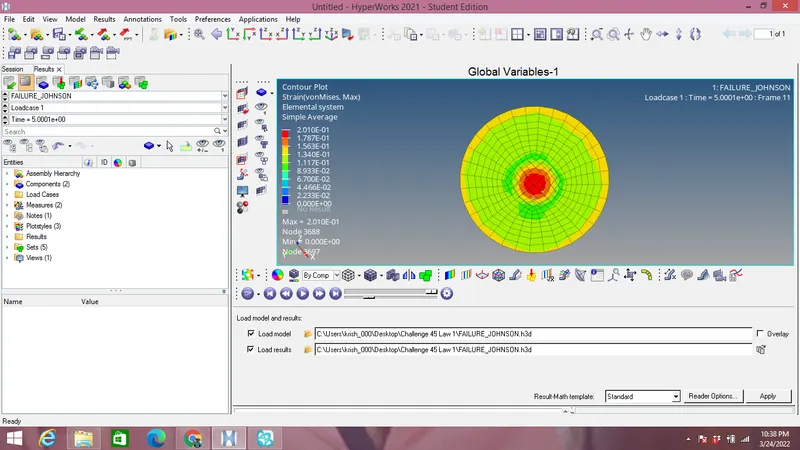
Here the material card is following linear elastic law so there is no plastic strain & failure of elements.
Case 6:
- Import the LAW 27_0000.rad file in the import solver deck as shown in the image below:
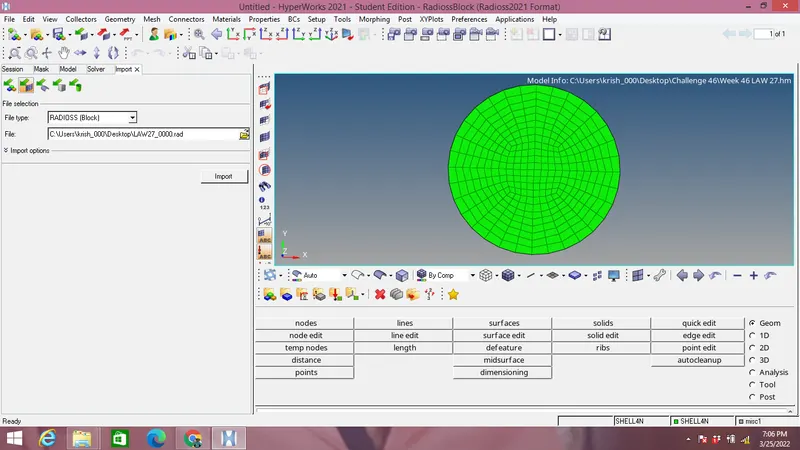
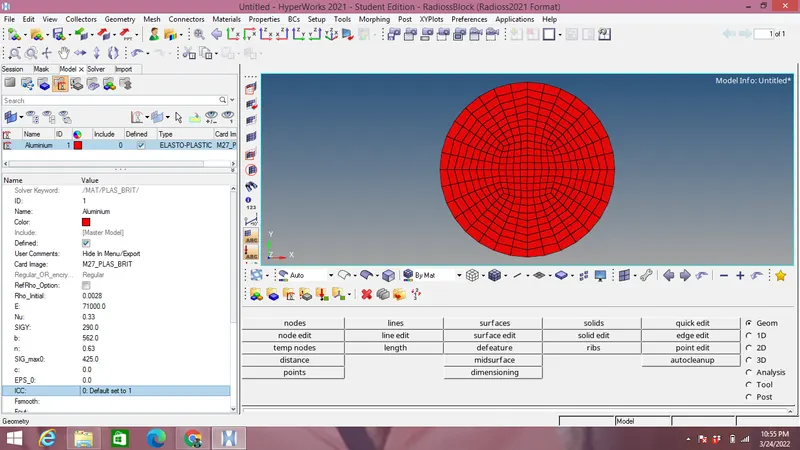
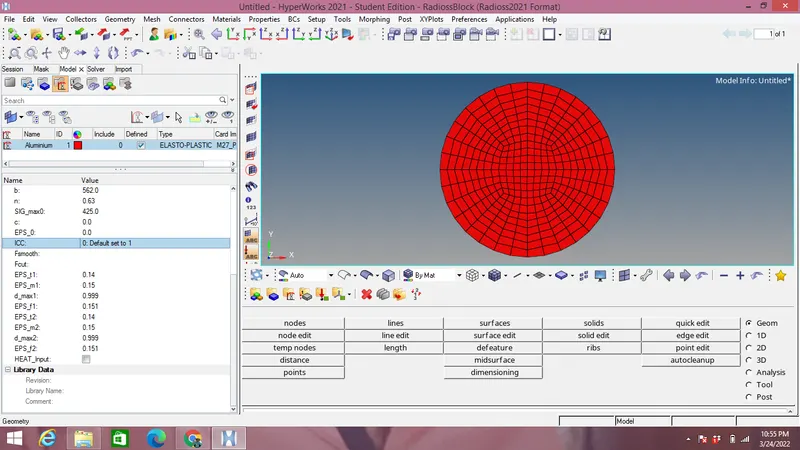
- Change the material card to Law 27 i.e. Elasto-plastic Johnson-Cook material with an orthotropic brittle failure model as shown in the image below:
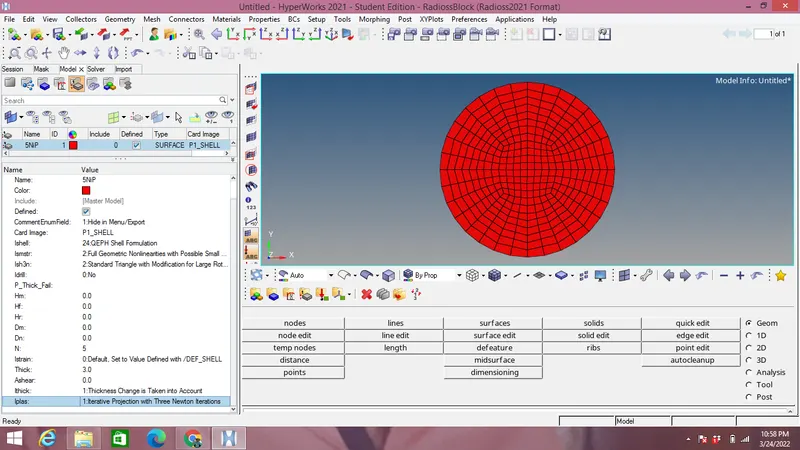
- Recomended shell propeties are used as shown in the image below:
- Material card after radioss analysis simulation is shown in the image below:
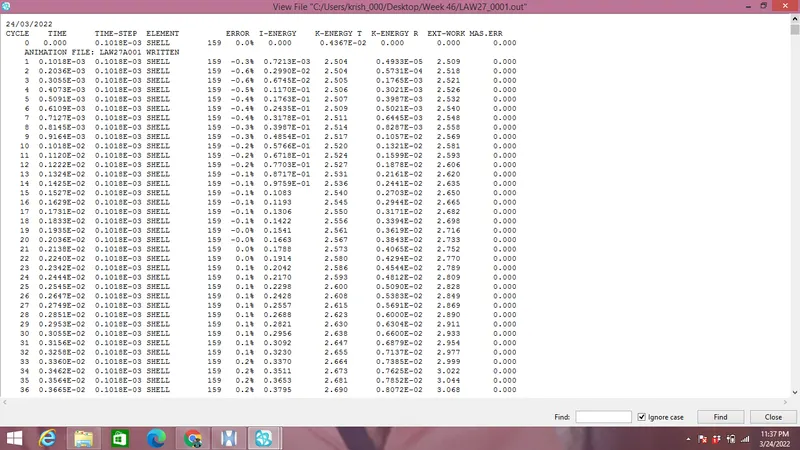
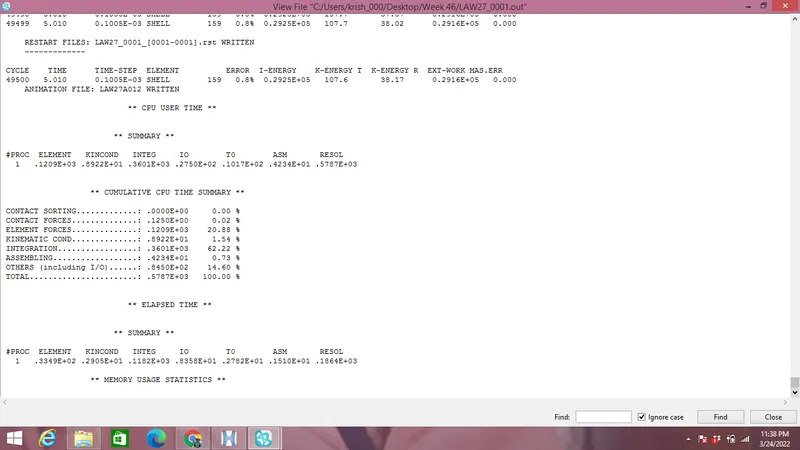
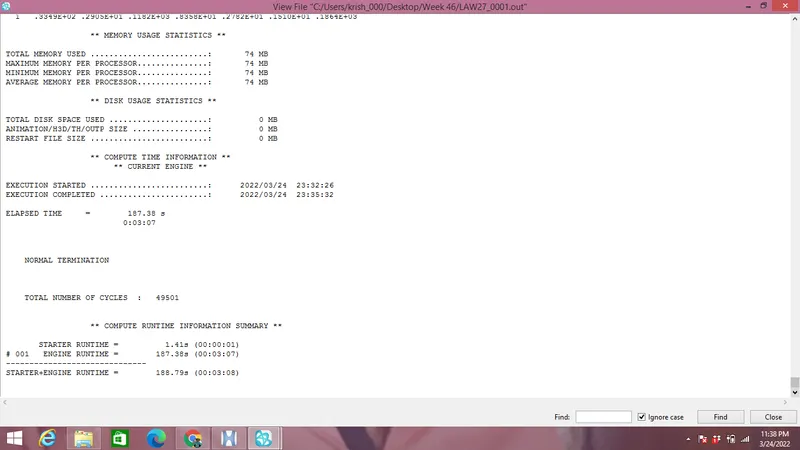
- Energy error is 0.8% while mass error is 0 thus both are in acceptable range with total number of cycles as 49501 at the end of 5ms as observed from the image above.
- Energy graphs of Internal,Kinetic,Total & Hourglass energy are shown in the image below:
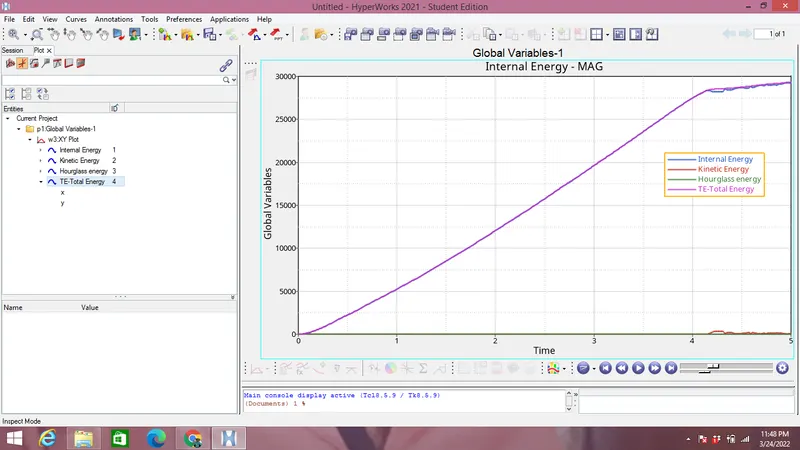
No hourglass energy is observed from the image above, Internal energy is increasing with time because elements are absorbing kinetic energy.
- Plastic strain contour simulations is shown in the image below in hyperview format by selecting proper .h3d files generated during simulation:
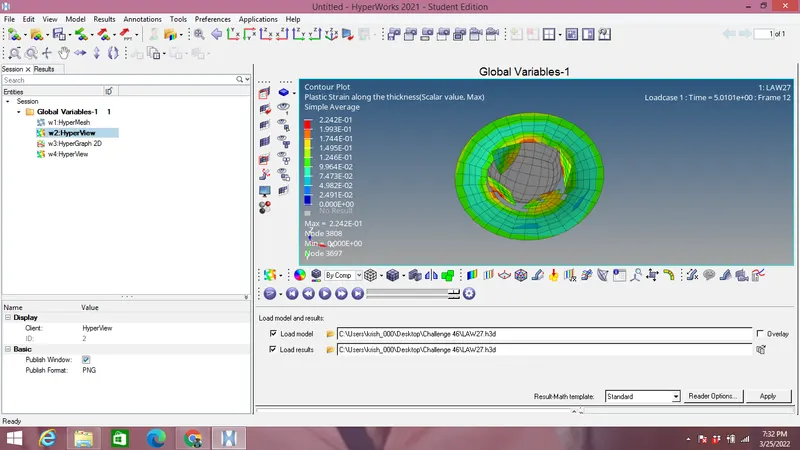
Elements are deleted in the simulation due to Eps_t,Eps_m & Eps_m values.
- Von mises Stress plot is shown in the image below in hyperview format by selecting proper .h3d files generated during simulation:
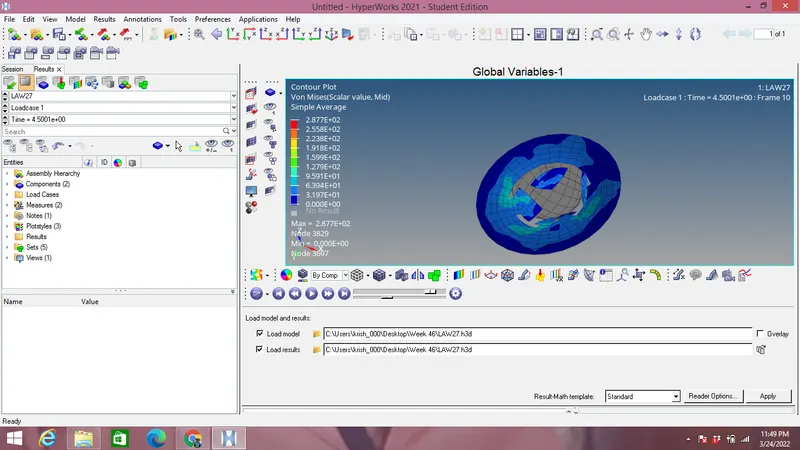
Maximum Von mises stress observed is 287.7MPa, which is below plasticity yiel stress of 290 MPa.
Case 7:
- A Failure Johnson-Cook 0000.rad file is imported in solver deck.
- Create the curve with desired data given in the image below for plastic strain along X and stress along Y axis as shown in the image below:
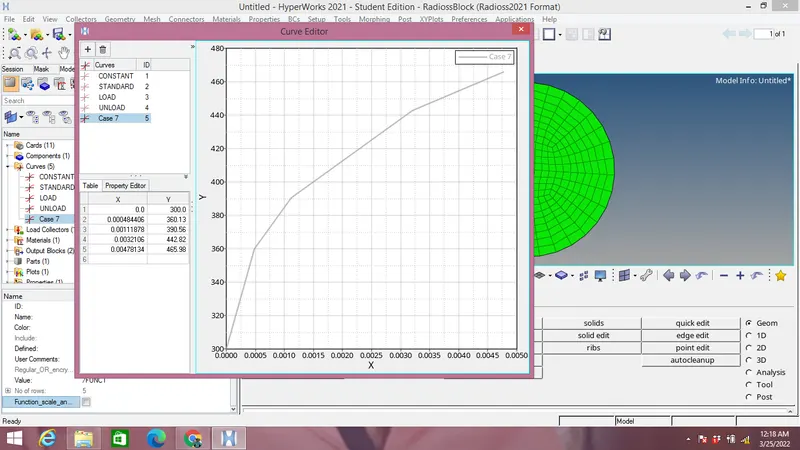
- Change the material card to Law 36 which is for isotropic material using curve as created above as shown in the image below:
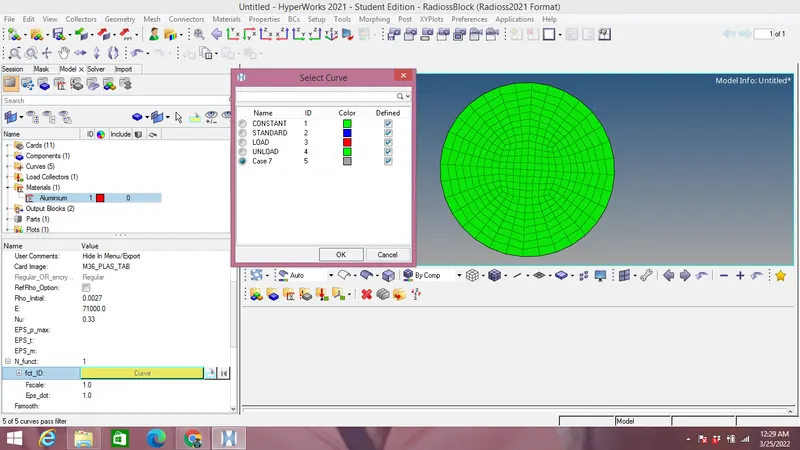
- Assign the desired plastic strain vs Stress curve within N-function by selecting curve created as shown above.
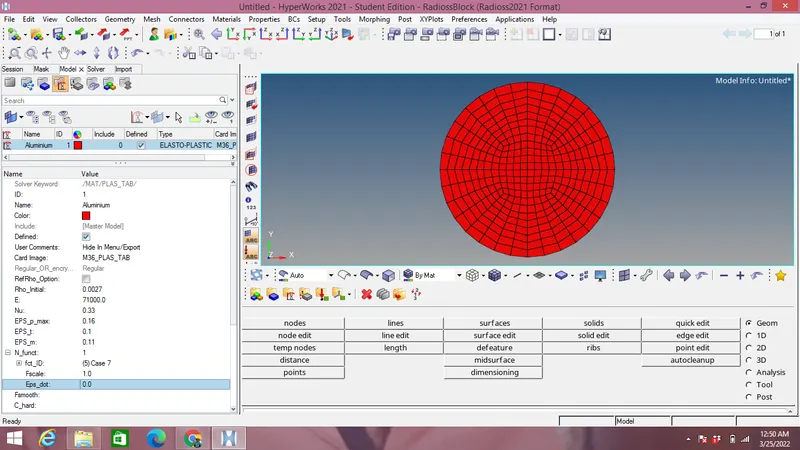
- Material card after radioss analysis simulation is shown in the image below:
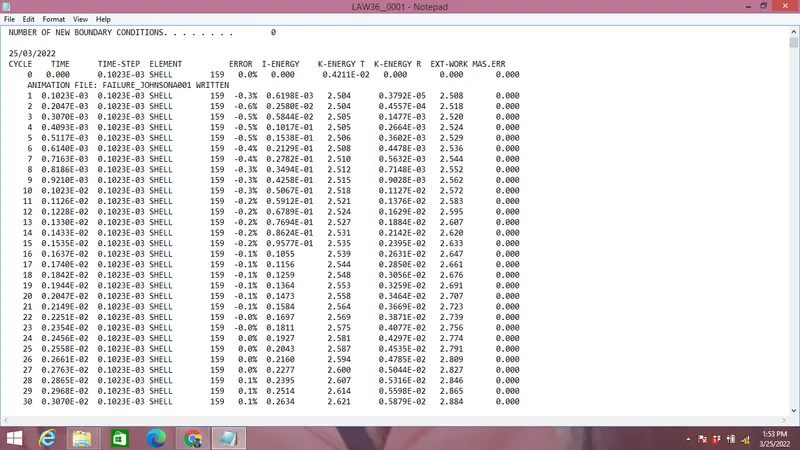
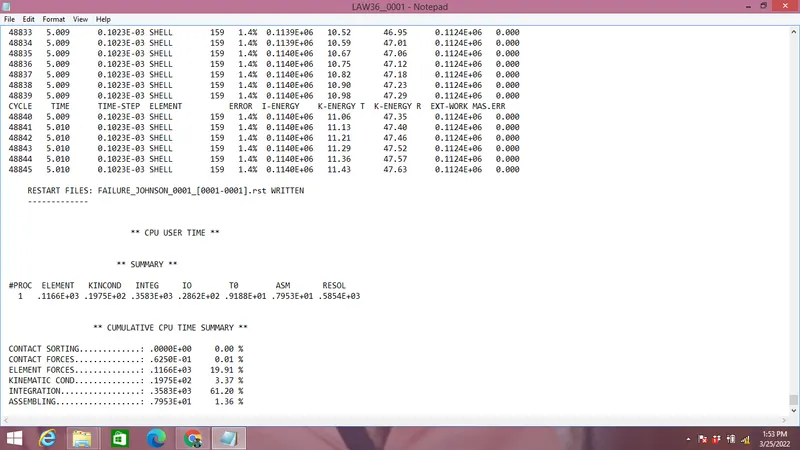
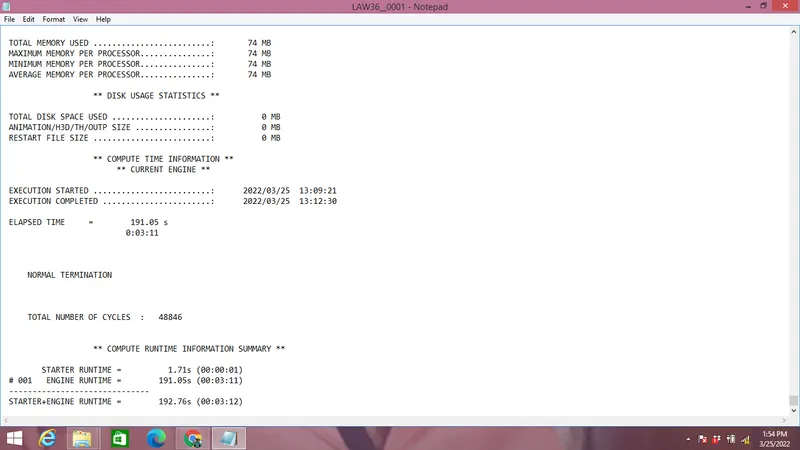
- Energy error is 1.4% while mass error is 0 thus both are in acceptable range with total number of cycles as 48846 at the end of 5ms as observed from the image above.
- Energy graphs of Internal,Kinetic,Total & Hourglass energy are shown in the image below:
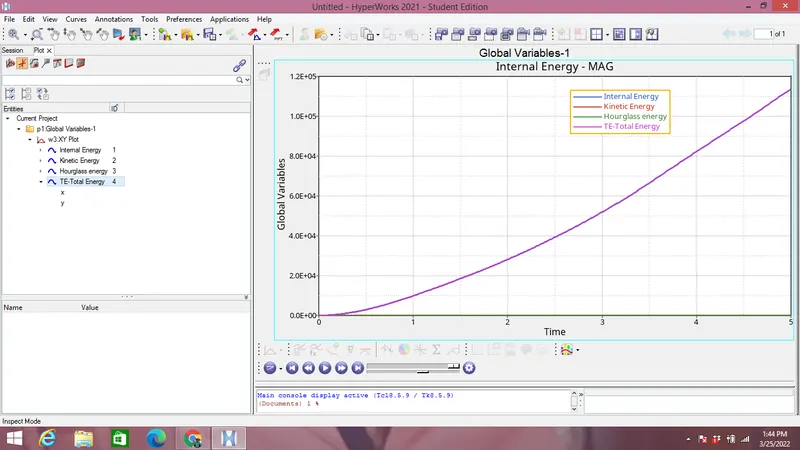
No hourglass energy is observed from the image above, Internal energy is increasing with time because elements are absorbing kinetic energy.
- Plastic strain contour simulations is shown in the image below in hyperview format by selecting proper .h3d files generated during simulation:
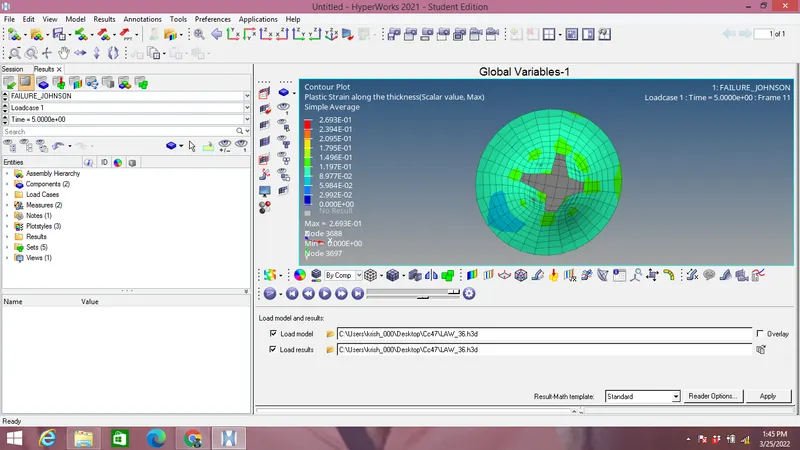
Maximum Plastic strain along thickness is 2.693E-01.
- Von mises Stress plot is shown in the image below in hyperview format by selecting proper .h3d files generated during simulation:
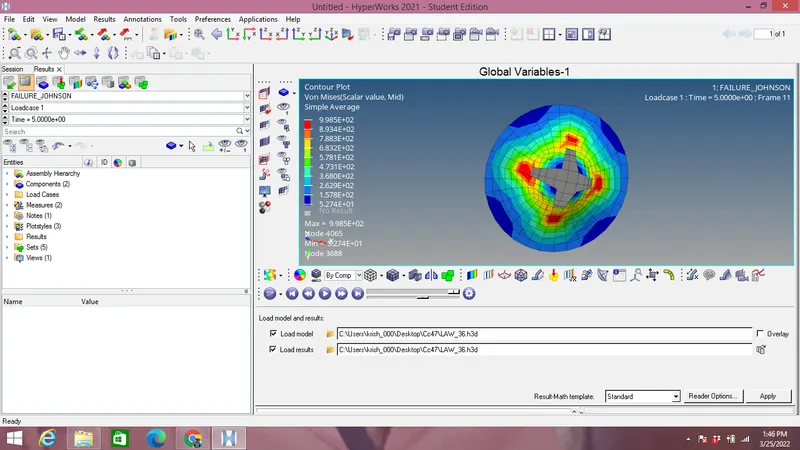
Once Eps_p reaches Eps_p_max in one integration point the element gets deleted.
Comparision of case 1,2,3,4,5,6&7:
| Case | Material Law | Simulation name | Eneregy error(%) | Simulation time(s) | No. of cycles | Max Stress(MPa) | Element behaviour |
| 1 | Law 2(Johnson-Cook material model) | Eps_max_failure | 0.8 | 224.58 | 49380 | 238.2 | Deleted |
| 2 | Law 2(Johnson-Cook material model) | Eps_max_failure_Crack 4 | 4.1 | 245.27 | 49217 | 295.1 | Crack occurs then deleted |
| 3 | Law 2(Johnson-Cook material model) | Eps_max_nofail | 0.8 | 182.95 | 49408 | 270.7 | Deleted |
| 4 | Law 2(Johnson-Cook material model) | Law 2 | 1.1 | 184.86 | 49304 | 245.1 | Deleted |
| 5 | Law 1(Linear elastic) | Law 1 | 1.3 | 164.83 | 47969 | 1102 | Preserved |
| 6 | Law 27(Brittle failure model) | Law 27 | 0.8 | 187.38 | 49501 | 287.7 | Deleted |
| 7 | Law 36(Elasto-plastic material model) | Law 36 | 1.4 | 191.05 | 48846 | 998.5 | Deleted |
Conclsion:
Comparision between Von mises stress,Plastic strain & element behaviour have been carried out with various material & failure cards and there values are compared for better material selection depeneding on requirement of user in tabulated format.