Week-6 Calculate the Stretch Ratio by comparing the ELFORM (-2,-1,1,2) with Ogden_Material Model.
Calculate the Stretch Ratio by comparing the ELFORM (-2,-1,1,2) with Ogden_Material Model:
Aim:
Calculate the Stretch Ratio by comparing the ELFORM (-2,-1,1,2) with Ogden_Material Model:
Steps followed:
Preprocessing:
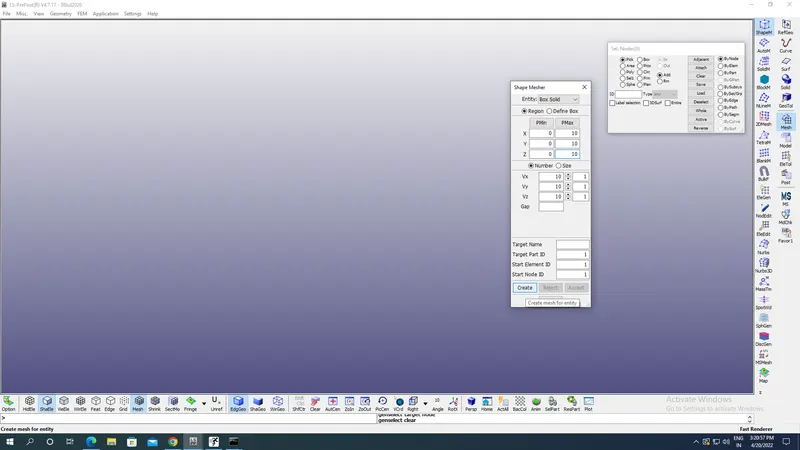
- First go to the Mesh button inside the toolbar located at the right side of screen and then select the Shape Mesher button and then select the entity of Box solid and give maximum coordinates of X,Y &Z as 10 units , with number of element along x , y & z as 10 as shown in the image below to create a cube with meshing.
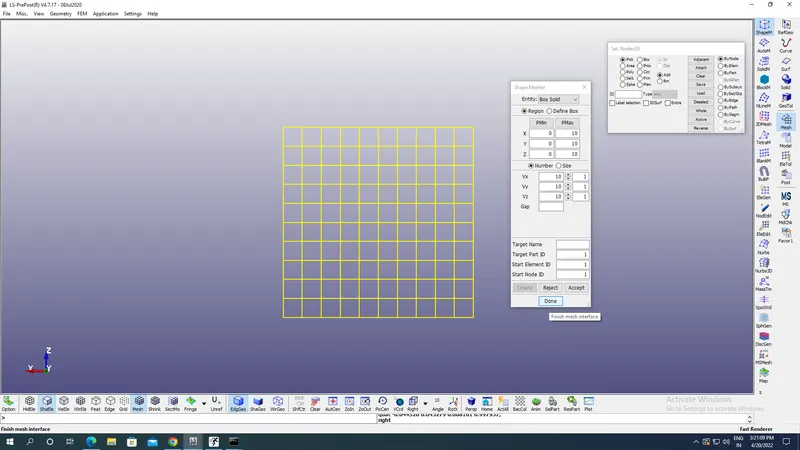
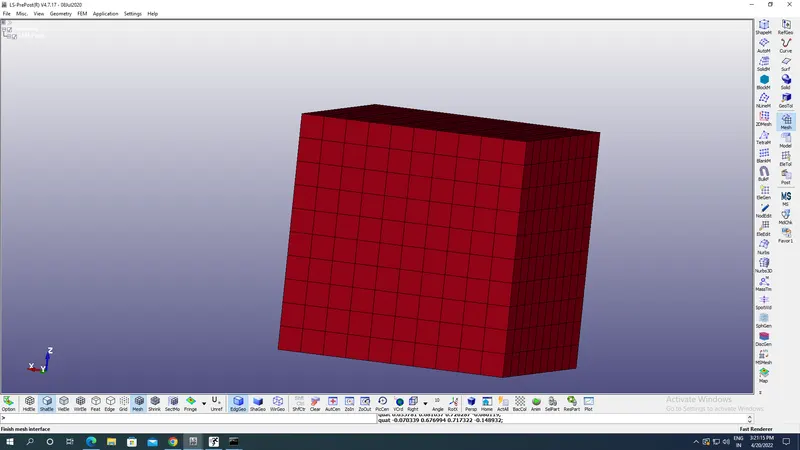
Finally created Cube with 10X10X10 mm^3 with 10 solid elements in each x , y &z looks like as shown in the image above.
-
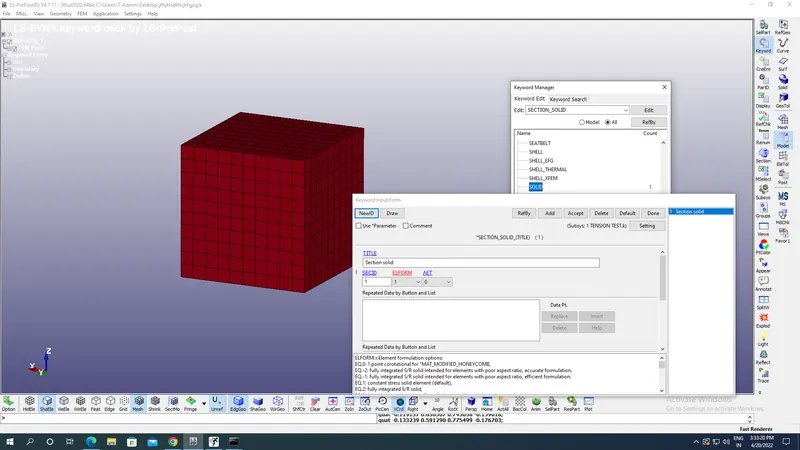
Now create a section for defining element formulation,integration rule, cross sectional properties etc by going to the Keyword option in the Toolbar on the right side & selecting the Section-Solid option with Element form as 1 for Constant stress solid element. Give appropriate section id & title as per your convenience as shown in the image below:
- Now material given for the cube is MAT 077 Hyperelastic rubber with Linear Viscoelasticity with parameters of Mass density(RO),Poission’s ratio(PR),Order to fit load curve ID1 for OGDEN model(N),Number of Prony series(NV) for load curve ID2,Shear modulus for frequency independent damping(G),MUi as i-th shear modulus were i varies upto 8.
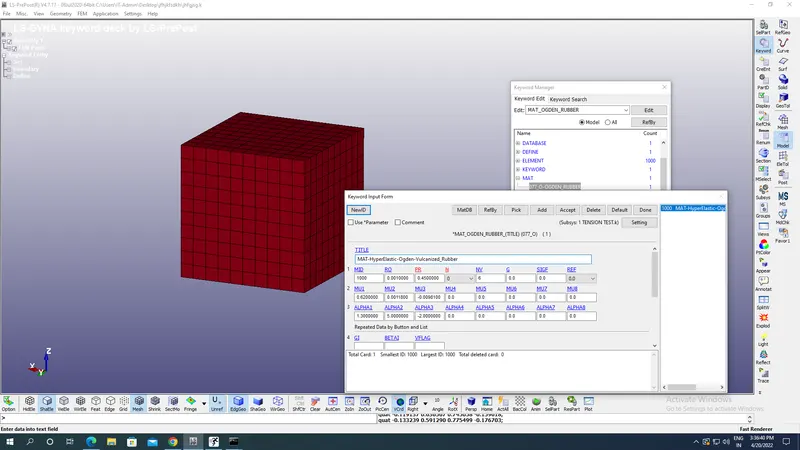
-
Now first create the Set-Nodes for assigning the Boundary conditions of fixing the nodes at the bottom & elongating the faces opposite to the fixed one.
Go to Create Identity in the right side toolbar under Models options and select Set-Set Nodes-AREA option and pick the nodes at the bottom to be fixed with proper title & ID as shown in the image below:
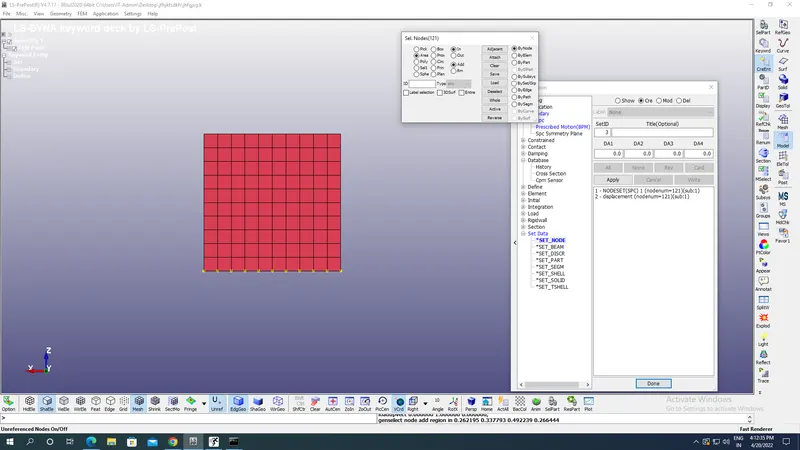
-
Now select the nodes on the opposite face of fixed ones to be elongated with title,ID and all other steps as shown in the image below:
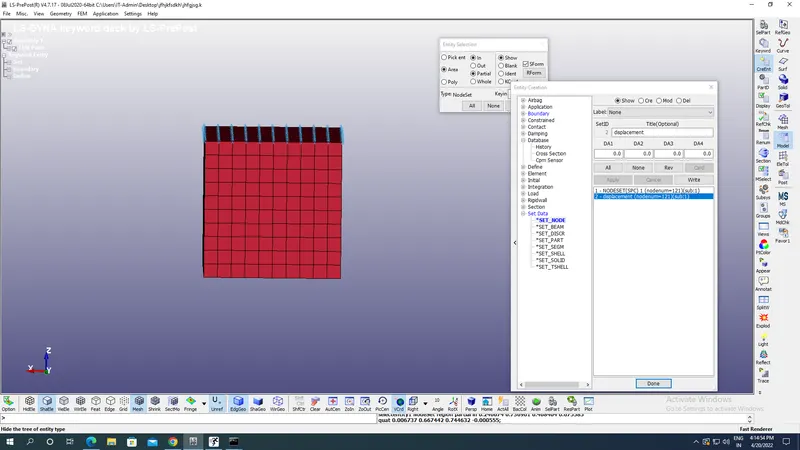
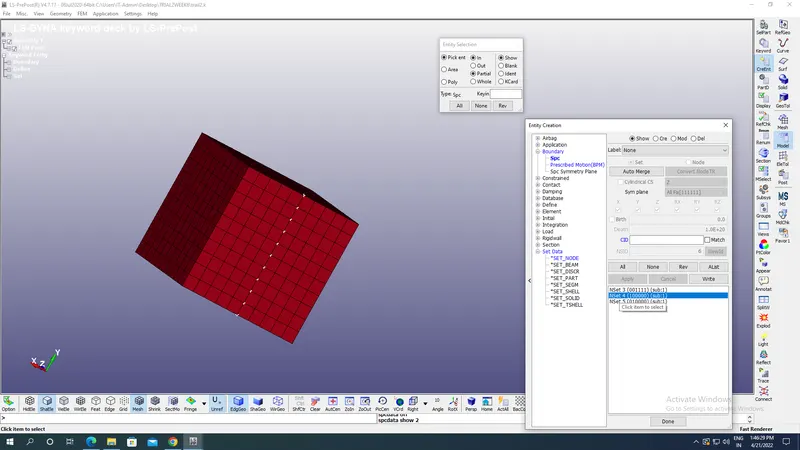
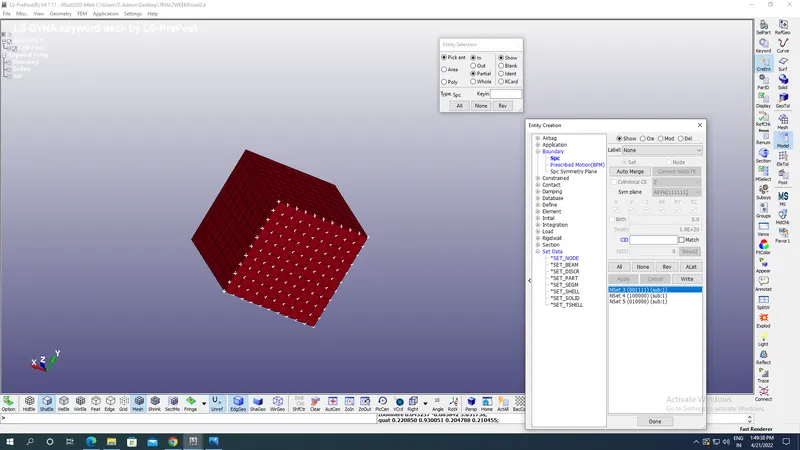
Create 3 set nodes before applying SPC by creating set nodes as shown in the image below in order to fix the nodes.
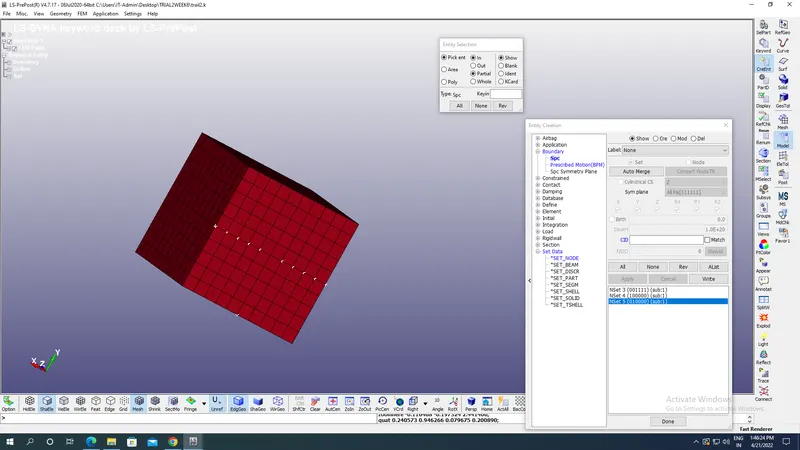
-
Now apply boundary conditions:
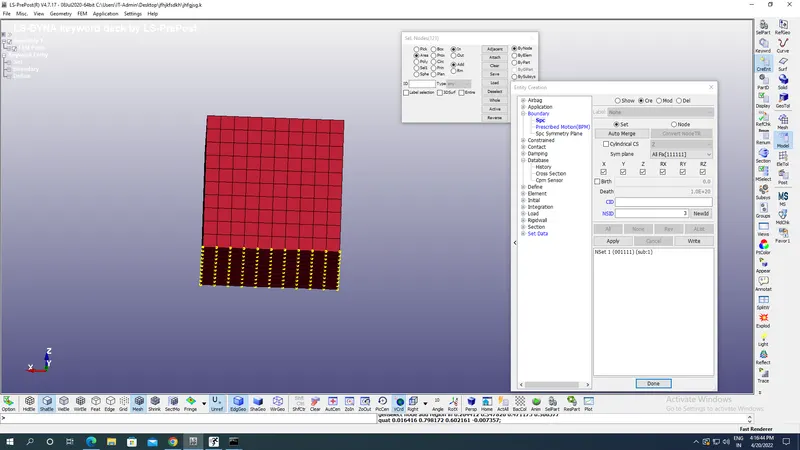
First go to Create Entity select the Boundary-Single Point Constraint(SPC) with appropriate set ID selection in order to fix the nodes as shown in the image below:
STRETCH RATIO: Ratio of final to initial length of deformed object.
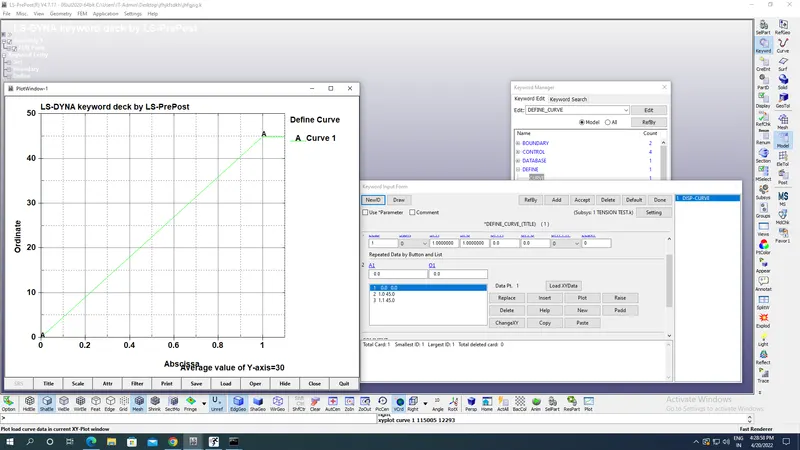
- Now we want the deformation of the cube to be under stretch ratio upto 5 and we have the initial length of the cube as 10 mm so for that we can apply maximum Final length as 10X5=50mm.
So in order to maintain that stretch ratio we need to apply Prescribed Motion with displacement & Load curve ID with proper set ID and Scale factor of 1.Load curve ID of Final length vs time created under Keyword-Define-Curve option as shown in the image below with plots:
-
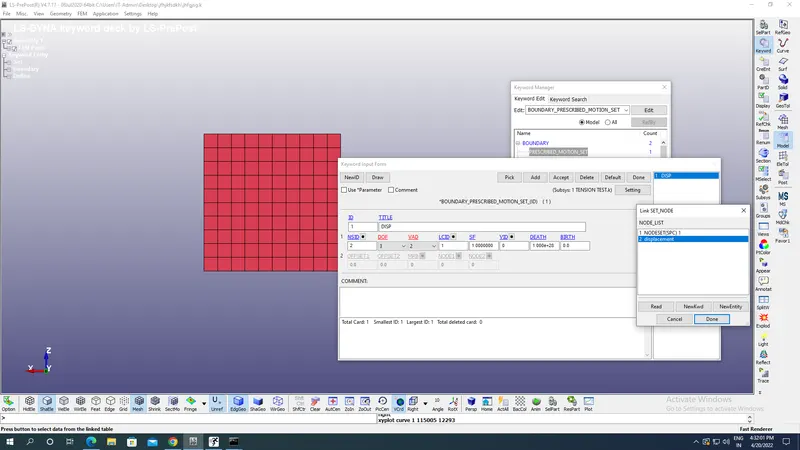
Now apply Prescribed Motion Set for selecting the node set created for Displacement before with appropriate set ID,DOF as 3 for Translational motion along z axis,VAD as 2 for displacement of rigid bodies as shown in the image below:
-
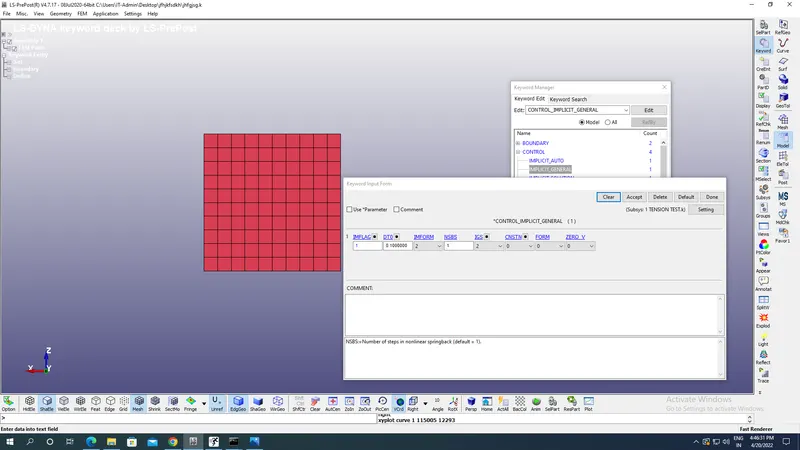
Now we have selected Implicit analysis not Explicit because here the elongation of length due to displacement applied is time independent so elongation happening will also be time independent.So we have to create some cards necessary for the Implicit analysis under Controls-Implicit general options with Implicit/Explicit flag type(IMFLAG) as 1 for implicit analysis & Initial time step size (DT) as 0.1 ms as shown in the image below:
-
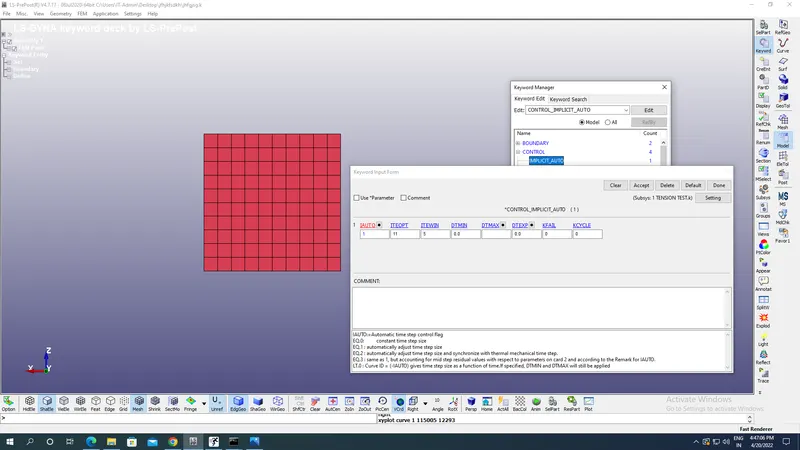
Now we have to select second card necessary to change the load step which we select under Control-Implicit Auto with IAUTO as 0 for Automatic Time step control flag to be constant as this is almost static simulation, depending on Optimum equilibrium Iteration(ITEOPT) as 11 and ITWIN as 5 which is allowable iteration window as shown in the image below:
-
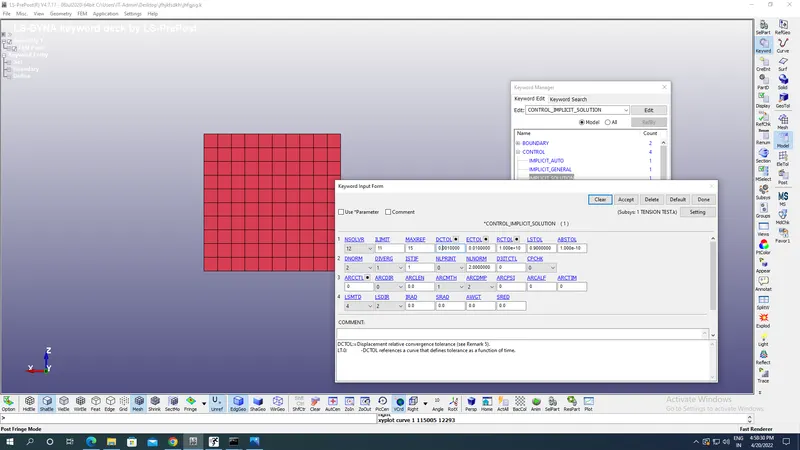
Now another card for Non-linear Implicit solution is under Control-Nonlinear Implicit solution with Nsolver as 12 for Non-Linear solution and Limit for Stiffness reformation(ILIMIT) as 11,with displacement relative convergence tolerance as(DCTOL) as 0.001 as shown in the image below:
-
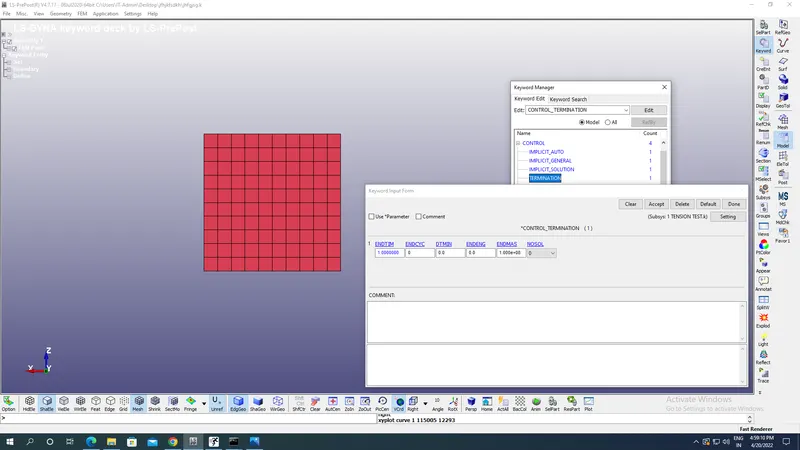
Now we have to apply termination time to our simulation i.e the time for which the displacement applied at the free end is going to elongate the cube which is given by Control-Termination under ENDTIM as 1 ms as shown in the image below:
-
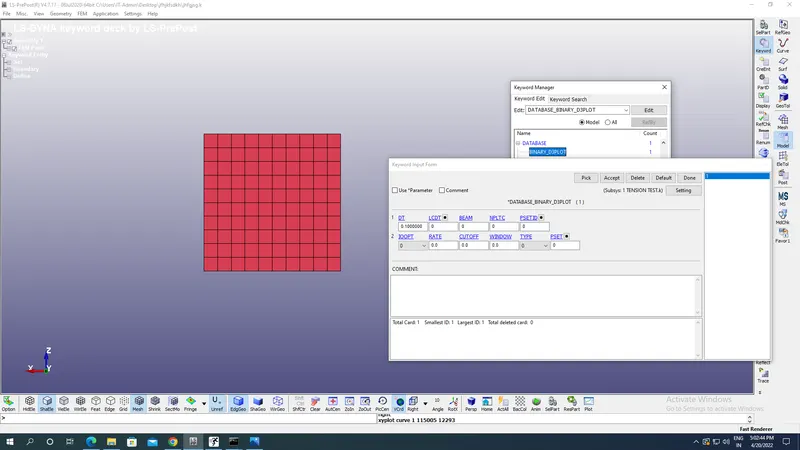
For results & outputs go to Database option under Keyword option & apply the Binary D3Plot as shown in the image below with step(DT) as 0.1 as shown in the image below:
-
Saving & Post Processing:
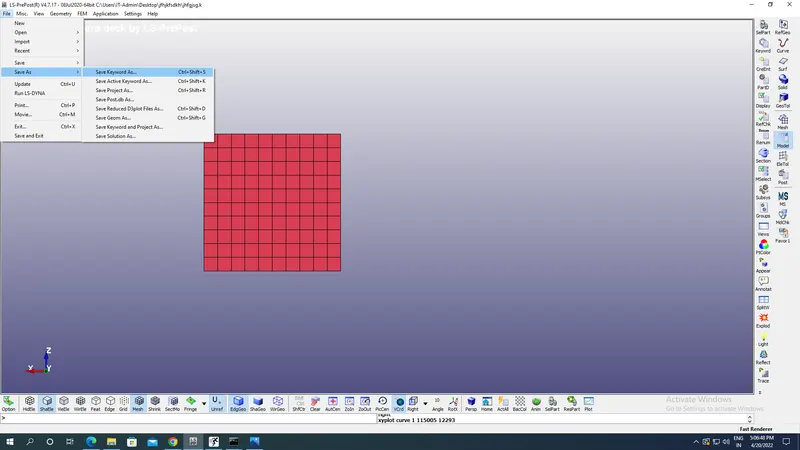
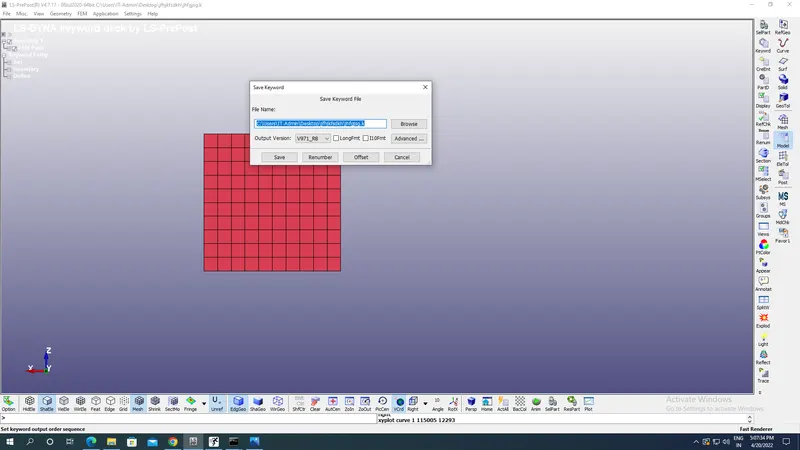
Now got to file select the save as- save keyword as option to save the file.
Results:
Element formulation:1
True Z-stress vs time:
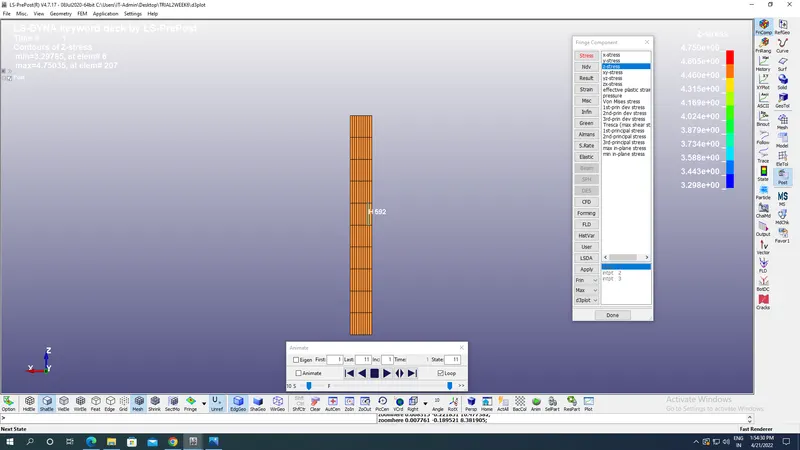
Maximum Z stress:4.750gm mm^-1 ms^-2.
True Z-strain vs time:
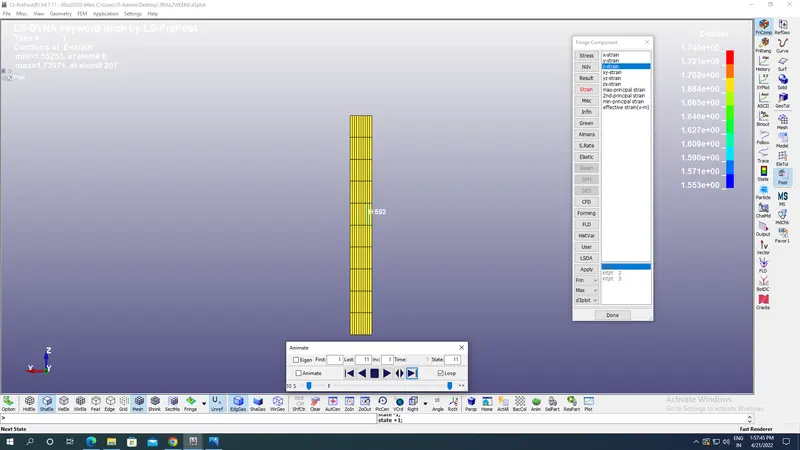
Maximum Z strain:1.740.
Calculation of Element Formulation=1:
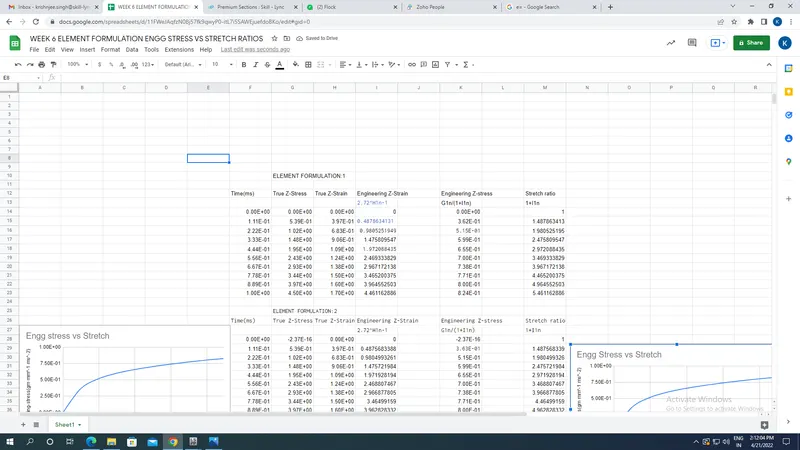
Engineering strain is calculated from true strain by formula as engineering strain=2.72^true strain-1.
Engineering stress is calculated from true strain & True stress by formula as engineering stress=True stress/(1+Engineering strain).
Stretch ratio=1+Engineering Strain.
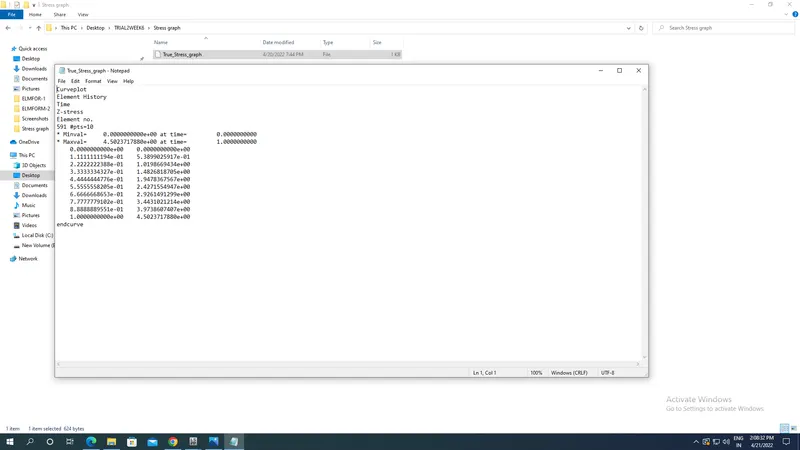
For this we first have to go to History-Select the elements & pick one element and plot the Z stress & strain garphs upto 10 time states and save them in your accessible file as shown in the image below:
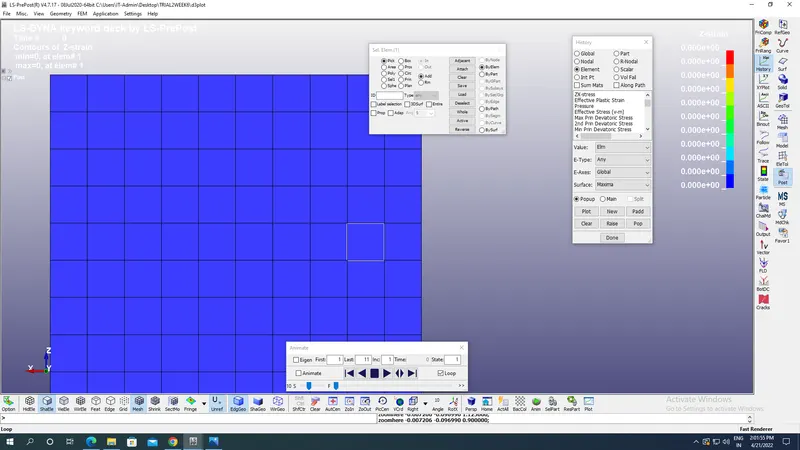
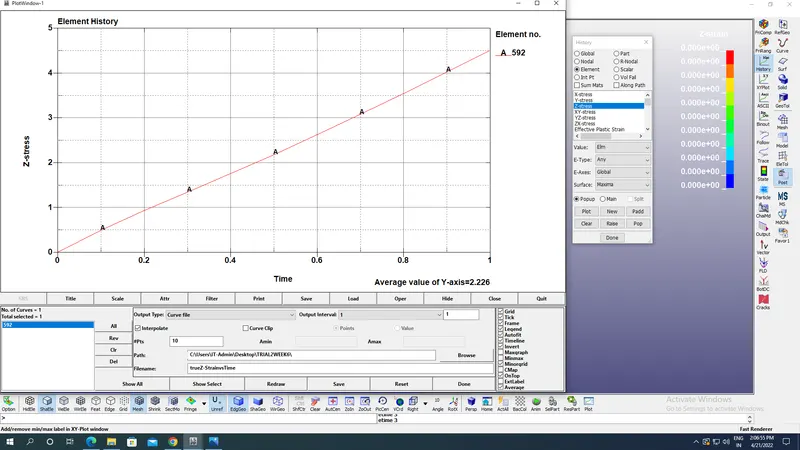
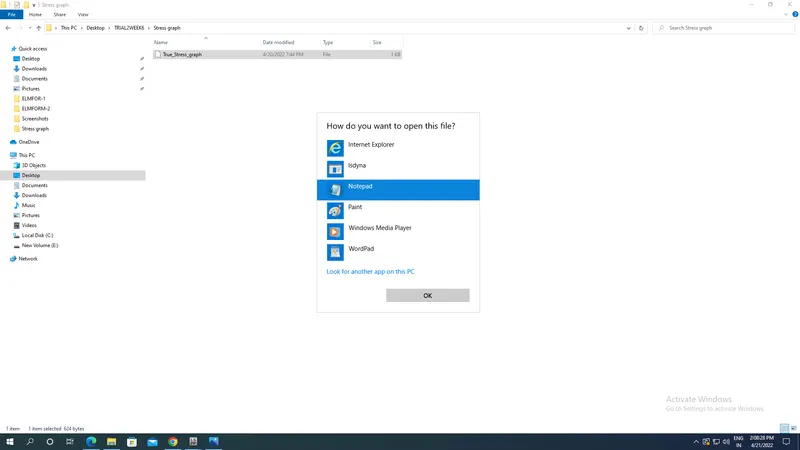
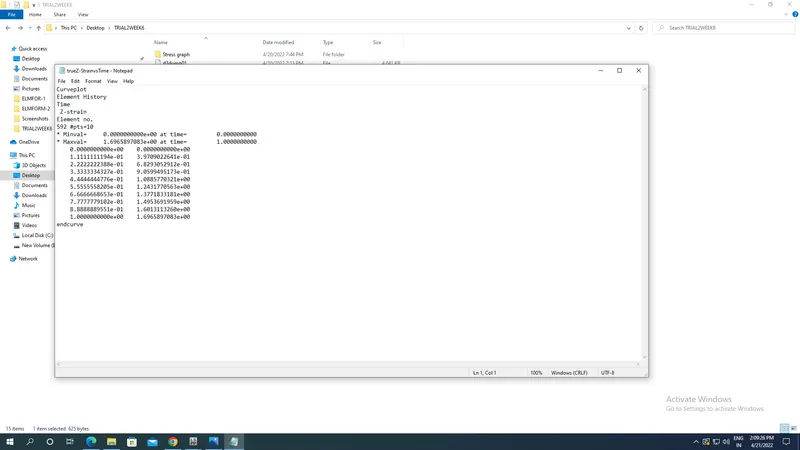
Open the save stress file in notepad format as shown in the figure below in order to plot that with time step in the excel sheets as shown in the image below:
True strain vs time in Notepad format upro 10 time states:
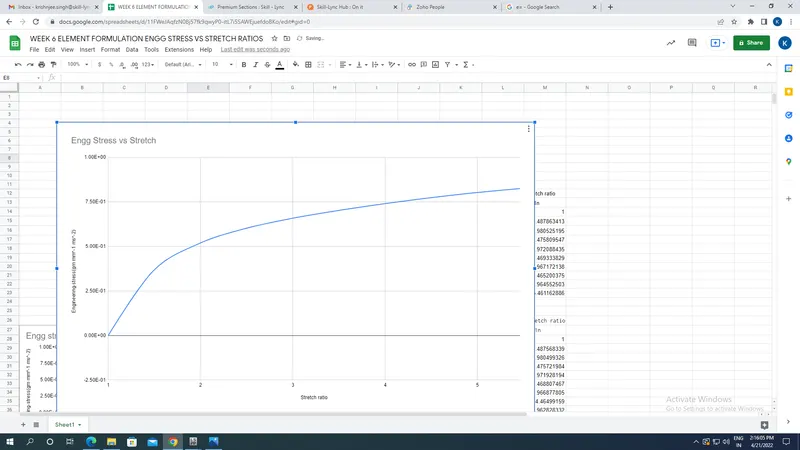
Go to excel sheet & plot all the data of Time,True Stress,True strain and calculate the Engineering stress,engineering strain & stretch ratio with respect to formula provided as shown in the image below:
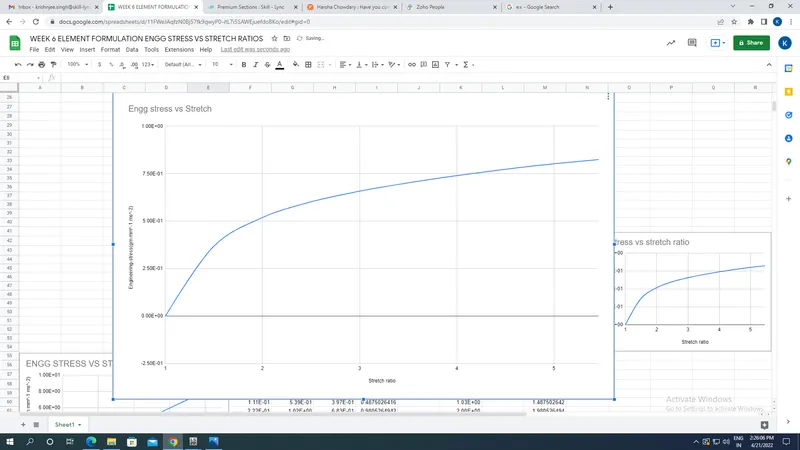
Now plot the graph of Engineering stress vs Stretch ratio by Insert option-Chart and smooth curves by selecting Stretch along X axis & Engineering stress along Y axis with proper units:
Element formulation:2
True Z-stress vs time:
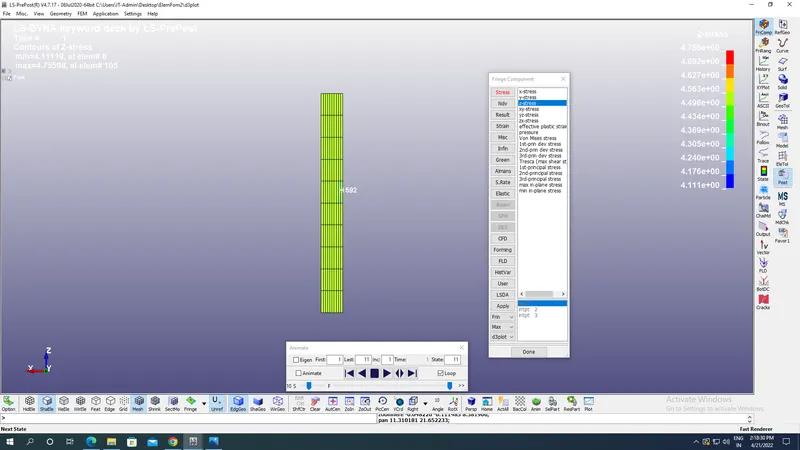
Maximum Z stress:4.756gm mm^-1 ms^-2.
True Z-strain vs time:
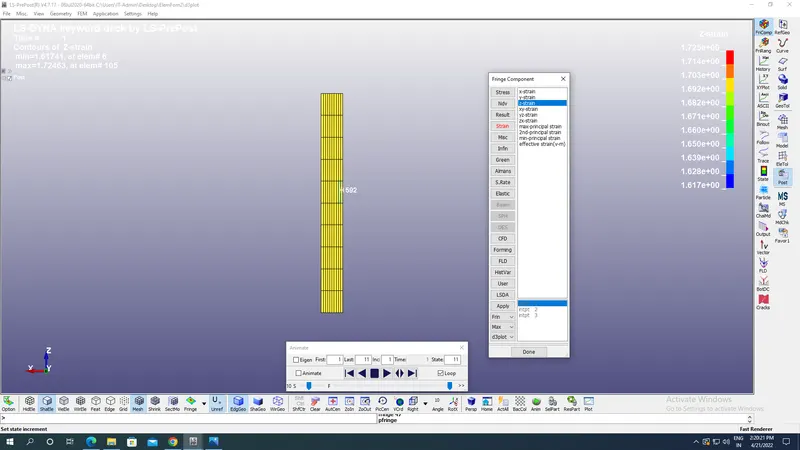
Maximum Z strain:1.740.
Calculation of Element Formulation=2:
Engineering strain is calculated from true strain by formula as engineering strain=2.72^true strain-1.
Engineering stress is calculated from true strain & True stress by formula as engineering stress=True stress/(1+Engineering strain).
Stretch ratio=1+Engineering Strain.
For this we first have to go to History-Select the elements & pick one element and plot the Z stress & strain garphs upto 10 time states and save them in your accessible file as shown in the image below:
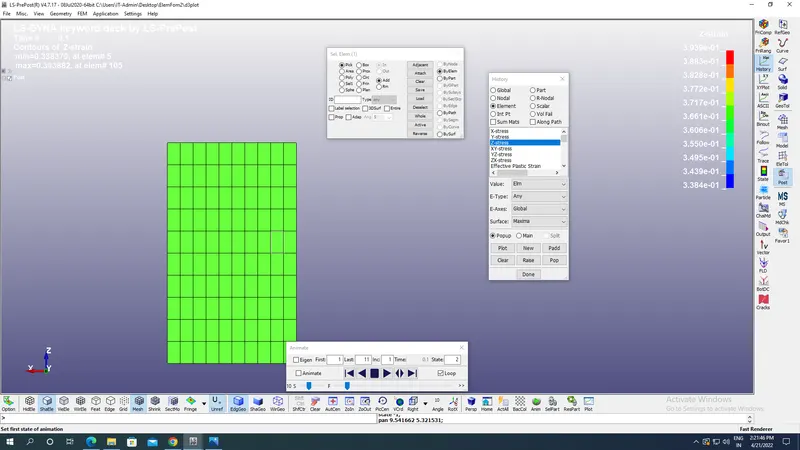
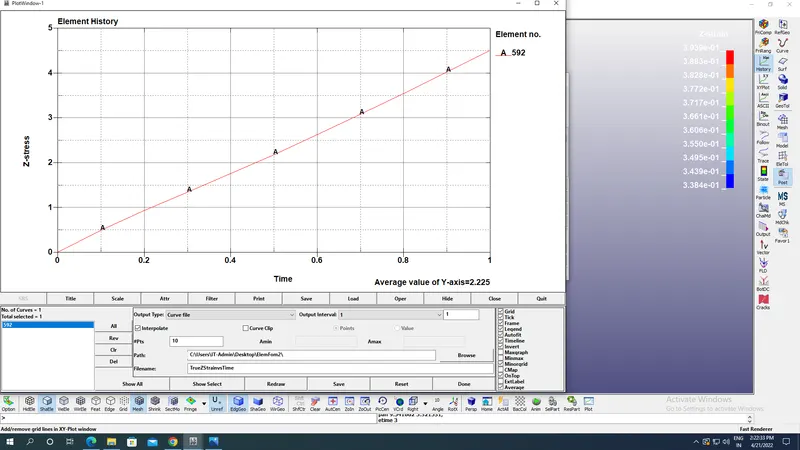
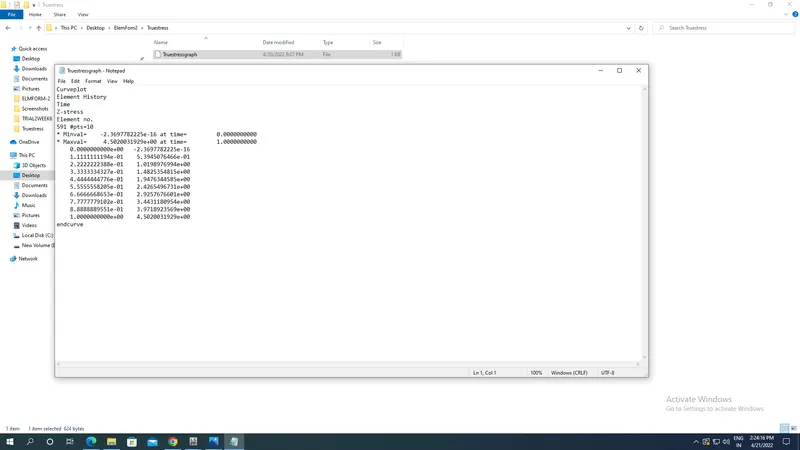
Open the save stress file in notepad format as shown in the figure below in order to plot that with time step in the excel sheets as shown in the image below:
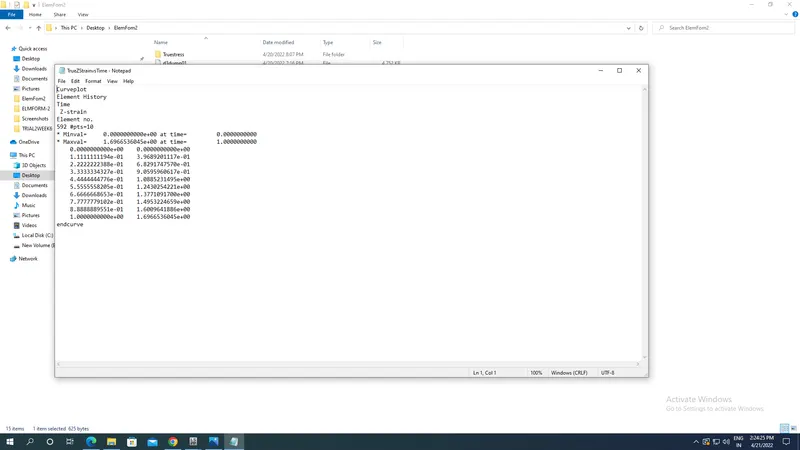
True strain vs time in Notepad format upro 10 time states:
Go to excel sheet & plot all the data of Time,True Stress,True strain and calculate the Engineering stress,engineering strain & stretch ratio with respect to formula provided as shown in the image below:
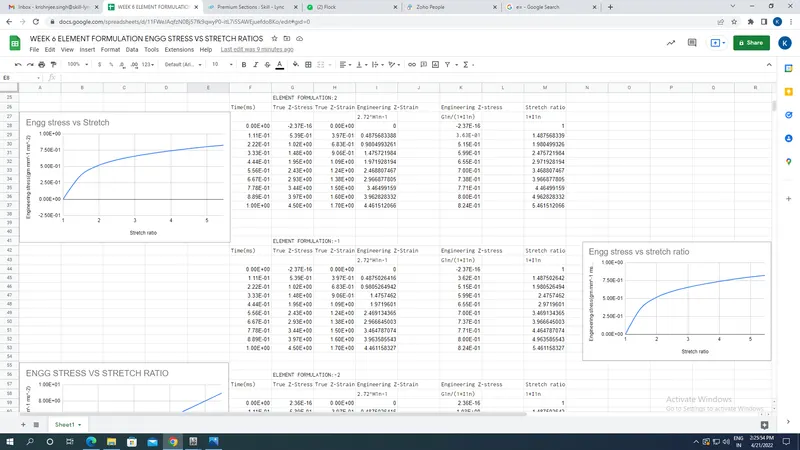
Now plot the graph of Engineering stress vs Stretch ratio by Insert option-Chart and smooth curves by selecting Stretch along X axis & Engineering stress along Y axis with proper units:
Element formulation:-1
True Z-stress vs time:
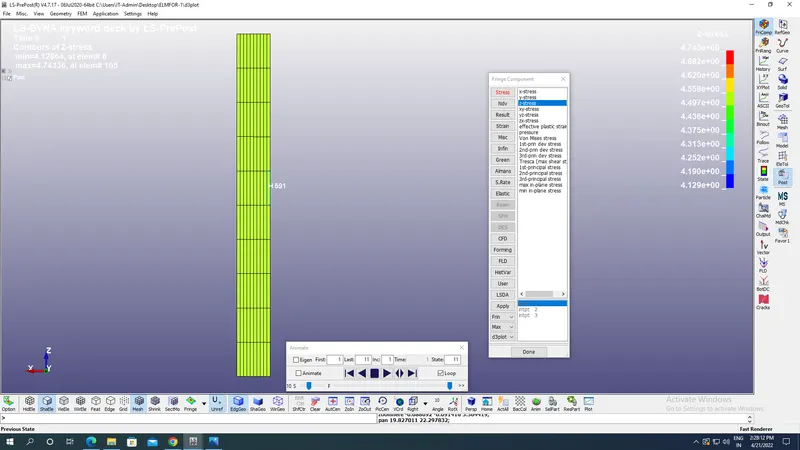
Maximum Z stress:4.743gm mm^-1 ms^-2.
True Z-strain vs time:
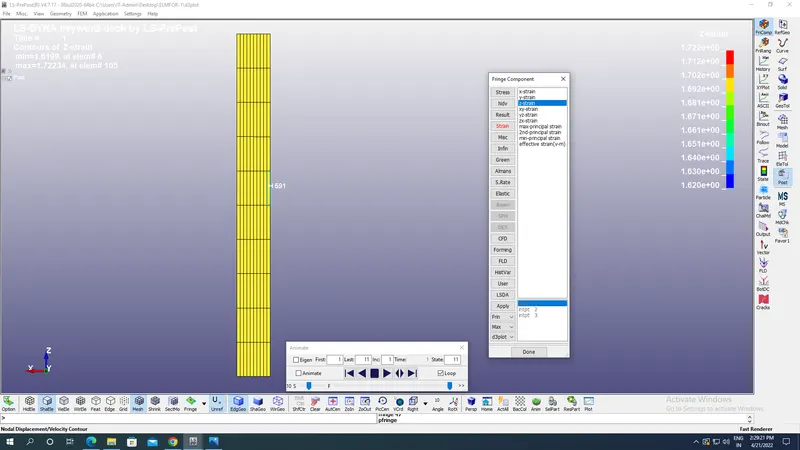
Maximum Z strain:1.722.
Calculation of Element Formulation=-1:
Engineering strain is calculated from true strain by formula as engineering strain=2.72^true strain-1.
Engineering stress is calculated from true strain & True stress by formula as engineering stress=True stress/(1+Engineering strain).
Stretch ratio=1+Engineering Strain.
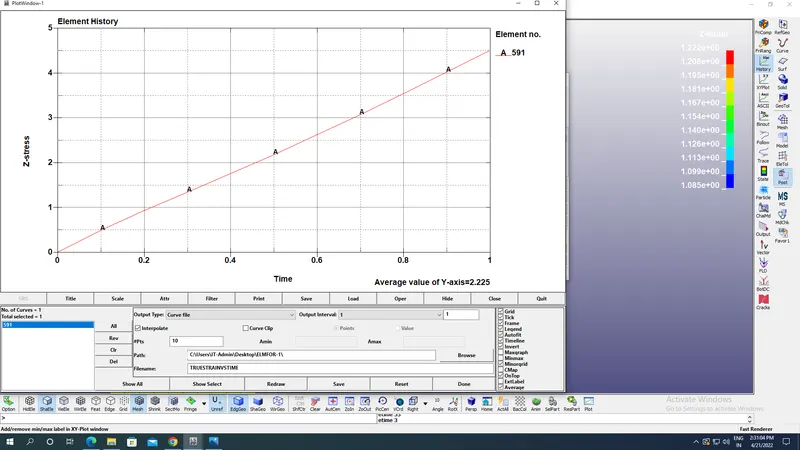
For this we first have to go to History-Select the elements & pick one element and plot the Z stress & strain garphs upto 10 time states and save them in your accessible file as shown in the image below:
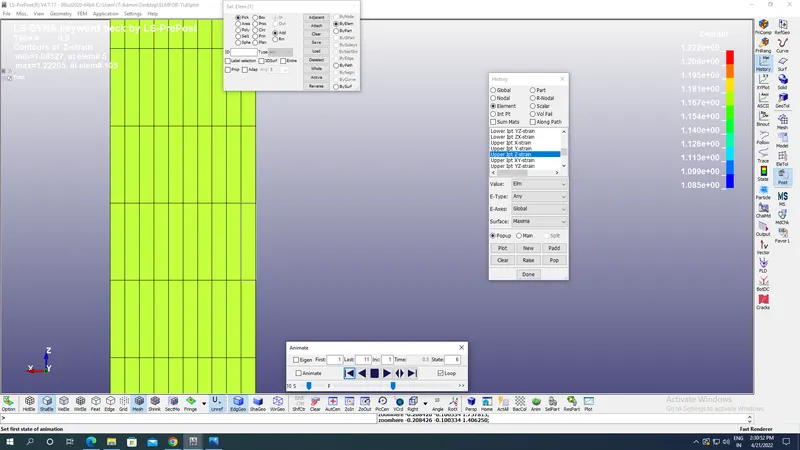
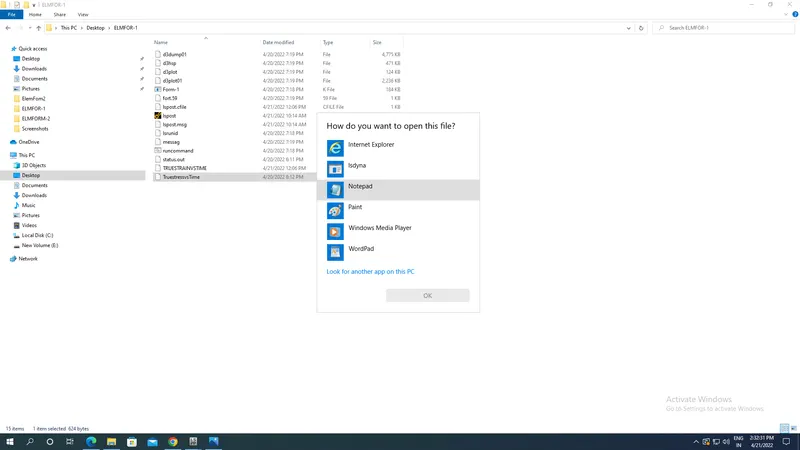
Open the save stress file in notepad format as shown in the figure below in order to plot that with time step in the excel sheets as shown in the image below:
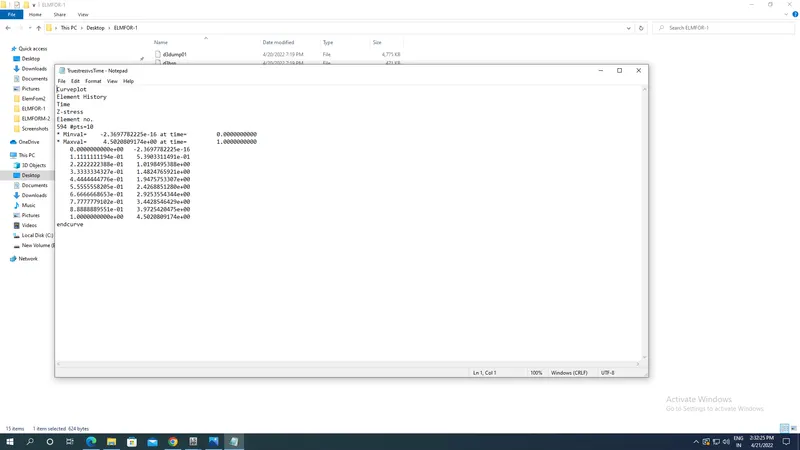
True strain vs time in Notepad format upro 10 time states:
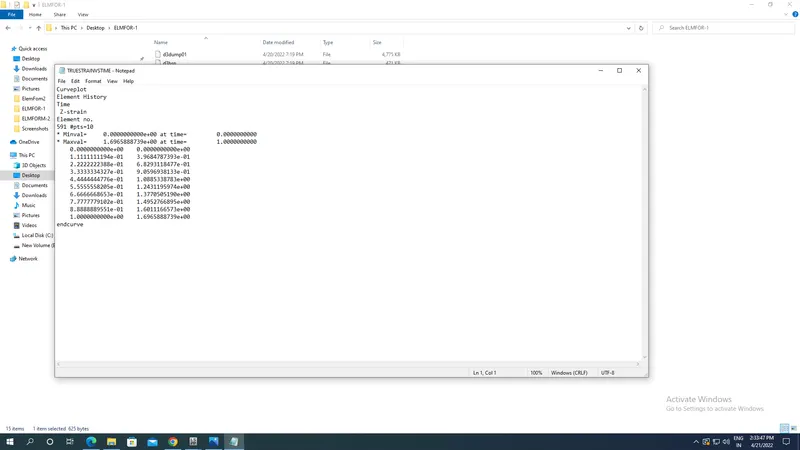
Go to excel sheet & plot all the data of Time,True Stress,True strain and calculate the Engineering stress,engineering strain & stretch ratio with respect to formula provided as shown in the image below:
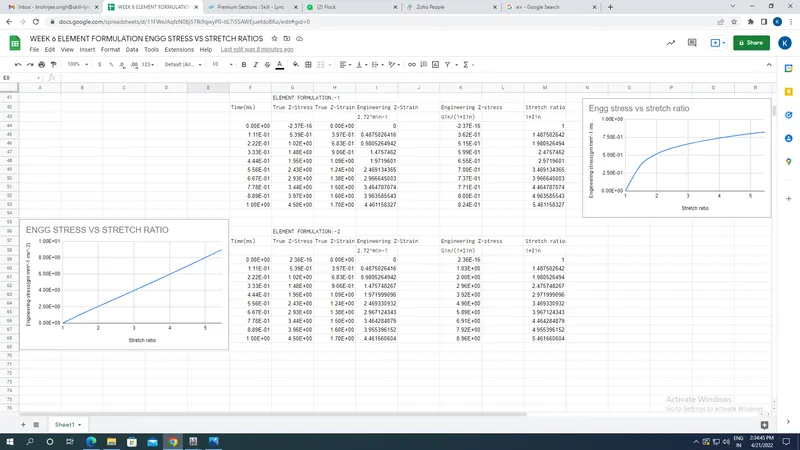
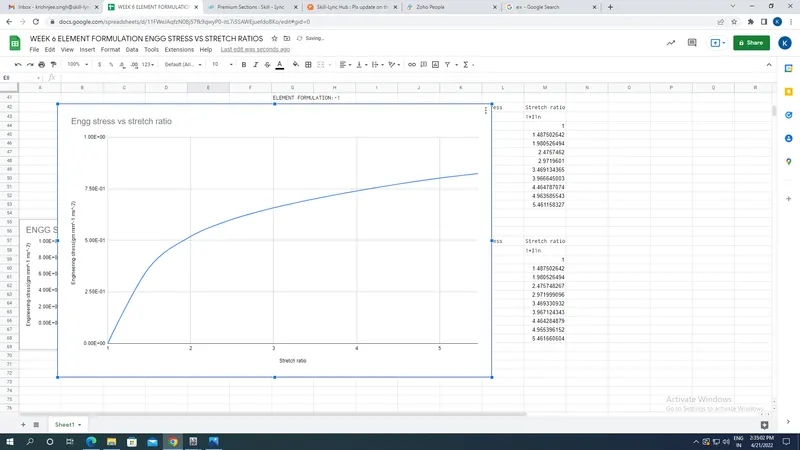
Now plot the graph of Engineering stress vs Stretch ratio by Insert option-Chart and smooth curves by selecting Stretch along X axis & Engineering stress along Y axis with proper units:
Element formulation:-2
True Z-stress vs time:
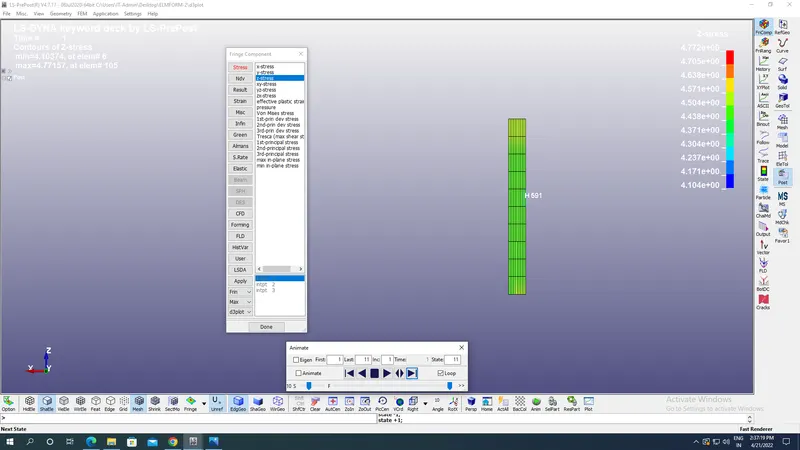
Maximum Z stress:4.772gm mm^-1 ms^-2.
True Z-strain vs time:
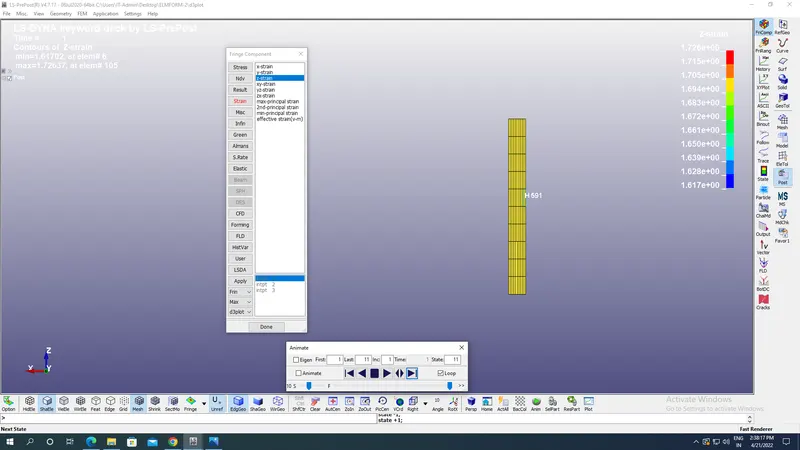
Maximum Z strain:1.726.
Calculation of Element Formulation=-1:
Engineering strain is calculated from true strain by formula as engineering strain=2.72^true strain-1.
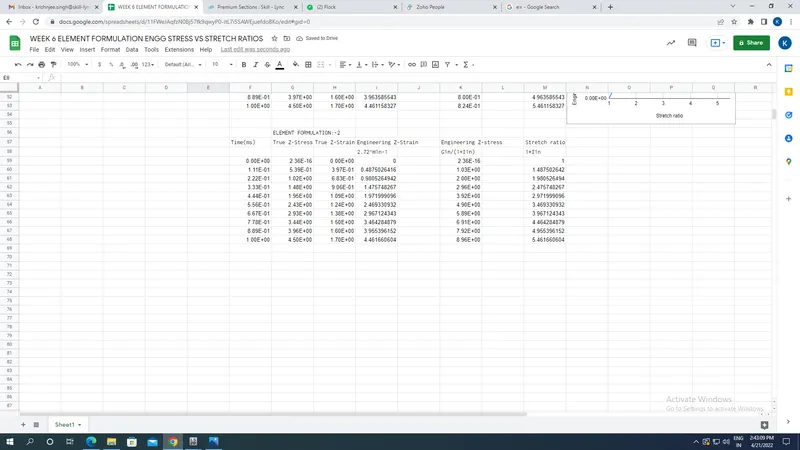
Engineering stress is calculated from true strain & True stress by formula as engineering stress=True stress/(1+Engineering strain).
Stretch ratio=1+Engineering Strain.
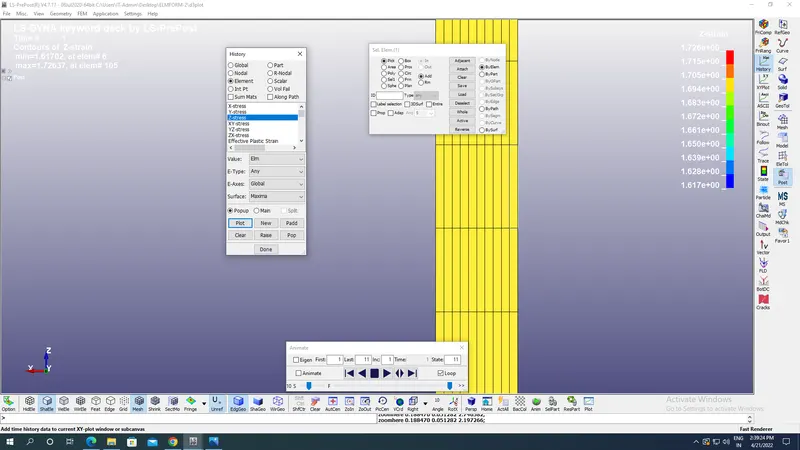
For this we first have to go to History-Select the elements & pick one element and plot the Z stress & strain garphs upto 10 time states and save them in your accessible file as shown in the image below:
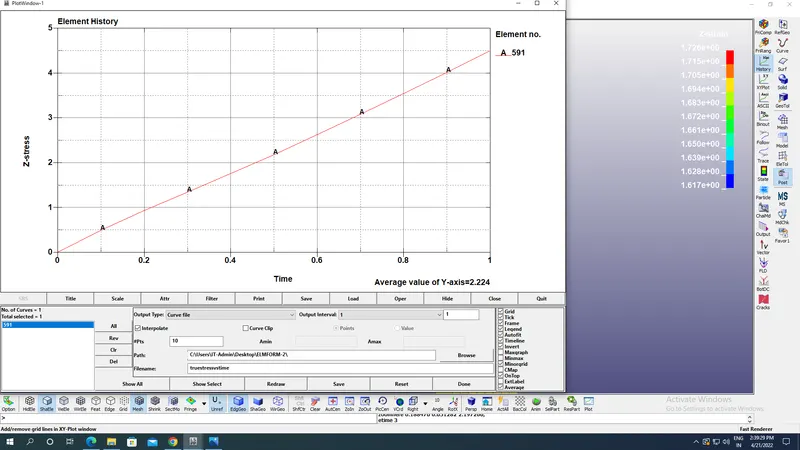
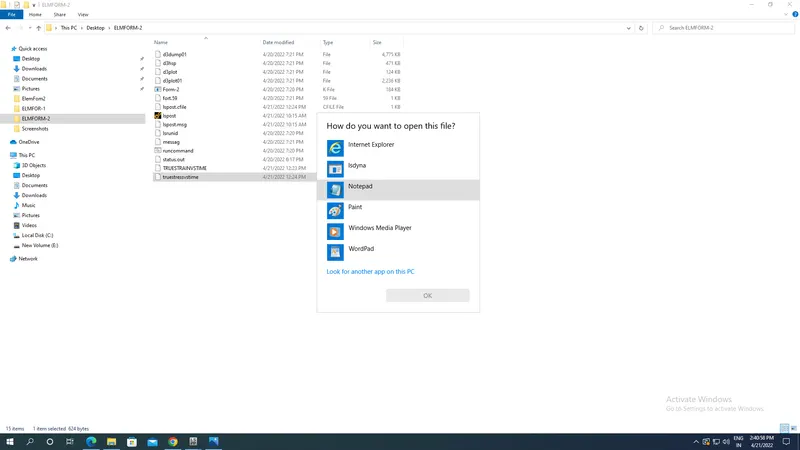
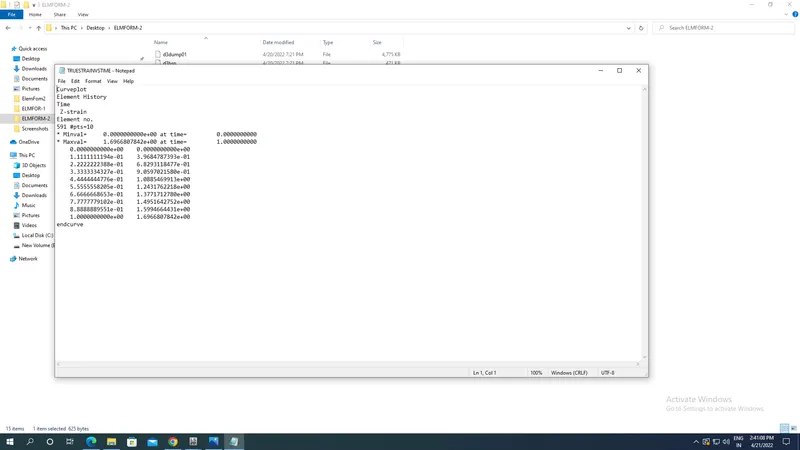
Open the save stress file in notepad format as shown in the figure below in order to plot that with time step in the excel sheets as shown in the image below:
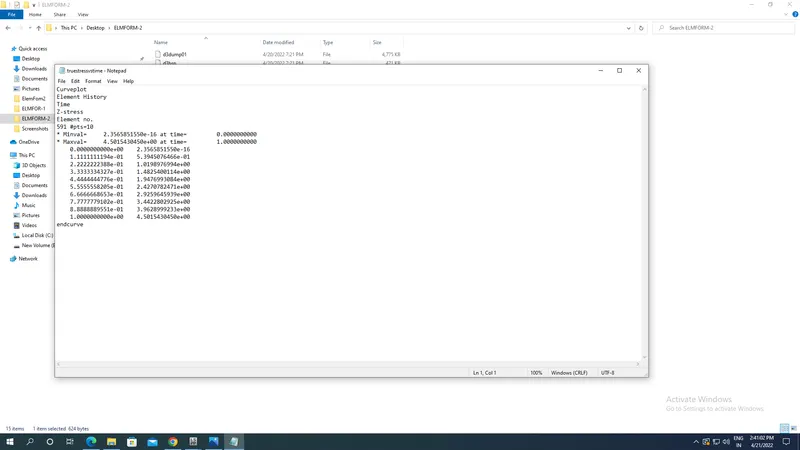
True strain vs time in Notepad format upro 10 time states:
Go to excel sheet & plot all the data of Time,True Stress,True strain and calculate the Engineering stress,engineering strain & stretch ratio with respect to formula provided as shown in the image below:
Now plot the graph of Engineering stress vs Stretch ratio by Insert option-Chart and smooth curves by selecting Stretch along X axis & Engineering stress along Y axis with proper units:
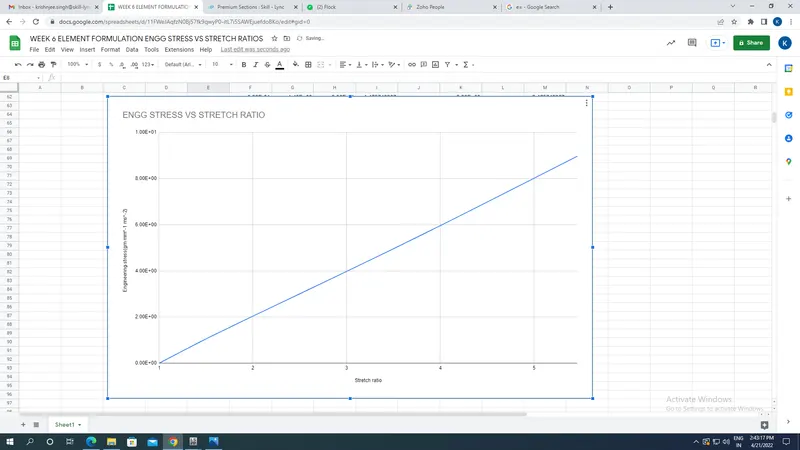
Comparision of Engineering stress vs stretch ratio graphs of Element formulation 1,2,-1.-2:
From the plots of graphs above we can observe that max Engineering stress occurs for element formulations of -2 which is 8 gm mm^-1 ms^-2 compared to other 3 element formulations so for this occurs because element formulation 1 had constant stress distribution at each nodes but element with formulation 2,-1,-2 have Shear locking due to which the stiffness in them is more compared to that element with elemet formulation 1. While in Element with formulation -1,-2 used when the element with formulation 2 is unstable in large deformations & poor Aspect ratios so element formulation -2 has more acurate formulation in order to neutralise for poor aspect ratios.
Conclusions:
The simulation in LS dyna with proper Pre & Post processing is doen and results of Engineering Stress vs Stretch ratio for differnet formulation is compared.