Assignment 3-2D Element Formulation Challenge
AIM:-To simulate the given component Case 1 and Case 2 as recommended element parameters using a radios solver.
OBJECTIVE:-
- To change the run time to 55 ms and to change the number of animation steps to 60.
- To run the case 1 simulation with recommended element parameters and to plot the graphs again.
- To check mass and velocity for kinetic energy.
- To check the energy error and mass error for the base simulation.
- To plot the graphs for rigid wall forces, internal energy, hourglass energy, contact energy, and total energy.
- To run the case 2 simulations with recommended element parameters and to plot the graphs again.
- To check the energy error and mass error for the base simulation.
- To plot the graphs for rigid wall forces, internal energy, hourglass energy, contact energy, and total energy.
- Comparing both the cases and tabulating the results.
PROCEDURE:-
*The import of the model is been done by Model components for assignment 3 as shown in fig1.1.
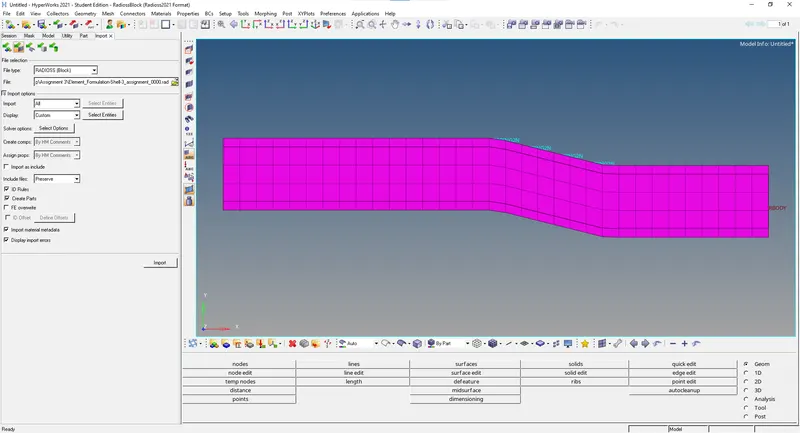
Fig1.1
*The unit parameter is checked for the units which the solver has saved for the simulation of the engine file as shown in fig 1.2.
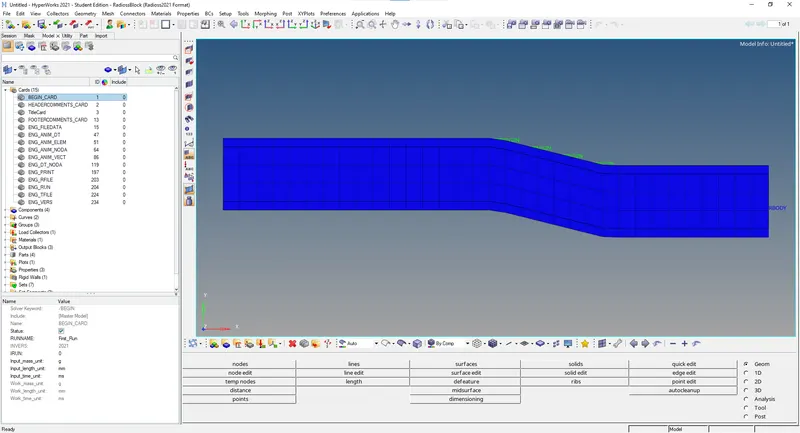
fig1.2
*From the Eng_Run the time step is been updated as the mentioned 55ms as shown in fig 1.3.
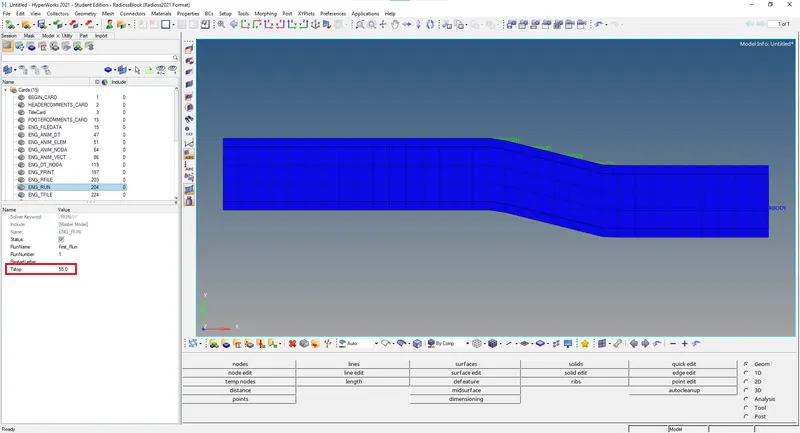
fig1.3
*For the animation file the T frequency is calculated by Δtc/ no of animations(60)=0.9166 has been updated as shown in fig 1.4.
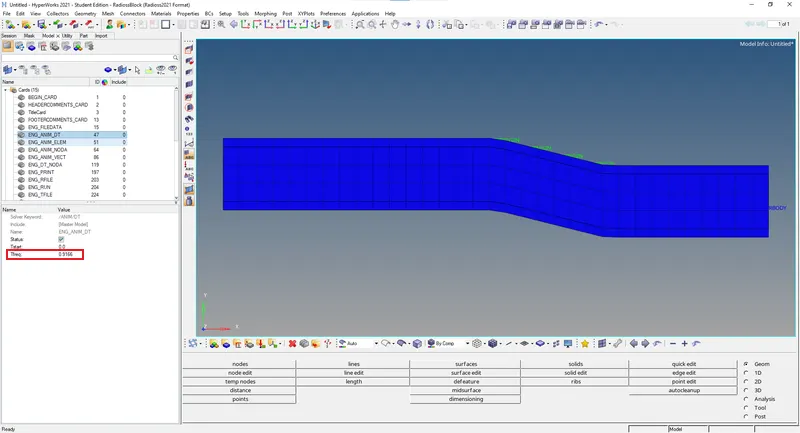
fig1.4
*The material properties are checked and verified for the closeout panel material with its specified units as shown in fig 1.5.
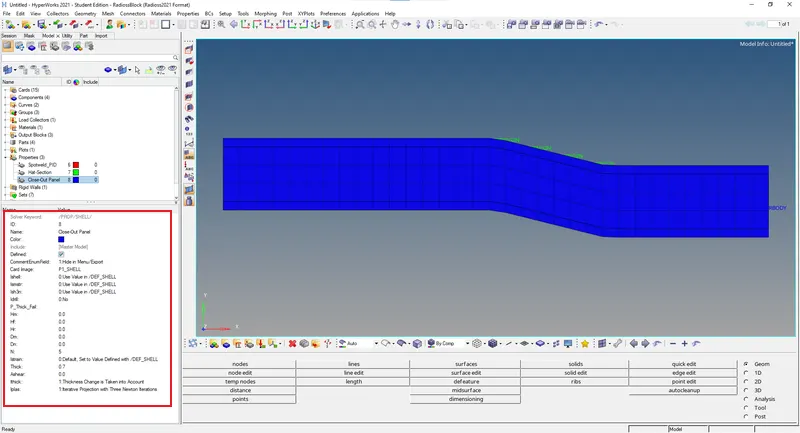
fig1.5
*The model is analyzed using Radios and a separate folder is created to save the animation files as shown in fig 1.6.
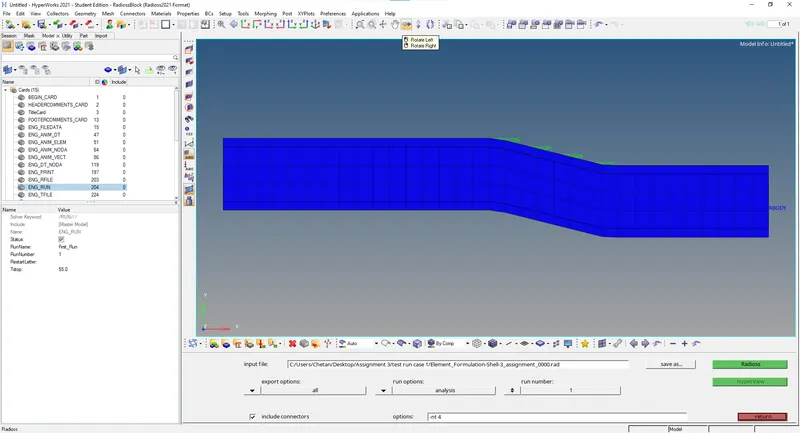
fig1.6
*The rad file is created and the simulation has been run by the solver and stored as shown in fig 1.7.
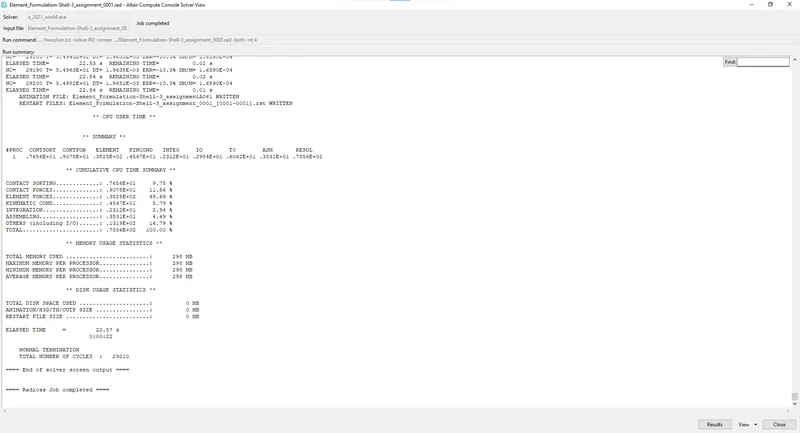
fig1.7
*The amination files were created and checked that there are 60 files created as shown in fig 1.8.
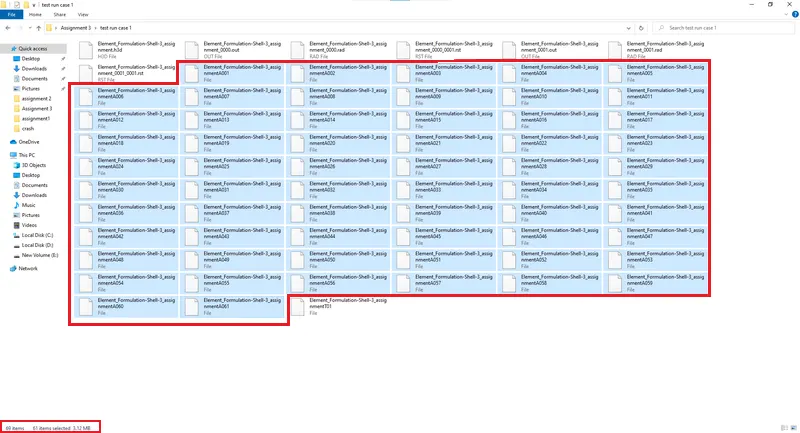
fig1.8
*Engine Output File [00001. out] has been generated after analysis. The Engine Output File [00001. out] contains the data of the analyzed errors as shown in fig 1.9.
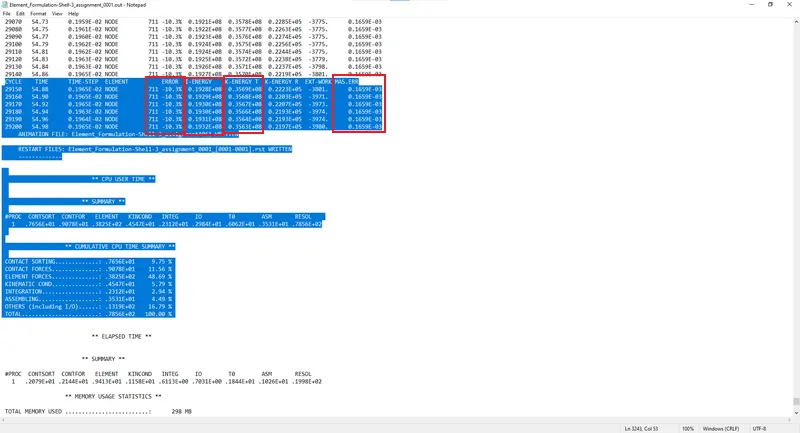
fig1.9
*From the tools we can determine the mass and from IVEL FILE initial velocity. This can be used for kinetic energy calculations as shown in fig 1.10.
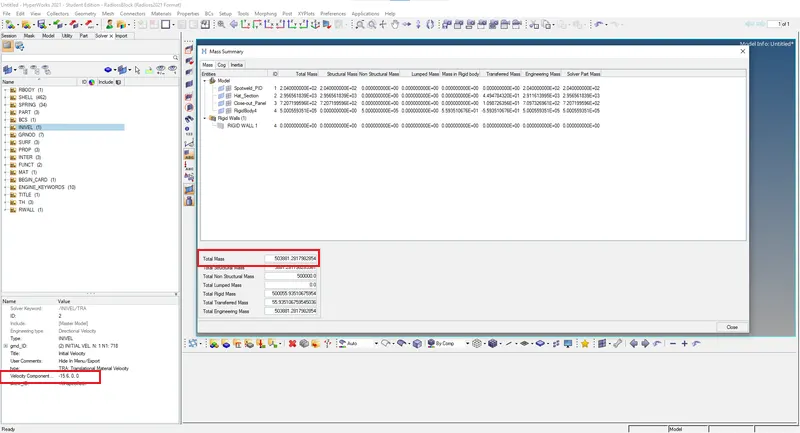
fig 1.10
*The hyper view for the h3d file and by contour plot simulation of Von Mises and displacement is animated as shown in fig 1.11.
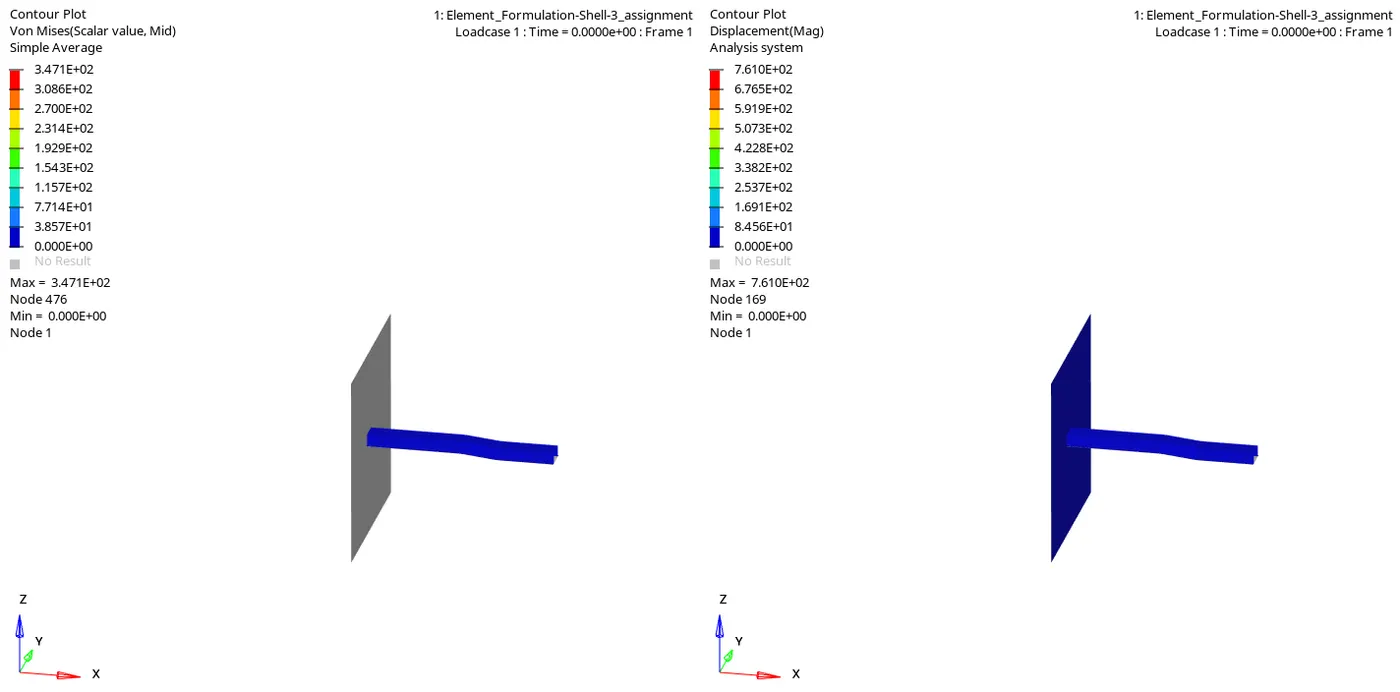
fig 1.11
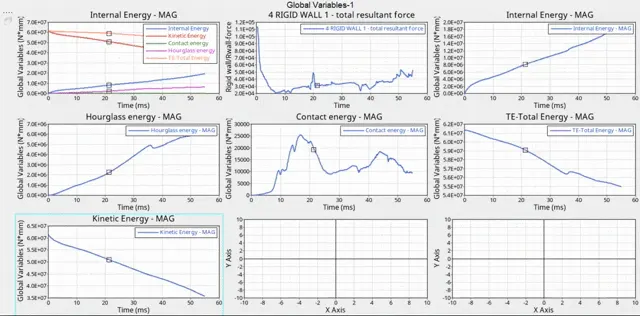
*Hypergraph 2D mode is turned on and graphs have been plotted for Internal energy, Kinetic energy, Hourglass energy, Contact energy, and total energy graphs concerning global variables as shown in fig 1.12.
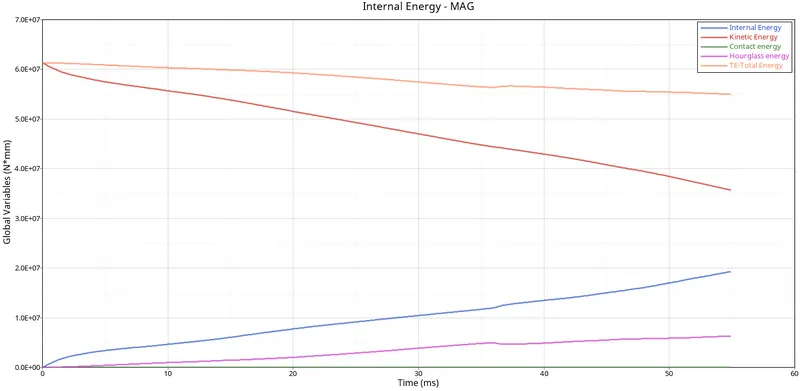
fig 1.12
*The graphs have been animated to show the simulation and graphs at each frame and the direction of the energy plot in comparison to each other as shown in fig 1.13.
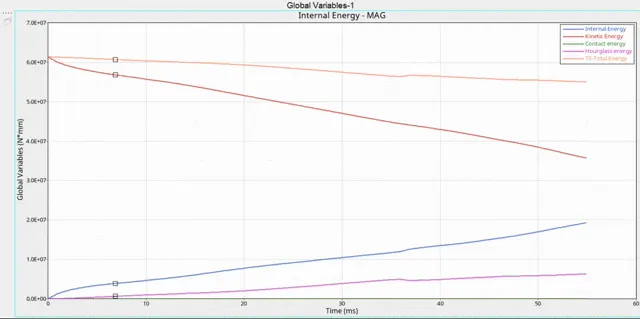
fig1.13.
*At initial the there will be no impact but the solver does not record so the resultant force will be high and reaches a stability region and starts the recording in impact and deformation with respect to time. The graph has been plotted for rigid wall force and time as parameters as shown in fig 1.14.
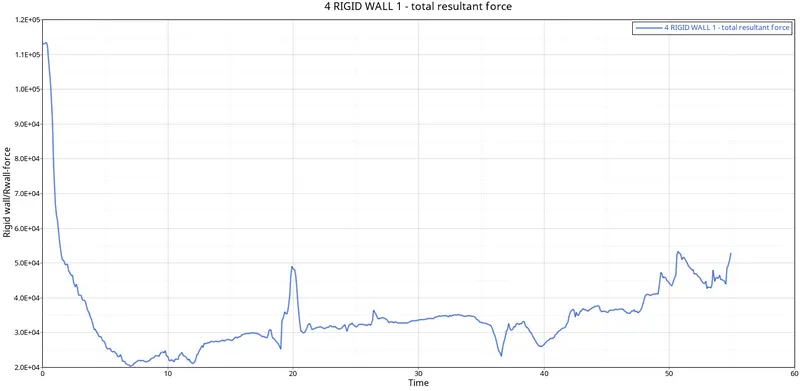
fig 1.14
*At initial the there will be no impact so the internal energy will be at zero and then as the deformation starts internal energy increases with respect to time. The graph has been plotted for Internal energy and time as parameters as shown in fig 1.15.
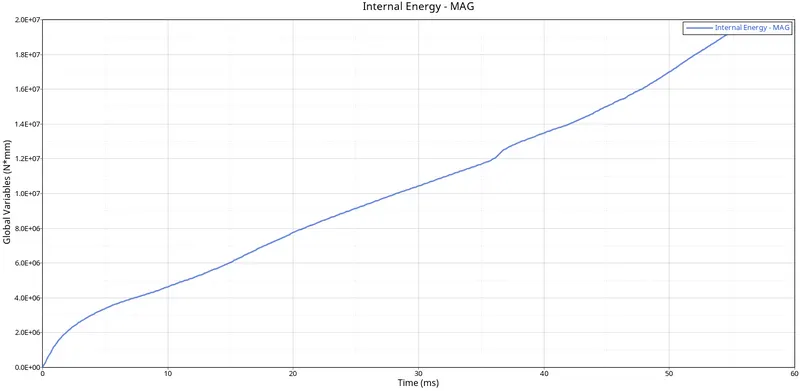
fig 1.15
*At initial the there will be no impact so the Hourglass energy will be at zero and then as the deformation starts Hourglass energy increases with respect to time. This happens due to the hourglass being artificial energy created so that the energies are balanced out and no error in the simulations. This can be avoided with Stiffness can be added to the reduced integration element at the material level where this hourglass is occurring. In most of the solvers, this is done automatically provided you have activated the card. Also by using the fully integrated elements this Hourglass deformation can be avoided. The graph has been plotted for Hourglass energy and time as parameters as shown in fig 1.16.
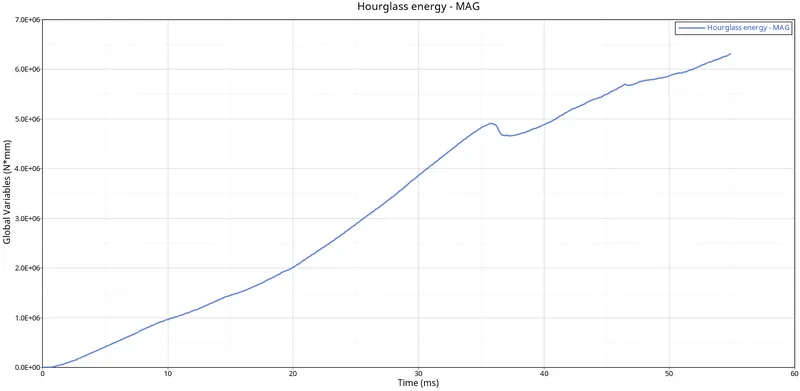
fig1.16
*At initial the there will be no impact so the Contact energy will be at zero and then as the deformation starts internal energy increases with respect to time. The graph has been plotted for Contact energy and time as parameters as shown in fig 1.17.
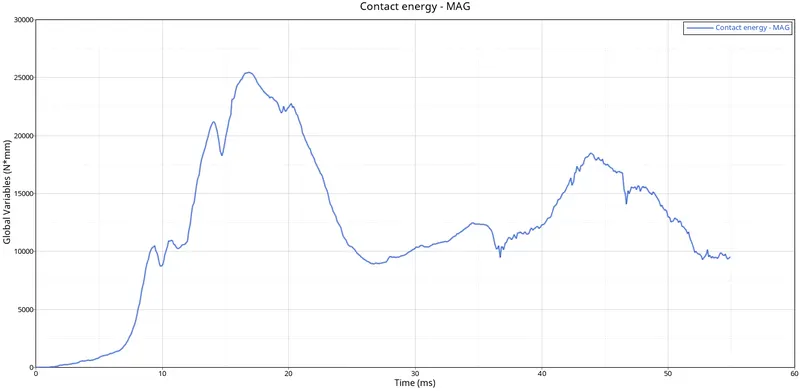
fig1.17
*Since Total energy is the summation of all the energies so at the start there will only be Kinetic energy so the total energy will be equal until the deformation starts Total energy averages all energies with respect to time. The graph has been plotted for Total energy and time as parameters as shown in fig 1.18.
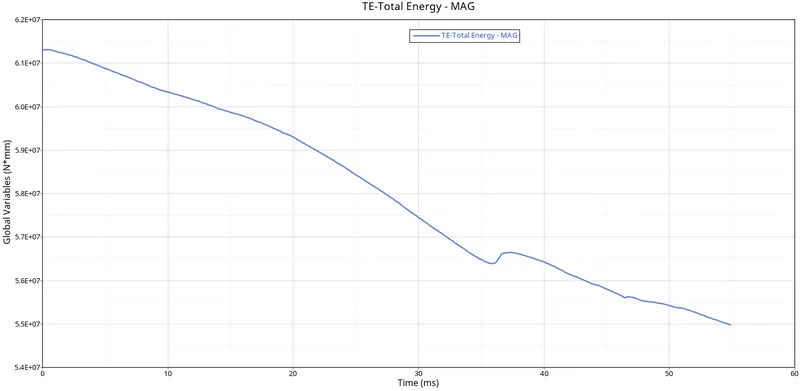
fig 1.18
* Kinetic energy is high and then decreases, due to there being`(1/2)*Mv^2` a velocity applied to the component, so it's getting deformed and the kinetic energy decreases the graph has been plotted for Kinetic energy and time as parameters as shown in fig 1.19.
The formula for Kinetic Energy=`1/2*Mv^2`
Given Data
Mass=503881.28179 g
Velocity=15.6 `(mm)/(ms)`
K.E=`1/2*503881.28179*(15.6)^2`
K.E=6.131x`10^7`N.mm
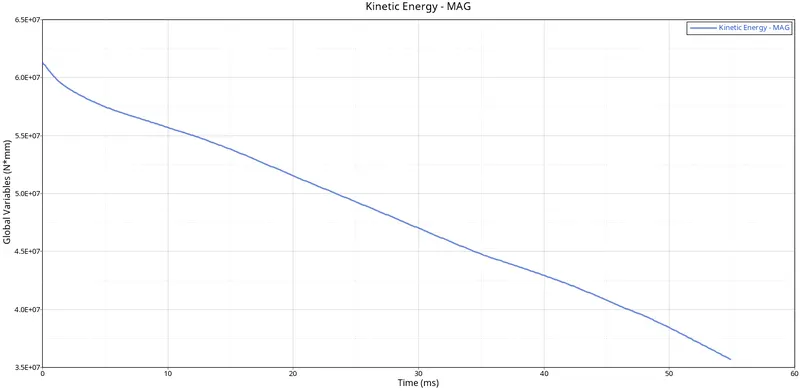
fig1.19
*The graphs have been animated to show the simulation and graphs at each frame and the direction of the energy plot in comparison to each other as shown in fig 1.20.
CASE2
*The material properties are updated with Ishell =24, Ismstr=2, Ish3n=2, N=5, and Iplas=1 and verified for the hat section and closeout panel material with its specified units for Case 2 simulation as shown in fig 1.21a and fig 1.21b.
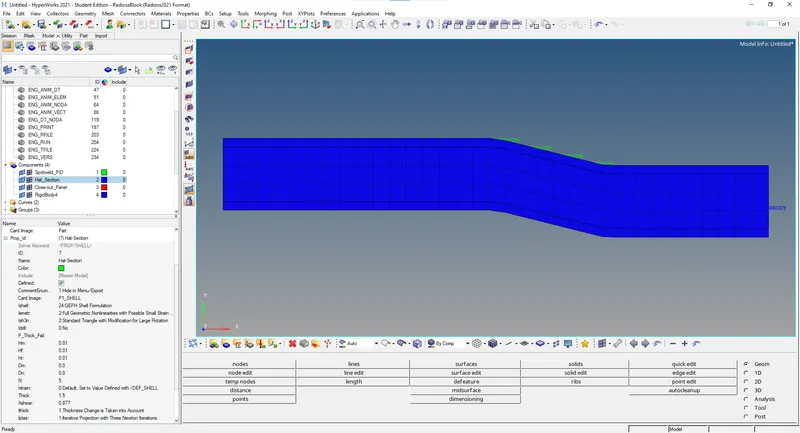
fig 1.21a
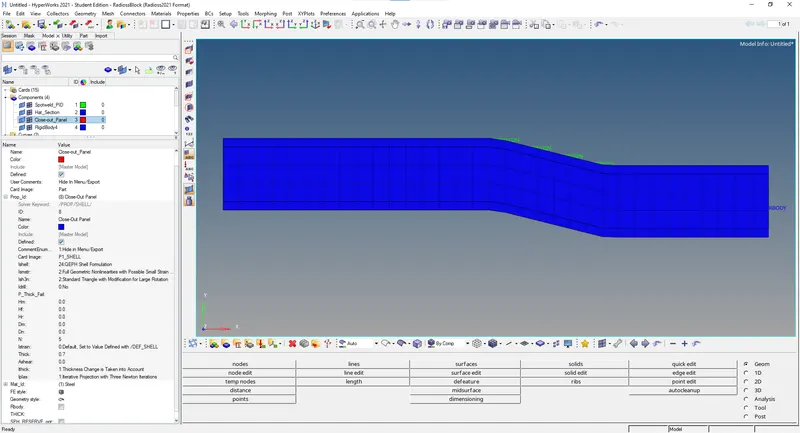
fig 1.21b
*Engine Output File [00001. out] has been generated after analysis. The Engine Output File [00001. out] contains the data of the analyzed errors as shown in fig 1.22.
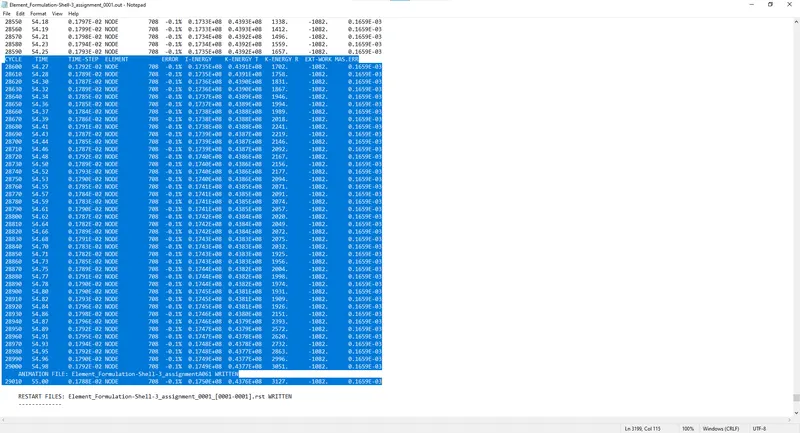
fig 1.22
*The hyper view for the h3d file and by contour plot simulation of the displacement and Von Mises is animated for Case 2 as shown in fig 1.23.
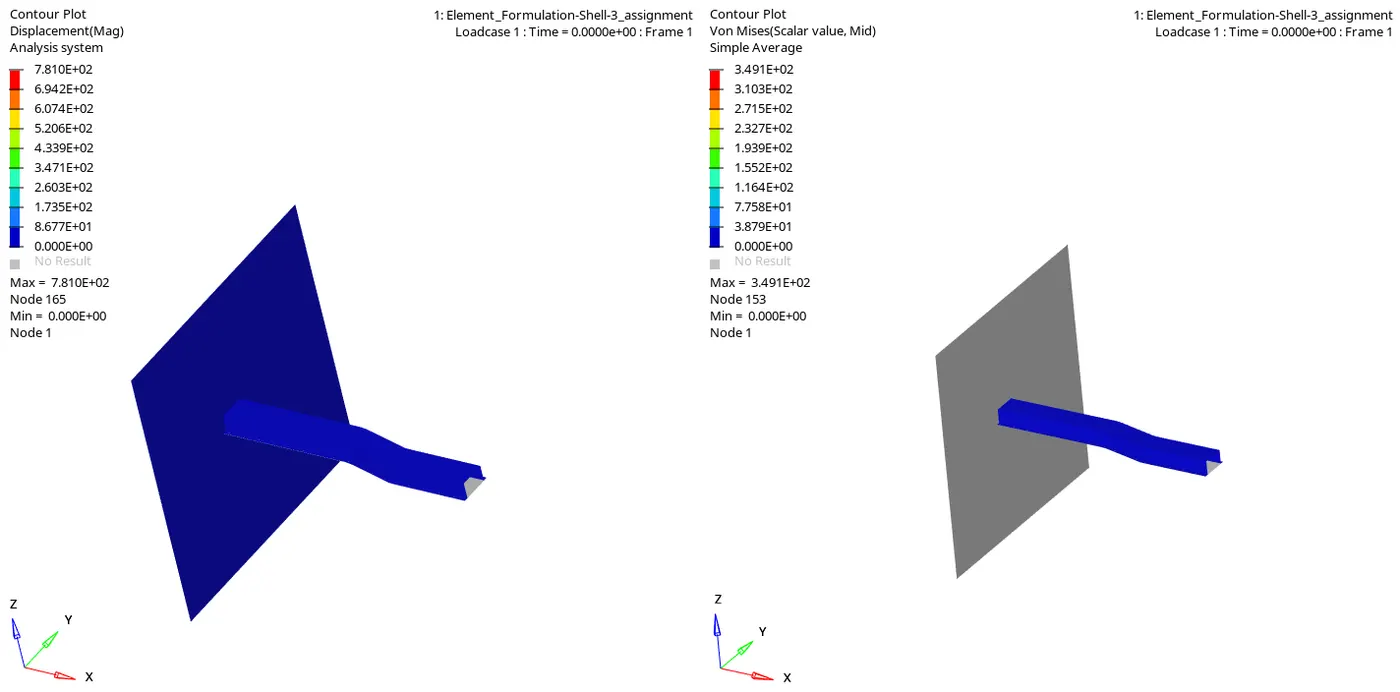
Fig1.23
*Hypergraph 2D mode is tur on and graphs have been plotted for Internal energy, Kinetic energy, Hourglass energy, Contact energy, and total energy graphs concerning global variables for Case 2 as shown in fig 1.24.
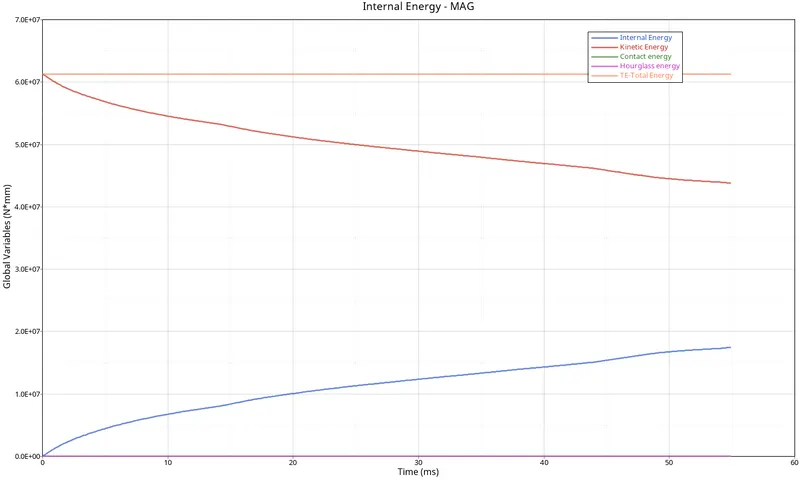
fig1.24
*The graphs have been animated to show the simulation and graphs at each frame and the direction of the energy plot in comparison to each other as shown in fig 1.25.
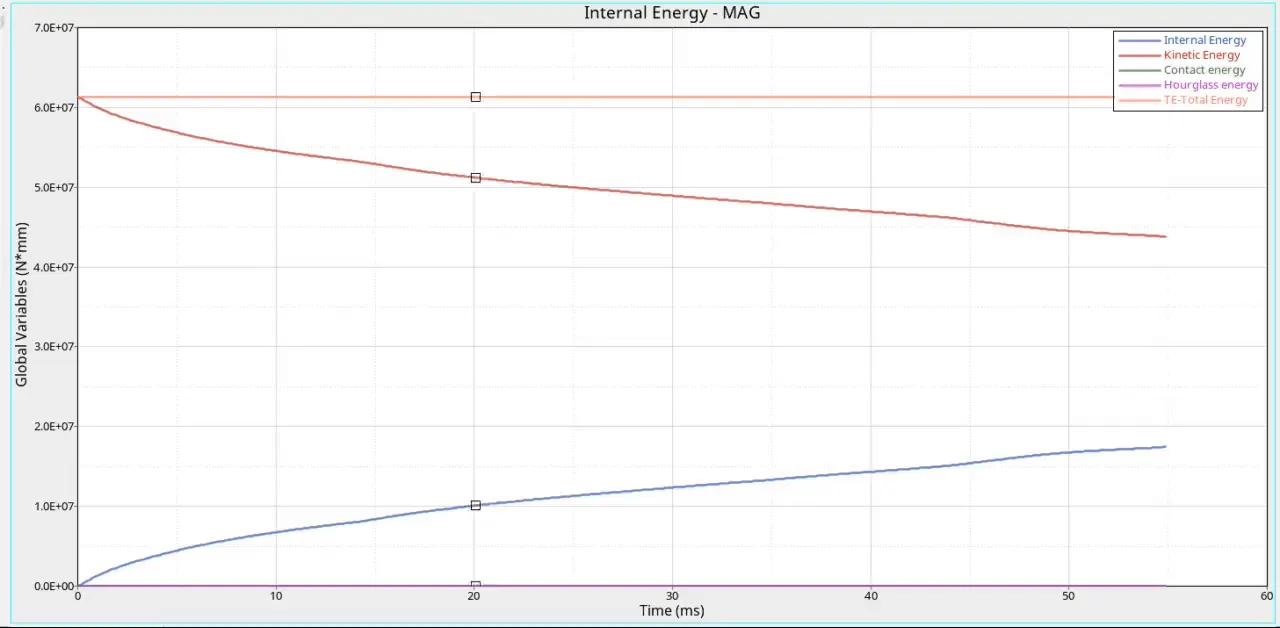
fig1.25
*At initial the there will be no impact but the solver does not record so the resultant force will be high and reaches a stability region and starts the recording in impact and deformation with respect to time. The graph has been plotted for rigid wall force and time as parameters as shown in fig 1.26.
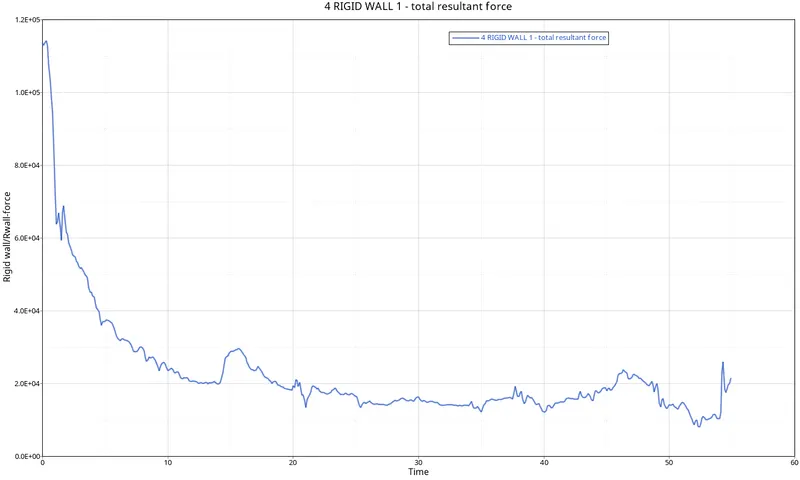
fig 1.26
*At initial the there will be no impact so the internal energy will be at zero and then as the deformation starts internal energy increases with respect to time. The graph has been plotted for Internal energy and time as parameters as shown in fig 1.27.
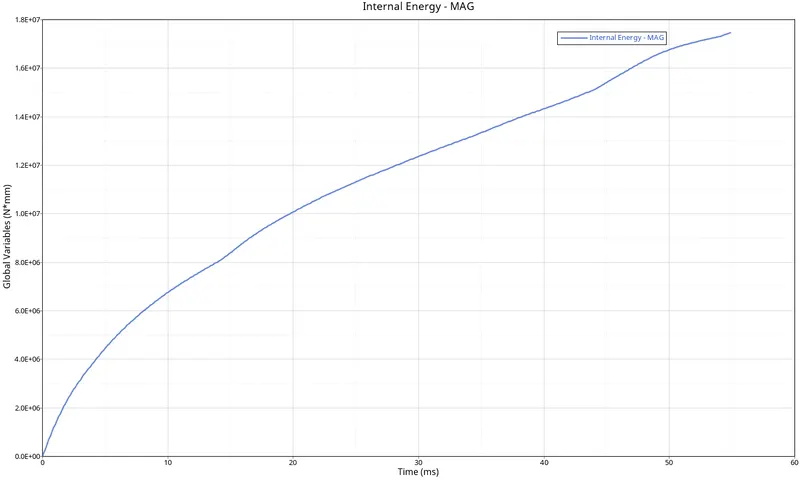
fig 1.27
*For this case the Hourglass energy is zero because of the usage of the property parameters Ishell =24, Ismstr=2, Ish3n=2, N=5, and Iplas=1. The graph has been plotted for Hourglass energy and time as parameters as shown in fig 1.28.
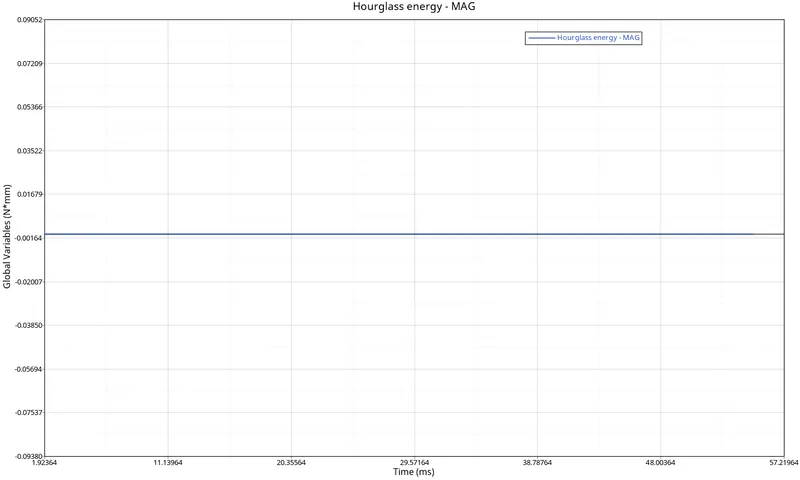
fig1.28
*At initial the there will be no impact so the Contact energy will be at zero and then as the deformation starts internal energy increases with respect to time. The graph has been plotted for Contact energy and time as parameters as shown in fig 1.29.
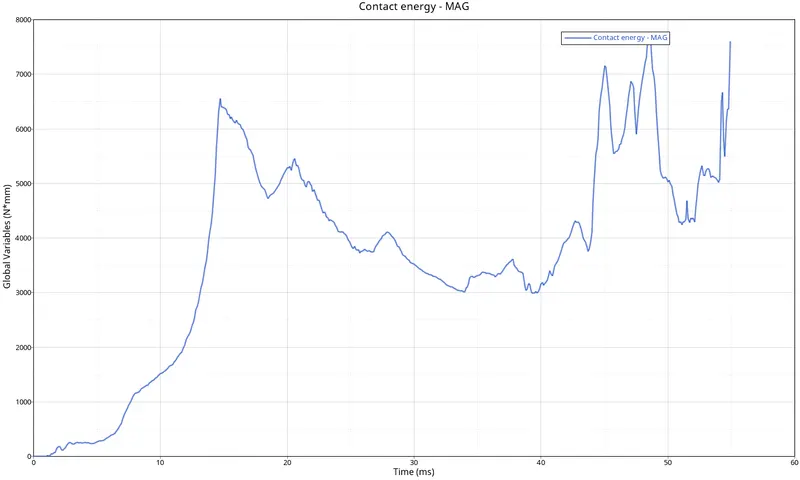
fig1.29
*Since Total energy is the summation of all the energies so at the start there will only be Kinetic energy so the total energy will be equal until the deformation starts Total energy averages all energies with respect to time. The graph has been plotted for Total energy and time as parameters as shown in fig 1.30.
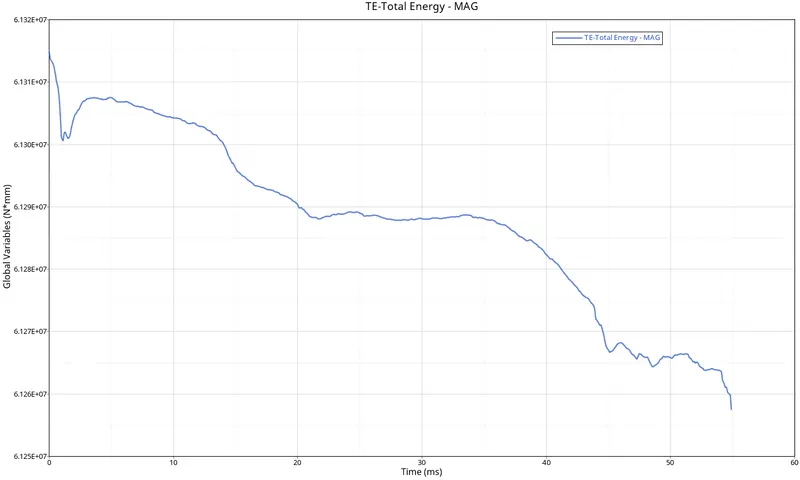
fig 1.30
*The Kinetic Energy is the same as in both the case because the material properties are the same so no change in mass or initial velocity values. The graph has been plotted for Kinetic energy and time as parameters as shown in fig 1.31.
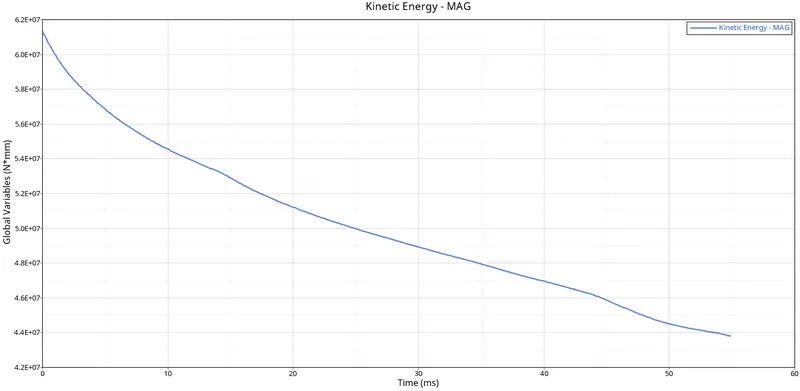
fig 1.31
*The Deformation of the model and graphs have been animated to show the simulation and graphs at each frame and the direction of the energy plot in comparison to each other as shown in fig 1.32.
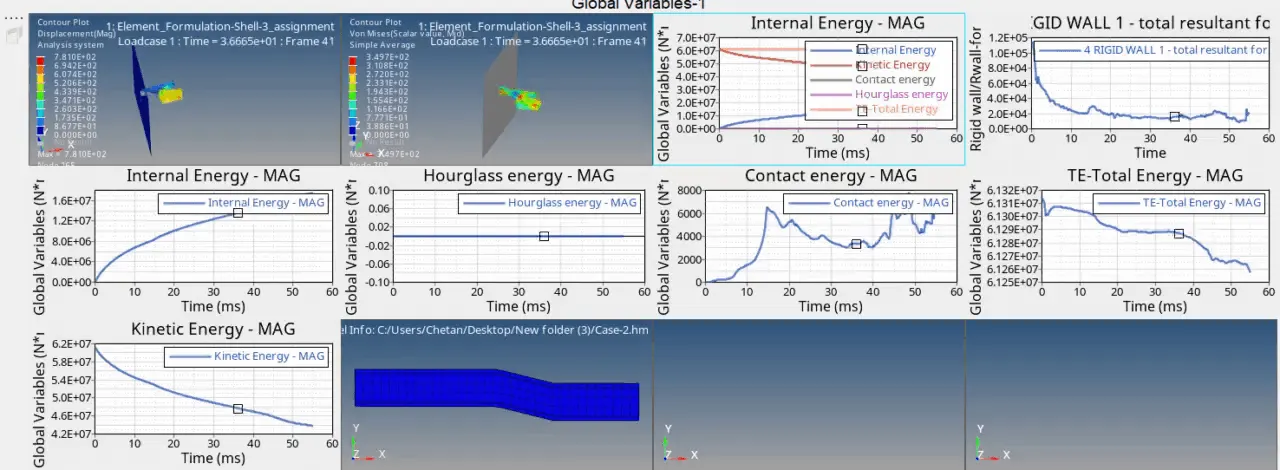
fig1.32
COMPARISION
| CASE 1 | CASE 2 |
|
PROPERTY CARD NOT CHANGED |
PROPERTY CARD UPDATED WITH RECOMMENDED PARAMETERS ENERGY |
| ENERGY ERROR:- -10.3% | ENERGY ERROR:- -0.1% |
| I ENERGY ERROR:-0.1932`E^08` | I ENERGY ERROR:- 0.175E^08 |
| KINETIC ENERGY ERROR:-0.3563E^08 | KINETIC ENERGY ERROR:-0.4376E^08 |
| MASS ERROR:- 0.1659`E^-3` | MASS ERROR:-0.1659`E^-3` |
| HOUR GLASS IS PRESENT TO BALANCE THE ENERGIES | HOUR GLASS IS ZERO. |
RESULT:-The given is been simulated for the given component Case 1 and Case 2 as recommended element parameters. Conture and Graphs were plotted for both the cases.