Assignment 7-Side Pole Crash Simulation Challenge
AIM:-To simulate the model to perform Side Pole crash and observe the deformations and plot the graphs for all the mentioned requests and energies.
OBJECTIVE:-
- To Check the unit system and either follow[Mg mm s] or [Kg mm ms].
- To Compare the model weight with the full-scale 300k nodes model and use added masses to reach the target weight of 700kg while getting CG about the required range.
- To Create an appropriate interface, friction 0.2, and recommended parameters.
- Make sure of no penetrations and intersections.
- To Correct rigid bodies if any issues.
- To Create a rigid wall with friction 0.1.
- To Create an inivel solver card Initial velocity 20 mph (8.9408 mps).
- To Check Time-step to be 0.5 to 0.1 microseconds and Run 80 ms.
- To Output requests for Sectional force in the cross member.
- To Output requests Intrusion at B pillar, hinge pillar, and fuel tank region.
- To Output requests for Peak velocity of the inner node of the door 337773.
- To use model checker to ensure good quality.
- The simulations are run on hyper view for displacement and Von Mises.
- To plot the graphs by using hypergraph 2D for rigid wall forces, internal energy, hourglass energy, contact energy, and total energy.
- To plot the graphs by using hypergraph 2D for all the output requests.
- To plot the graphs by using hypergraph 2D for rigid wall forces, internal energy, hourglass energy, contact energy, and total energy individually for better understanding.
- To check the energy error and mass error for the base simulation.
THEORETICAL EXPLANATION:-
In 1990, the agency amended its side impact protection standard (FMVSS 214) by adding a new dynamic test applicable to passenger cars. In 1995, the dynamic test was extended to most light trucks with a gross vehicle weight rating (GVWR) of 2,722 kg (6,000pounds) or less. This test currently protects against thoracic and pelvic injuries in a moving deformable barrier test simulating a moving vehicle being struck in the side at 90 degrees by another moving vehicle. Side impact dummies (the SID dummy representing a 50th percentile male) are positioned in the front and rear seat on the side of the vehicle struck by the moving deformable barrier as shown in fig 1.1.
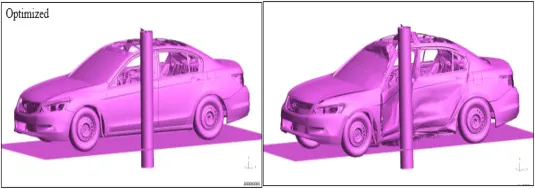
fig 1.1
- Head injuries are a major cause of fatalities in side impacts, whereas chest injuries are the predominant cause of AIS 3-5 non-fatal injuries. However, there is no head injury requirement in the dynamic FMVSS No. 214 test. Typically, the moving deformable barrier hits below the dummy’s head, the window breaks, the dummy’s head goes out the window but does not strike the barrier. Thus, the measured head injury criterion (HIC)tends to be low in this dynamic test. Yet, in the real world, many people are killed or seriously injured by head injuries in side impacts.
- The oblique pole test requires protection for the head, chest, abdomen, and pelvis at a vehicle delta-V of 32.2 kph (20 mph). For this analysis, it is assumed that manufacturers will choose a head and torso airbag system to meet the requirements as shown in fig 1.2.
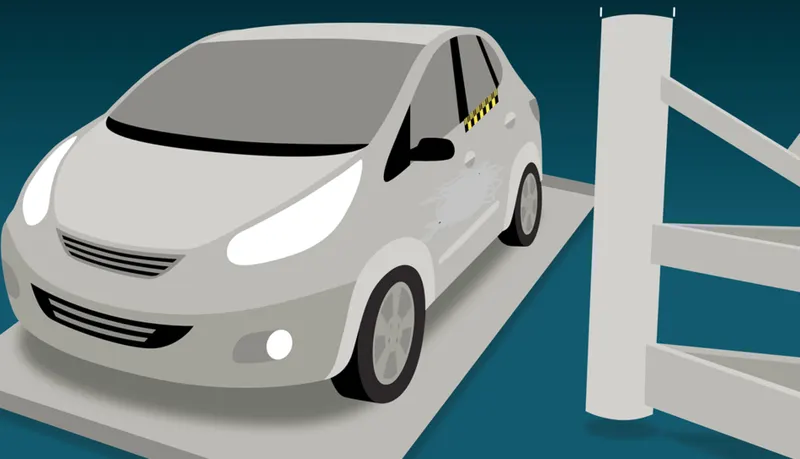
fig 1.2
PROCEDURE:-
*The unit system is been checked to start the simulation in hypercrash as shown in fig 1.3.
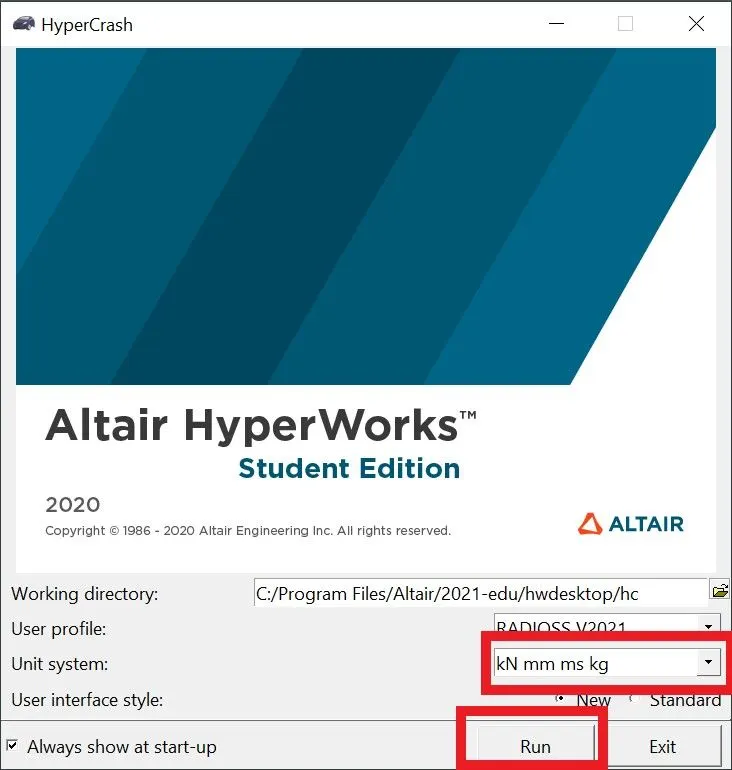
fig 1.3
*The model has been imported by drag and drop method as shown in fig 1.4.
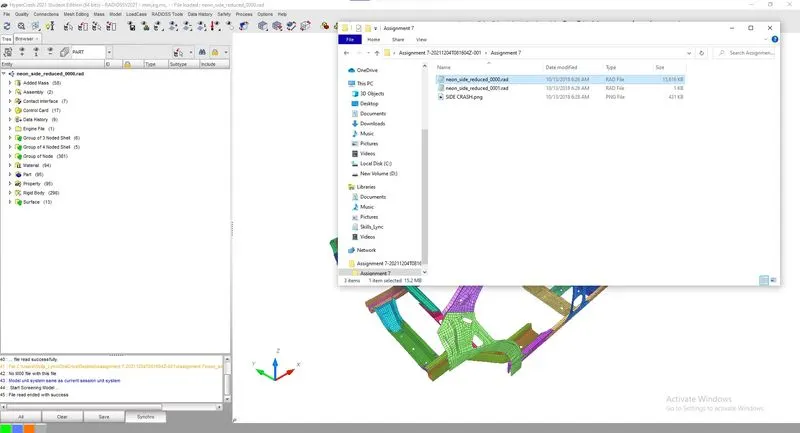
fig 1.4
*The mass balancing is been checked and the COG is also in the initial as shown in fig1.5 and can add the mass of 700 kg as mentioned in the task.
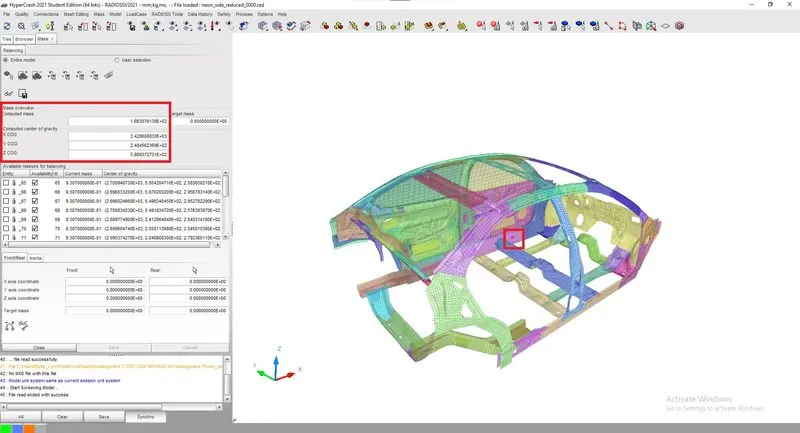
fig1.5
*The model has been imported from hypercrash to hpypermesh so all solver cards are been updated as shown in fig 1.6.
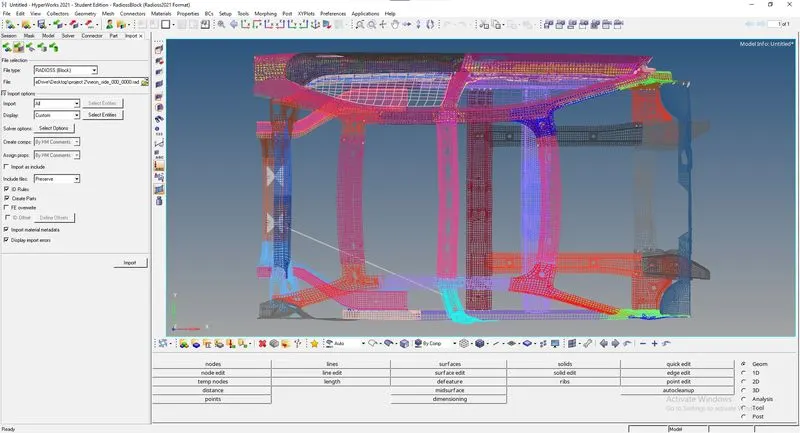
fig1.6
*From the Eng_Run time is been updated as the mentioned 80 ms as shown in fig 1.7.
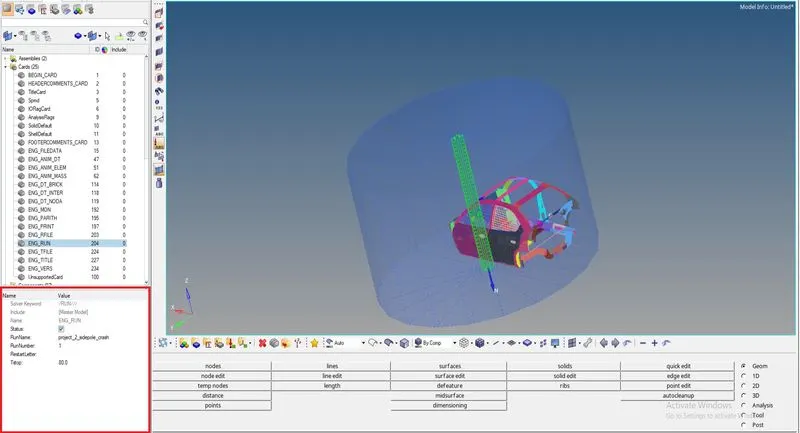
fig1.7
*From the ENG_DT BRICK, ENG_DT INTER, ENG_DT NODA the time step is been updated as the mentioned 0.5 and 0.1 microseconds as shown in fig 1.8.
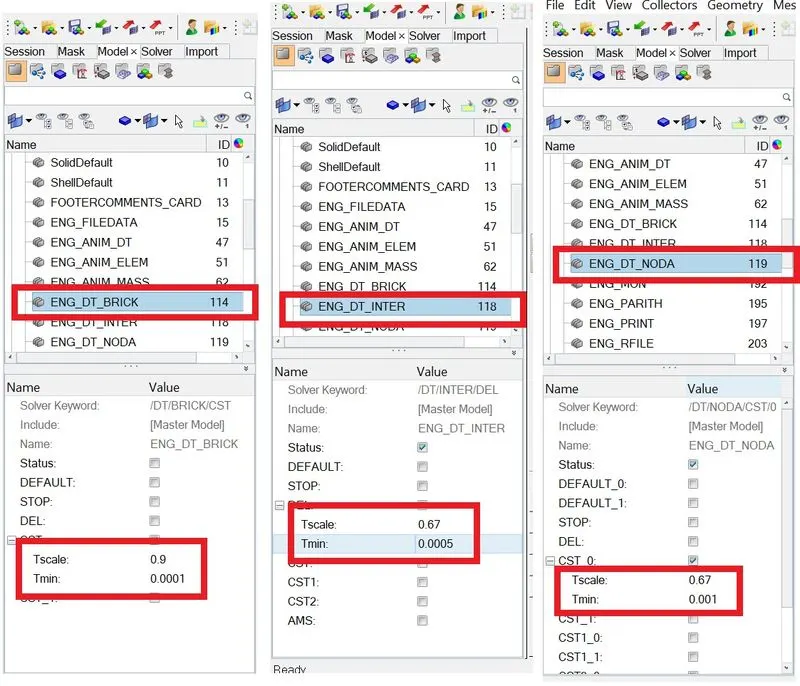
fig1.8
*The Initial velocity value is been added by selecting the create, boundary conditions,inivel, and adding initial velocity of 8.9408 in Y-axis coordinates as shown in fig 1.9
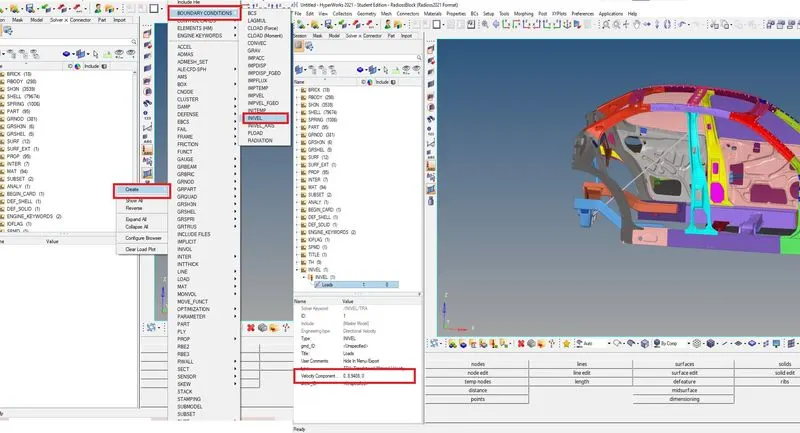
fig1.9
*The rigid wall is been created with all parameters mentioned by selecting the node for wall location and normal as shown in fig 1.10.
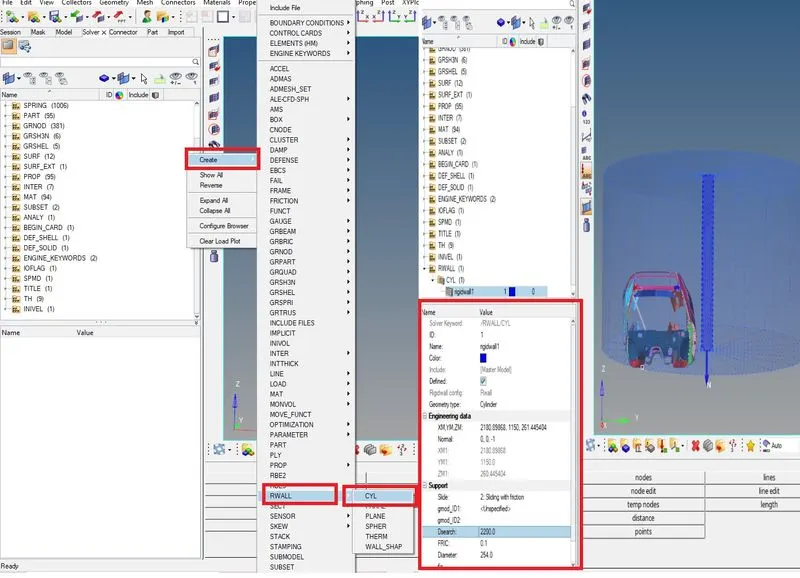
fig 1.10
*The section is created in the mentioned region to provide a time history so the force acting in the regions can be recorded as shown in fig 1.11.
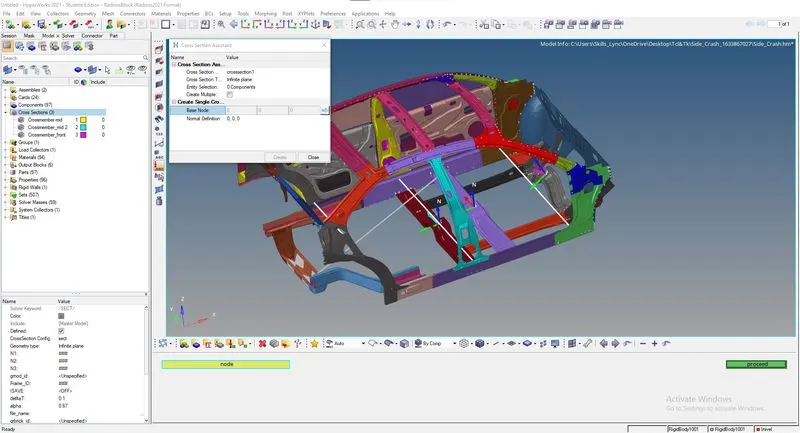
fig1.11
*The time history is created in the mentioned region to provide Peak velocity on node 337773 can be recorded as shown in fig 1.12.
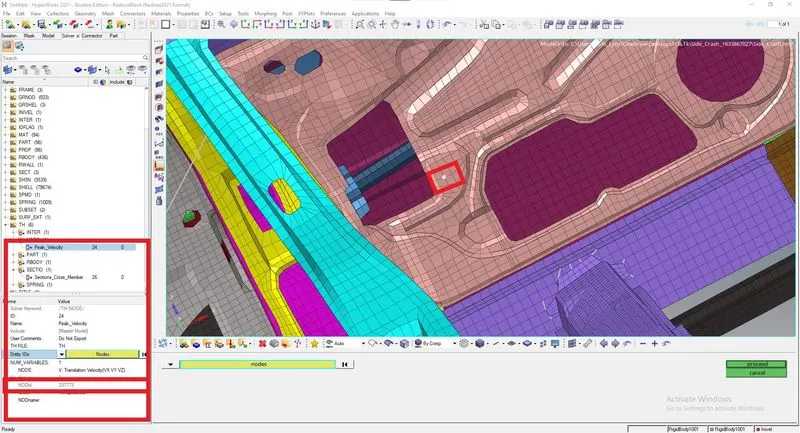
fig1.12
*The Spring elements are created in the driver cross-member panel, B-Pillar cross-member panel, and Fuel tank cross-member panel to provide a time history so the Intrusions in the regions can be recorded as shown in fig 1.13.
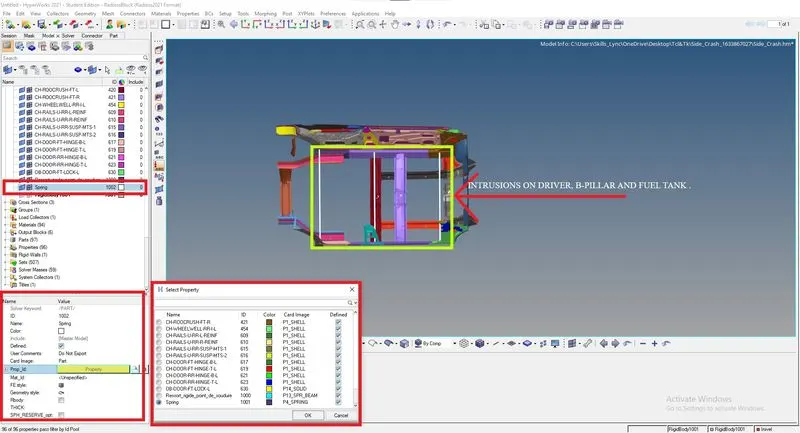
fig1.13
*The mass is added strategically to make sure the overall weight of the car is not exceeding 700kg and distribution of weight concentrating on the driver and passenger compartment as shown in fig 1.14.
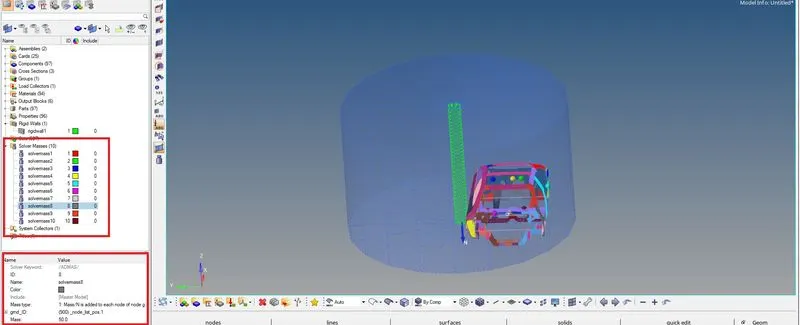
fig1.14
*The mass balancing panel shows the final mass to the system and the location of the COG, the COG is bove the center cross member for better simulation as shown in fig 1.15.
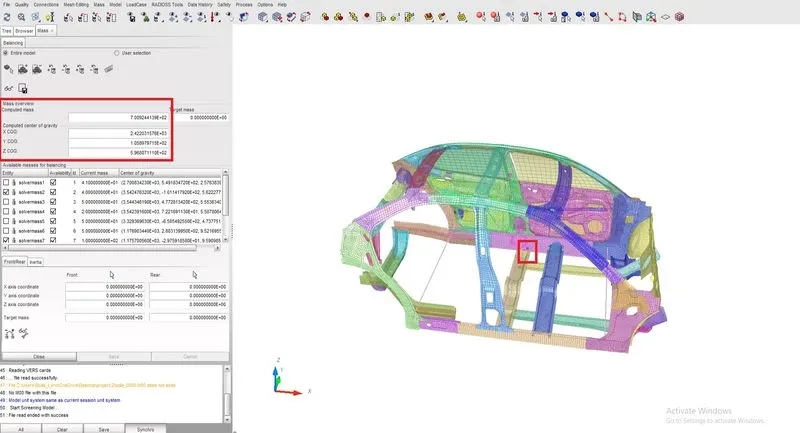
fig1.15
*The Model checker is run to check for any error, there were no errors so the model can be proceeded to run the simulations as shown in fig 1.16.
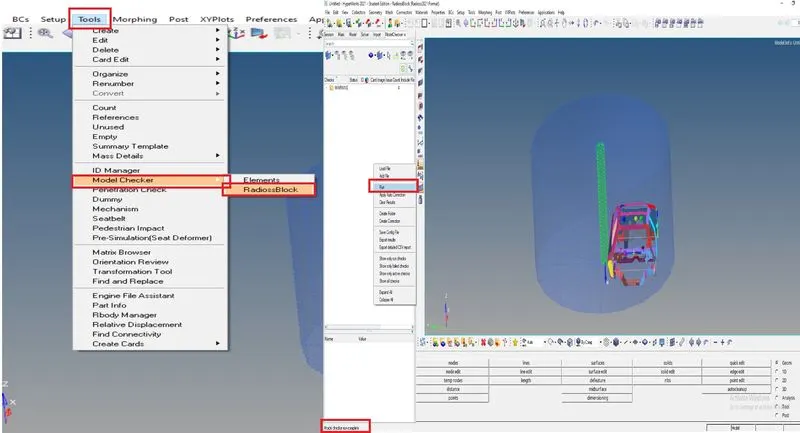
fig1.16
*The simulations are run on hyper view for displacement and Von Mises and have been animated as shown in fig 1.17.
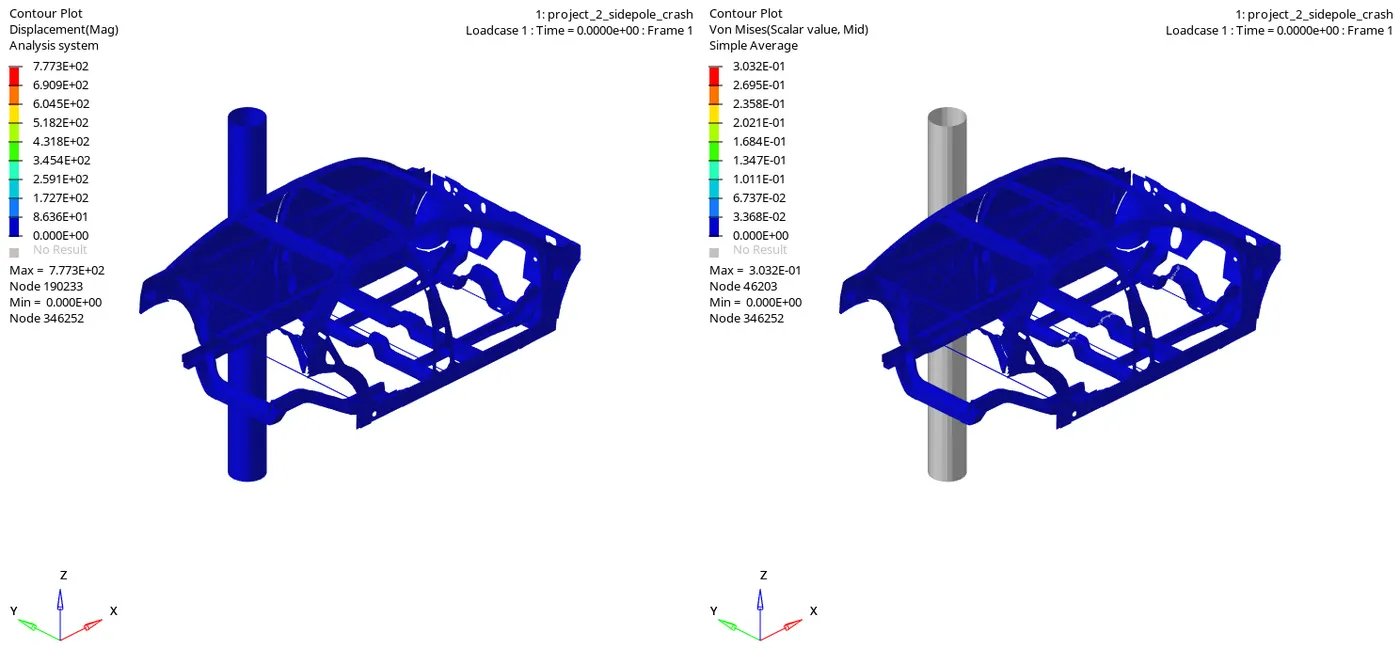
fig1.17
*Hypergraph 2D mode is turned on and graphs have been plotted for Internal energy, Kinetic energy, Hourglass energy, Contact energy, and total energy graphs concerning global variables for Frontal Crash as shown in fig 1.18.
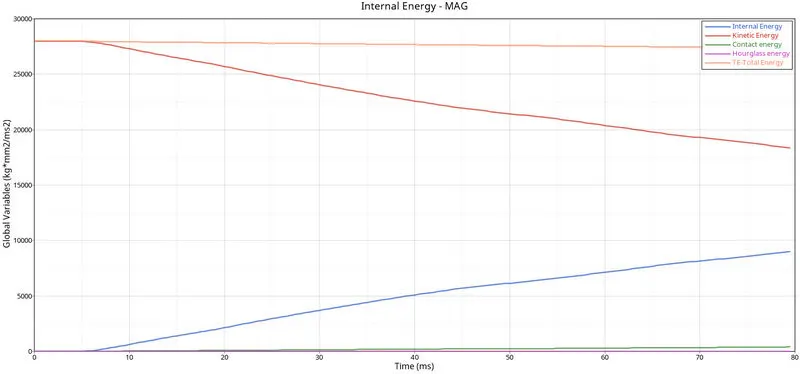
fig 1.18
*The graph is been plotted for the Sections created for the Cross member in the Driver cross-member panel, B-Pillar cross-member panel, and Fuel tank cross-member panel the max value of force among them is shown in fig 1.19.
- For Driver cross-member section 4.8241 `(Kg*mm)/(ms)^2`.
- For B-Pillar cross-member section 3.50818 `(Kg*mm)/(ms)^2`.
- For Fuel tank cross-member section 0.709809 `(Kg*mm)/(ms)^2`.
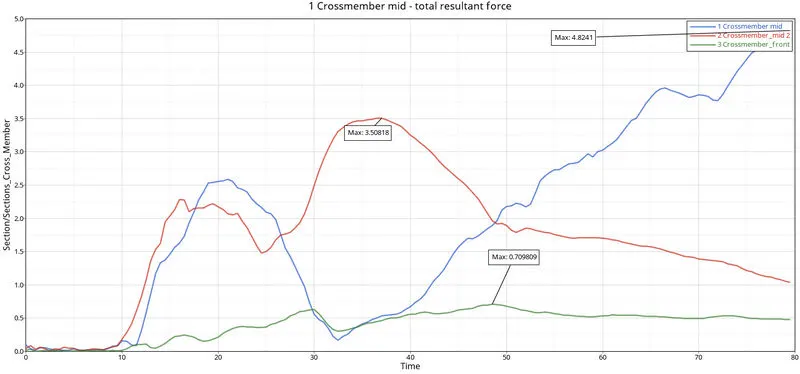
fig 1.19
*The graph is been plotted for the components with self contact with neighboring components for TYPE 7 contact the max value of force among them is 40.3019 `(Kg*mm)/(ms)^2` as shown in fig 1.20.
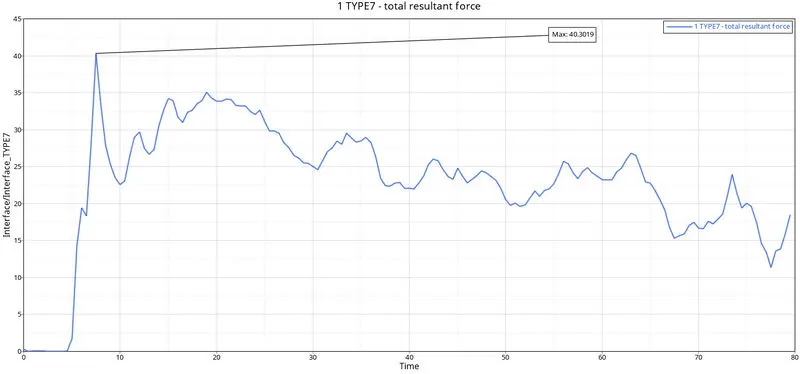
fig 1.20
*The graph is been plotted using the spring elements 9900037,9900038, and 9900039 with respect to time for total elongation in the spring elements in mm for the driver cross member, B-Pillar cross member, and Fuel tank cross-member panel. The intrusion of these springs' values must not exceed 150mm(15cm), the intrusion recorded in the springs are 359.789mm(35.9789cm) , 240.078mm(24.0078cm) and 101.072mm(10.1072cm) as shown in fig 1.21.
The values obtained in this elongation in driver cross member and B-Pillar cross member is not safe this is due to the structure is not properly reinforced and also the model is not a complete car. In the Fuel tank cross-member panel, it is safe the value is less the 150mm (15cm).
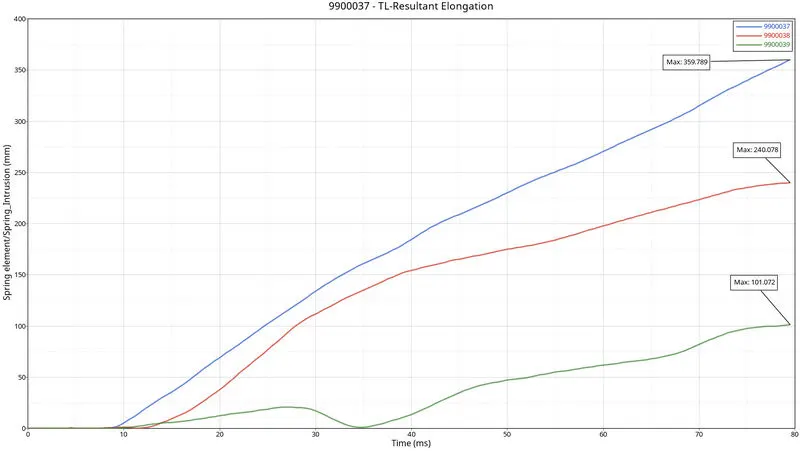
fig 1.21
*The graph is been plotted using the peak velocity for node 337773 is 9.2409 mm/ms but the initial velocity is 8.9408 mm/ms as shown in fig 1.22. There is an increase in the velocity this is due to inertia. The graph is in the waveform, this is because of the noise and vibration when the car impacts the pole.
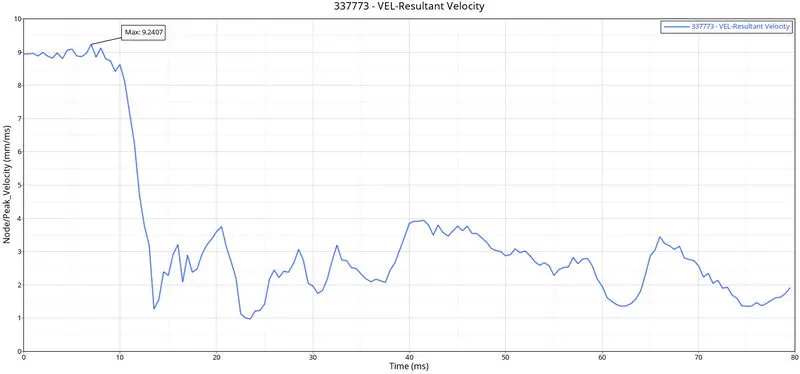
fig 1.22
*The internal energy starts from origin due to there being no contact between the Side pole and Car BIW. So the internal energy goes on increasing, proportionally the deformation or displacement is happening, when the displacement increases the internal energy increases as shown in fig1.23.
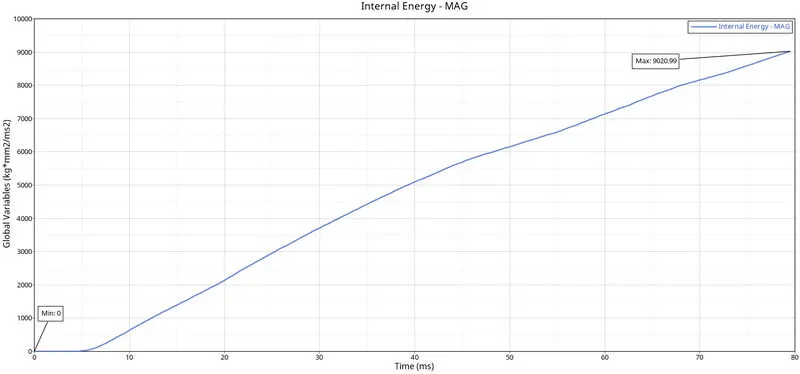
fig1.23
* Kinetic energy is high and then decreases, due to there being velocity applied to the Car BIW, so it's getting deformed and the kinetic energy decreases the graph has been plotted for Kinetic energy and time as parameters as shown in fig 1.24.
The formula for Kinetic Energy=`(1/2)*(m*v^2)`
Given Data
Mass=700 kg
Velocity=8.9408`(mm)/(ms)`
K.E=`(1/2)*(700*(8.9408^2)`
K.E=27968.3`(Kg*mm^2)/(ms)^2`
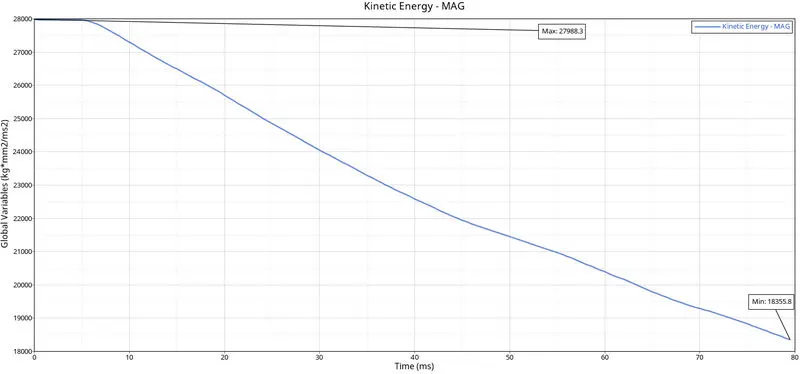
fig1.24
*At initial the there will be no impact so the Contact energy will be at zero and then as the deformation starts Contact energy increases gradually with respect to time. The graph has been plotted for Contact energy and time as parameters. The Hourglass energy is been occurred in the simulation the max value attained is 7.55545`(Kg*mm^2)/(ms)^2`. Which is below the permissible range that is less than 10% of the internal energy as shown in fig 1.25.
% of Error = `((7.55545)/(9020.99))*100=0.0.0837%`
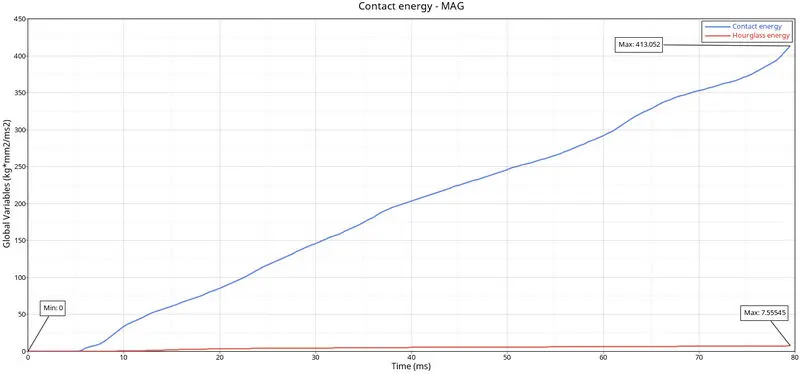
fig1.25
*Since Total energy is the summation of all the energies so at the start there will only be Kinetic energy so the total energy will be equal until the deformation starts Total energy averages all energies with respect to time. The graph has been plotted for Total energy and time as parameters as shown in fig 1.26.
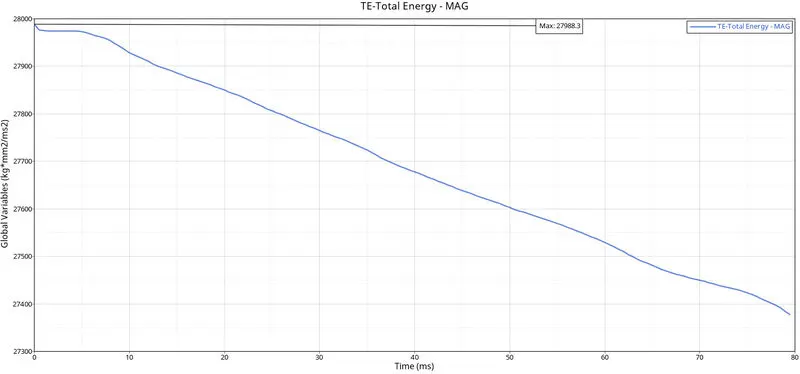
fig1.26
*The graphs have been plotted by using hypergraph 2D for rigid wall forces, total resultant elongation for springs, Sectional resultant forces, Acceleration, internal energy, hourglass energy, contact energy, and total energy and are verified siminatusly as shown in fig 1.27.
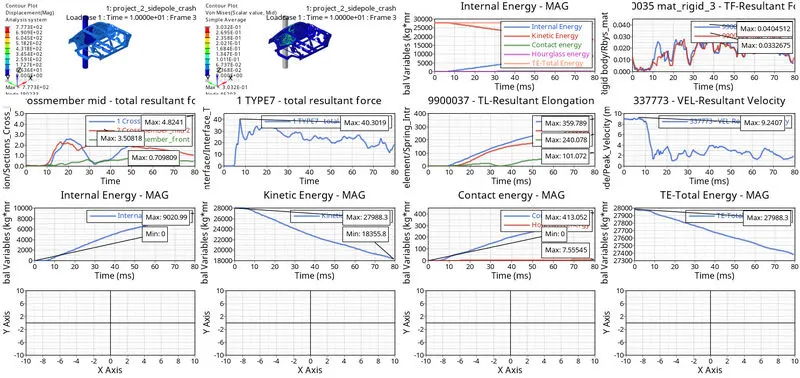
fig1.27
RESULT:-The model was simulated to perform the Side pole crash test and observed the deformations and plotting of the graphs for all the mentioned requests and energies.