Assignment 5-RADIOSS Interfaces & Study of Effect of Notches Challenge
AIM: - To Mesh the given crash tube model with 6mm size and to run the crash tube model by using different types of contact interfaces.
OBJECTIVE: -
- Importing the model and running the simulation without changing the time step and Tfreq values.
- To create TH for all the inputs requested.
- For case 1, the model will have no values changed.
- The simulations are run on hyperview for displacement and Von Mises.
- To plot the graphs by using hypergraph 2D for rigid wall forces, internal energy, hourglass energy, contact energy, and total energy.
- For case 2, Change the Inacti=6 and run.
- The simulations are run on hyperview for displacement and Von Mises.
- To plot the graphs by using hypergraph 2D for rigid wall forces, internal energy, hourglass energy, contact energy, and total energy.
- For case 3, Create the type 11 contact and run.
- The simulations are run on hyperview for displacement and Von Mises.
- To plot the graphs by using hypergraph 2D for rigid wall forces, internal energy, hourglass energy, contact energy, and total energy.
- For case 4, Remove both notches and remove boundary condition on rigid body node then run.
- The simulations are run on hyperview for displacement and Von Mises.
- To plot the graphs by using hypergraph 2D for rigid wall forces, internal energy, hourglass energy, contact energy, and total energy.
- For case 5, Create a new notch in the middle, select the whole section, and run.
- The simulations are run on hyperview for displacement and Von Mises.
- To plot the graphs by using hypergraph 2D for rigid wall forces, internal energy, hourglass energy, contact energy, and total energy.
- For case 6, Create a new notch with nodes only from opposing 2 faces and run.
- The simulations are run on hyperview for displacement and Von Mises.
- To plot the graphs by using hypergraph 2D for rigid wall forces, internal energy, hourglass energy, contact energy, and total energy.
THEORETICAL EXPLANATION:-
Interface Penalty Method: -
- The penalty method treats the behavior between slave nodes and master segments as springs that generate resistive forces as a function of penetration.
- Here the interfaces are governed by the penalty method.
- When the parts come into contact, The slave node tries to penetrate the mid surface.
- The solver introduces the 1D spring element once the slave node penetrates the gap.
- The spring stiffness is automatically computed according to the material and property of both the master segment and slave node.
Interface Type 7: - Nodes to Surface Contact
- It is a general-purpose interface and can simulate all types of impact between a
set of nodes and a master surface. - Non oriented and slave nodes can belong to the master surface, Hence auto impact is possible.
- Automatic node to surface contact interface using penalty method with variable stiffness.
- A gap is defined around the master segment and the slave nodes.
- The contact gap can be constant or variable.
- Resistive forces are applied to keep slave nodes out of the contact gap.
- Interface time step is computed to ensure stability.
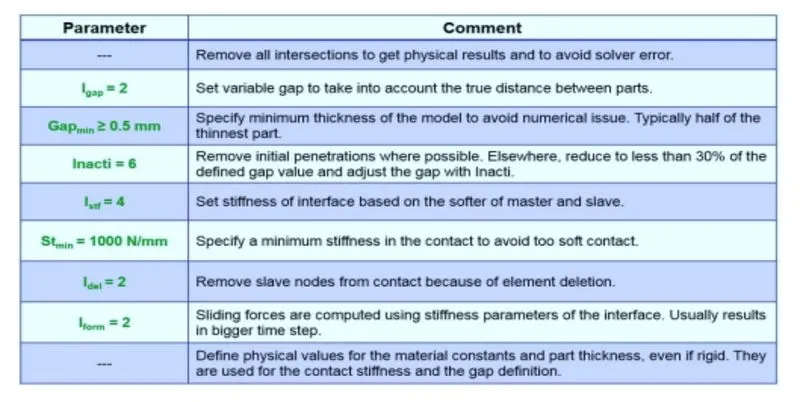
fig1.1
Interface Type 11: - (Edge to Edge Contact)
- Type 11 is similar to the Type 7 Contact.
- This interface simulates the impact between edge to Edge or lines. A line can be a beam or truss element or a shell edge or spring element. In association with interface Type 7, interface Type 11 solves the locking cases.
- Defined by identifying master and slave lines (edges)
- Impacts occur between a master and a slave line. A slave line can impact one or more master lines. A line can belong to the master and the slave side. This allows self-impact.
- Works similar to Type 7 in terms of Penalty formulation, Gap definition,d search method.
- Uses complicated mathematical algorithms; therefore, it is strongly advised to use them only when necessary. A huge interface Type 11 can slow down the computation.
PROCEDURE:-
* The model is downloaded and imported by using model .hm file type to the work area as shown in fig1.2.
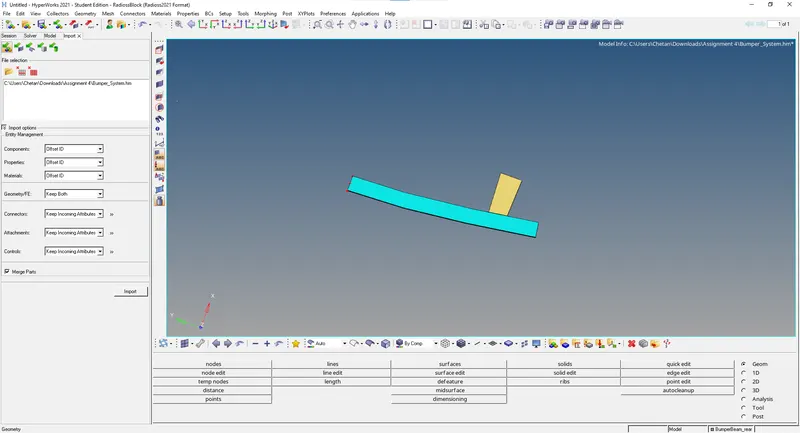
fig1.2.
*The bumper mid surface geometrical cleanup is done by toggling the line of unwanted lines and regions as shown in fig 1.3.
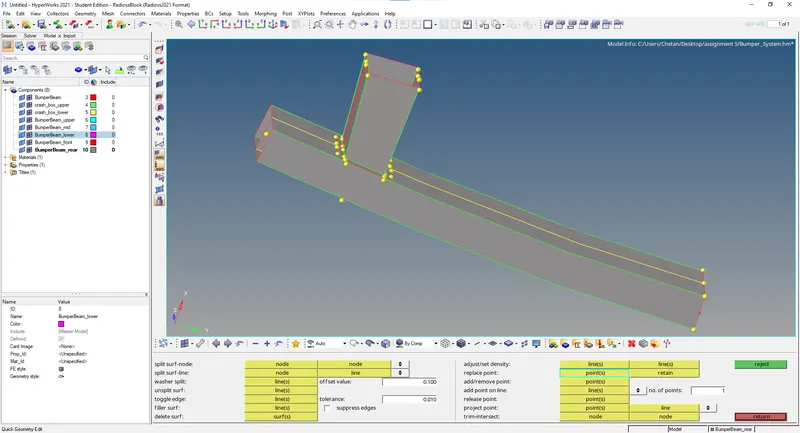
fig 1.3.
*The meshing is done by selecting surfaces individually so the mesh would be uniform and good mesh flow as shown in fig 1.4.
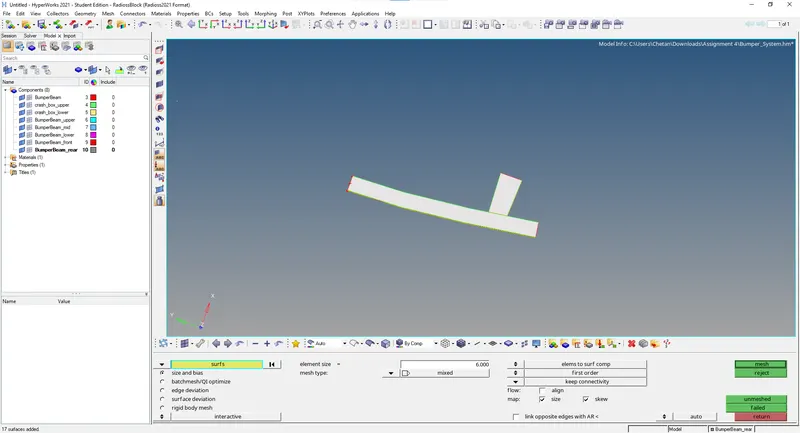
fig 1.4
*The component is checked for Trias and there are no Trias elements as shown in fig 1.5.
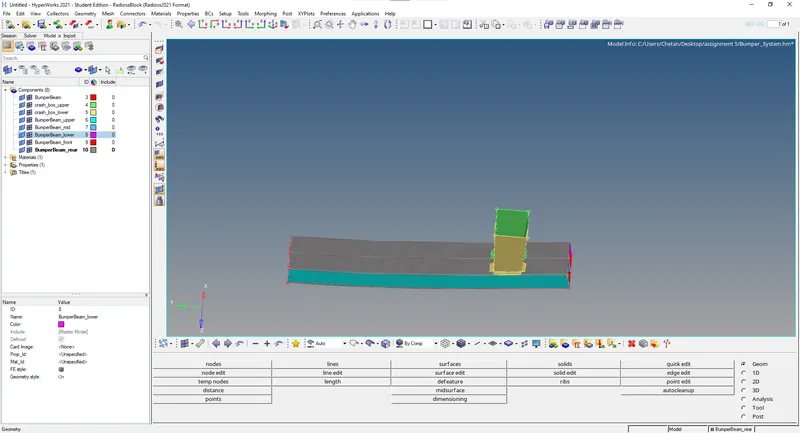
fig1.5
CASE 1
*The import of the model is been done by Model components for assignment 5 as shown in fig1.6.
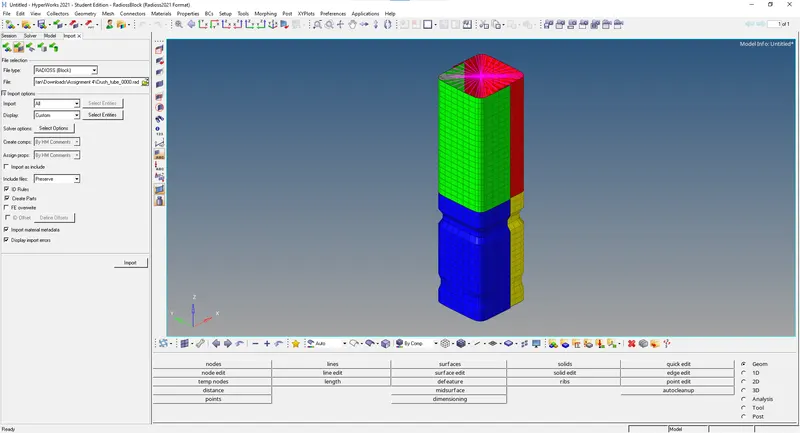
fig1.6
*The time history is created in the mentioned region to provide a time history so the force acting in the regions can be recorded as shown in fig 1.7.
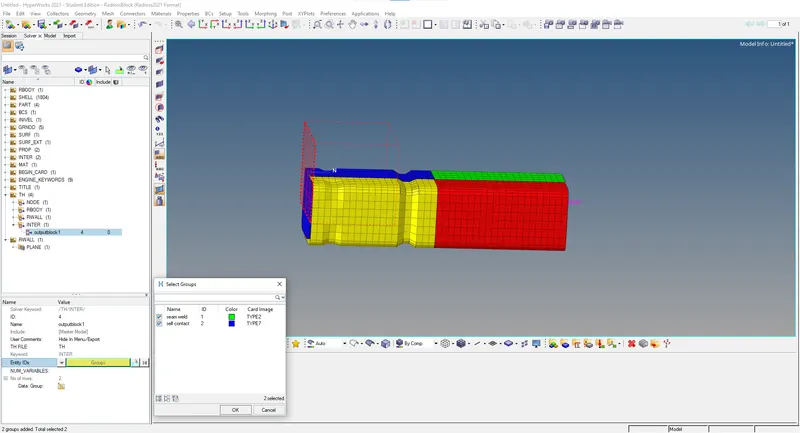
fig1.7
*The simulations are run on hyper view for displacement and Von Mises and have been animated as shown in fig 1.8.
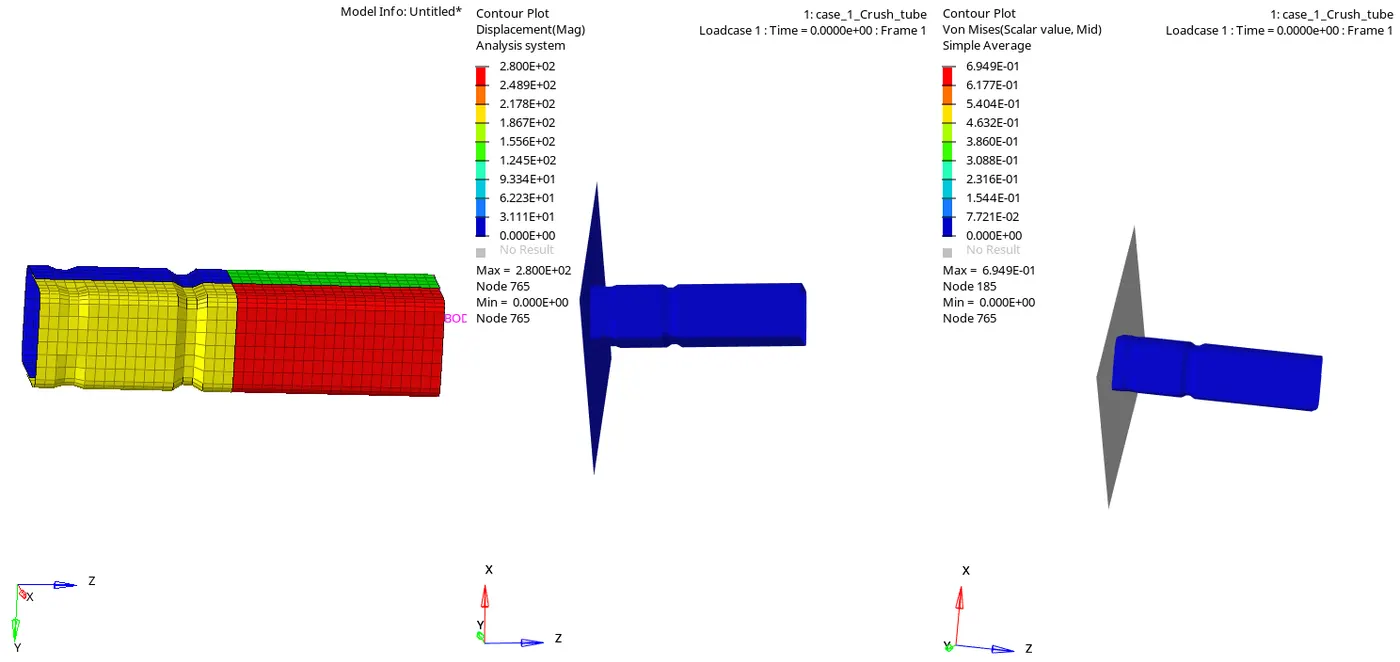
fig 1.8
*Hypergraph 2D mode is turned on and graphs have been plotted for Internal energy, Kinetic energy, Hourglass energy, Contact energy, and total energy graphs concerning global variables for Case as shown in fig 1.9.
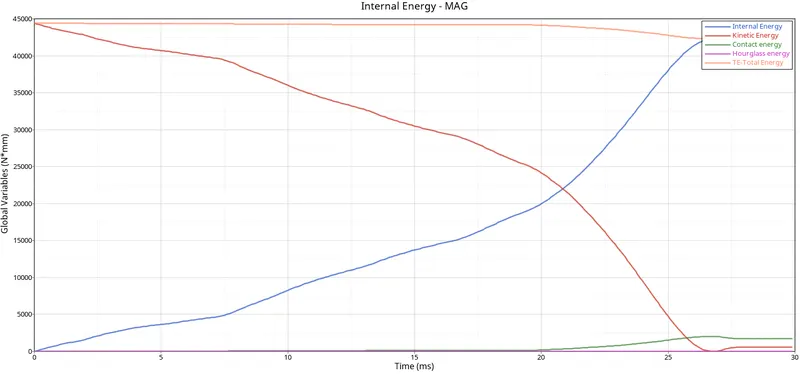
fig 1.9
*For the Rigid forces, there is no contact between the Crash Tube and rigid wall. So the curve is in origin. When the rigid Wall hits on the Crash Tube, the curve starts increasing and suddenly the curve starts decreasing, Once, there will be no contact after the elements get deleted which is shown in1.10.
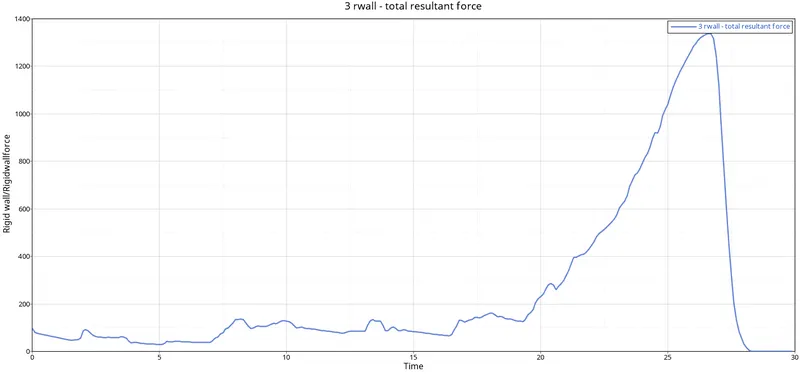
fig 1.10
*The graph is been plotted for the components with self contact with neighboring components for TYPE 7 as shown in fig 1.11.
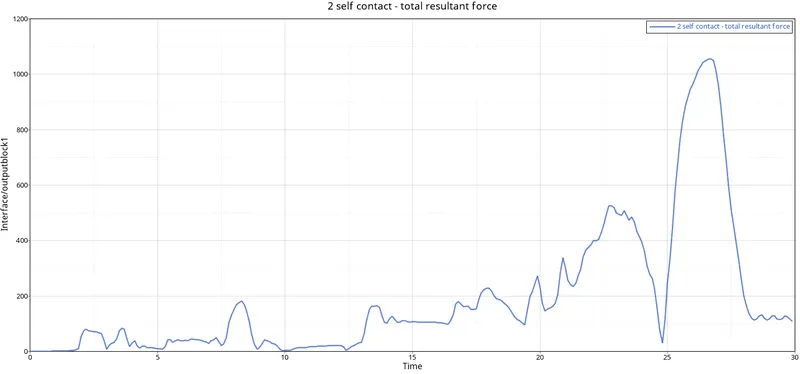
fig 1.11
*The internal energy starts from origin due to there being no contact between the rigid wall and Crash Tube. So the internal energy goes on increasing, proportionally the deformation or displacement is happening, when the displacement increases the internal energy increases as shown in fig1.12.
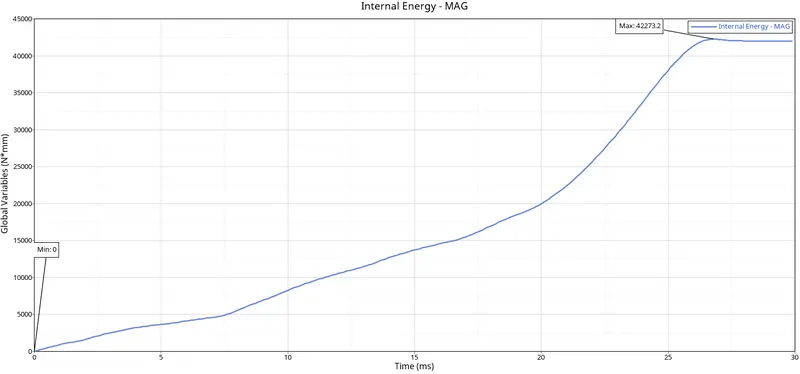
fig 1.12
* Kinetic energy is plotted for the Crash tube, the Crash tube will be moving it will be having some velocity. So due to some velocity, there will be kinetic energy. When the impactor hits the car model the energy will transfer to the model and the kinetic energy of the model gets increases the kinetic energy goes on increasing. as shown in fig 1.13.
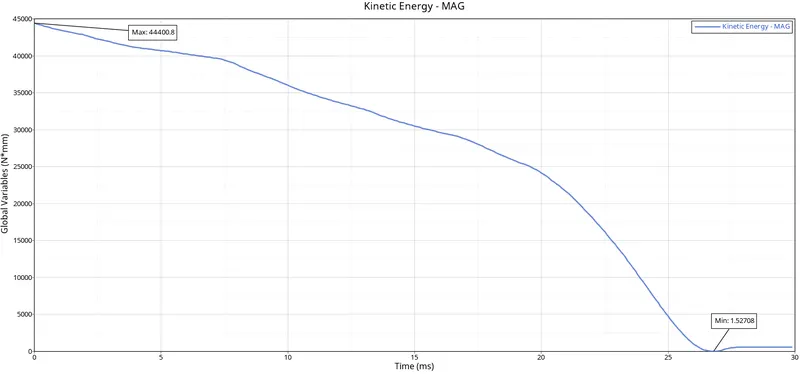
fig 1.13
*When both the objects come in contact with each other. If deformable bodies get in contact, then only the contact energy increases. Since the rigid Wall is a rigid body and the Crash Tube is a deformable body, So the contact energy is constant as shown in fig1.14. 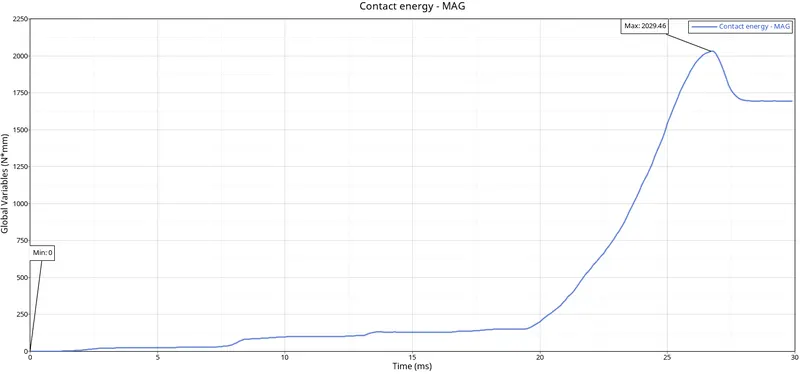
fig 1.14
*For this case the Hourglass energy is zero because of the usage of the property parameters Ishell =24, Ismstr=2, Ish3n=2, N=5, and Iplas=1. The graph has been plotted for Hourglass energy and time as parameters as shown in fig 1.15.
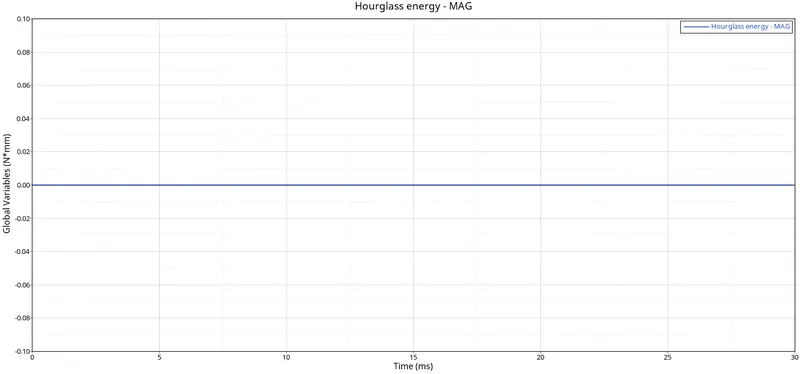
fig 1.15
*Since Total energy is the summation of all the energies so at the start there will only be Internal energy so the total energy will be equal until the deformation starts Total energy averages all energies with respect to time. The graph has been plotted for Total energy and time as parameters as shown in fig 1.16.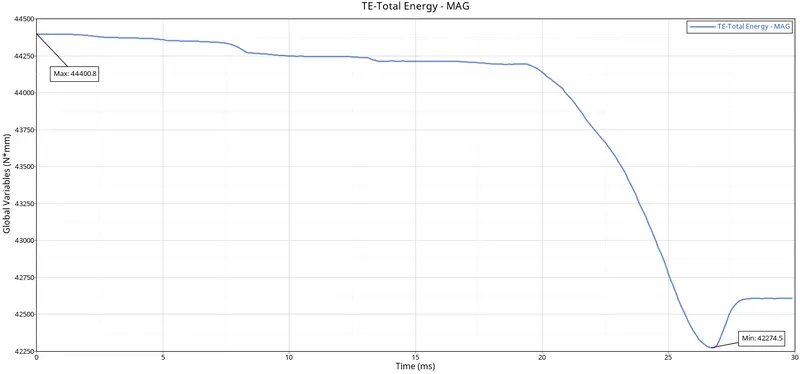
fig 1.16
*The graphs have been plotted by using hypergraph 2D for rigid wall forces, internal energy, hourglass energy, contact energy, and total energy and are verified simultaneously as shown in fig 1.17.
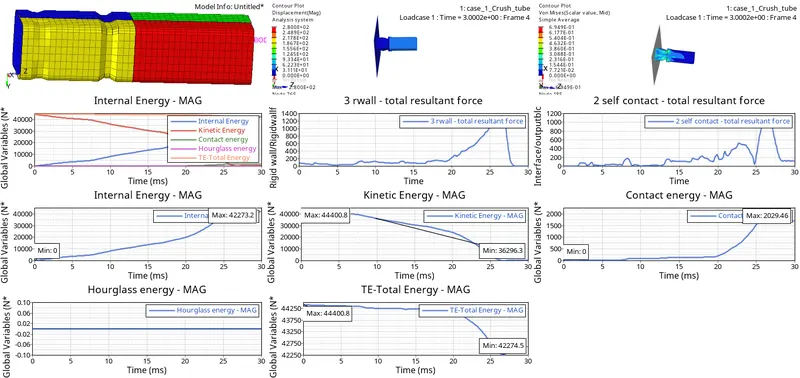
fig1.17
CASE 2
*The import of the model is been done by Model components for assignment 5 and Change the Inacti=6 and run as shown in fig1.18.
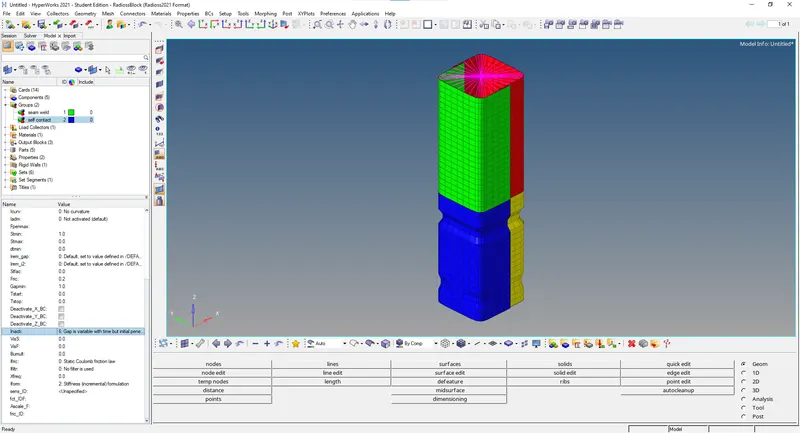
fig1.18
*The time history is created in the mentioned region to provide a time history so the force acting in the regions can be recorded as shown in fig 1.19.
fig1.19
*The simulations are run on hyper view for displacement and Von Mises and have been animated as shown in fig 1.20.
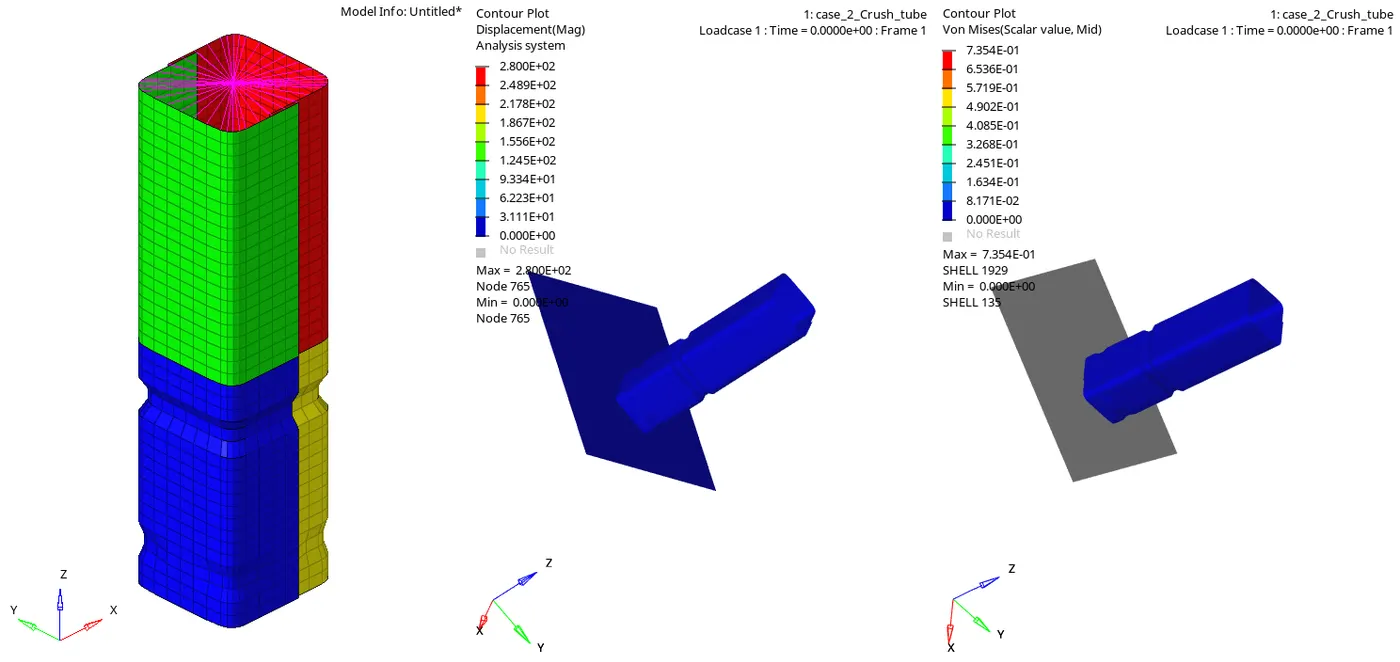
fig1.20
*Hypergraph 2D mode is turned on and graphs have been plotted for Internal energy, Kinetic energy, Hourglass energy, Contact energy, and total energy graphs concerning global variables for Case as shown in fig 1.21.
fig1.21
*For the Rigid forces, there is no contact between the Crash Tube and rigid wall. So the curve is in origin. When the rigid Wall hits on the Crash Tube, the curve starts increasing and suddenly the curve starts decreasing, Once, there will be no contact after the elements get deleted which is shown in1.22.
fig1.22
*The graph is been plotted for the components with self contact with neighboring components for TYPE 7 as shown in fig 1.23.
fig1.23
*The internal energy starts from origin due to there being no contact between the rigid wall and Crash Tube. So the internal energy goes on increasing, proportionally the deformation or displacement is happening, when the displacement increases the internal energy increases as shown in fig1.24.
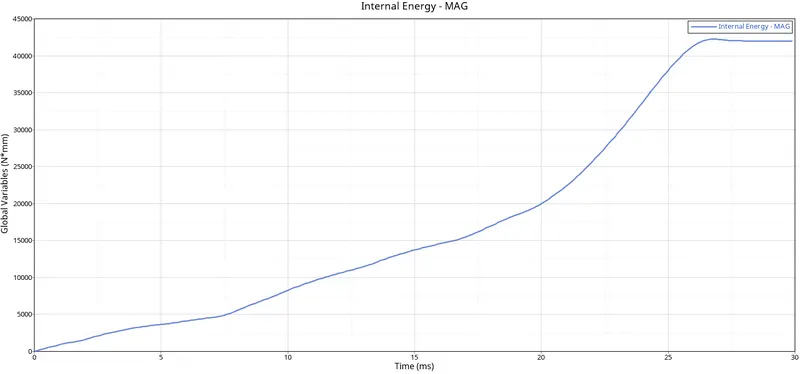
fig1.24
* Kinetic energy is plotted for the Crash tube, the Crash tube will be moving it will be having some velocity. So due to some velocity, there will be kinetic energy. When the impactor hits the car model the energy will transfer to the model and the kinetic energy of the model gets increases the kinetic energy goes on increasing as shown in fig 1.25.
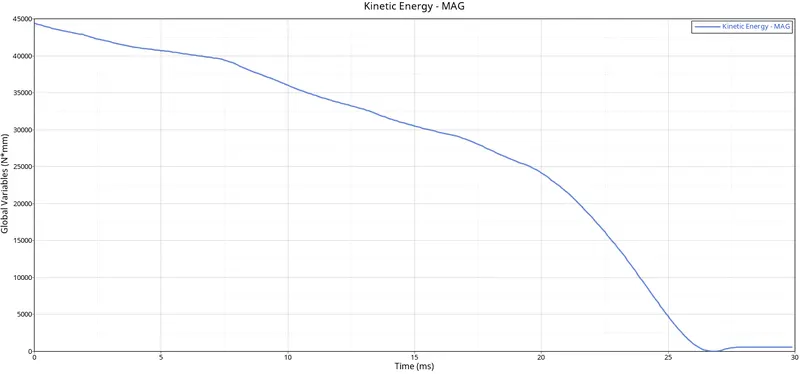
fig1.25
*When both the objects come in contact with each other. If deformable bodies get in contact, then only the contact energy increases. Since the rigid Wall is a rigid body and the Crash Tube is a deformable body, So the contact energy is constant as shown in fig1.26.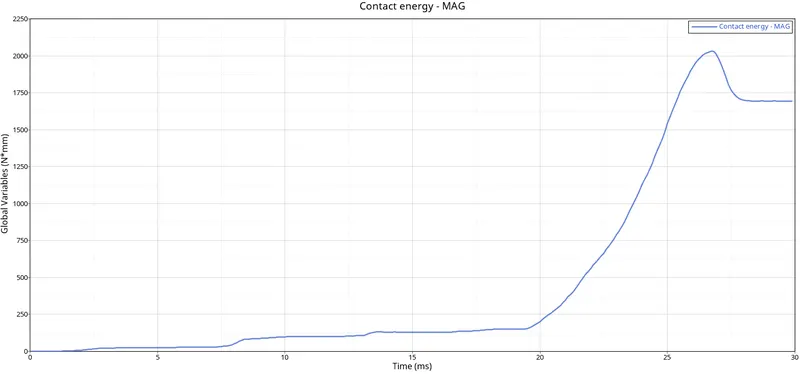
fig1.26
*For this case the Hourglass energy is zero because of the usage of the property parameters Ishell =24, Ismstr=2, Ish3n=2, N=5, and Iplas=1. The graph has been plotted for Hourglass energy and time as parameters as shown in fig 1.27.
fig1.27
*Since Total energy is the summation of all the energies so at the start there will only be Internal energy so the total energy will be equal until the deformation starts Total energy averages all energies with respect to time. The graph has been plotted for Total energy and time as parameters as shown in fig 1.28.
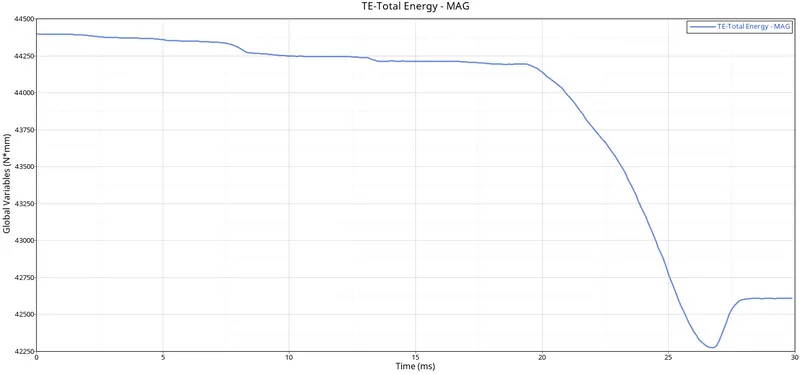
fig1.28
*The graphs have been plotted by using hypergraph 2D for rigid wall forces, internal energy, hourglass energy, contact energy, and total energy and are verified simultaneously as shown in fig 1.29.
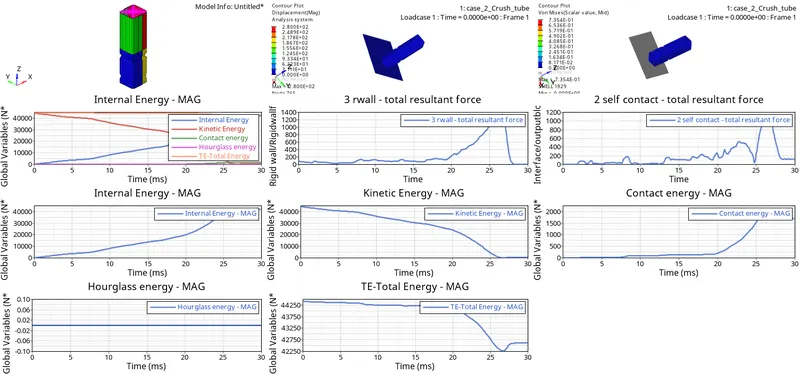
fig1.29
CASE 3
*The import of the model is been done by Model components for assignment 5 and Create the type 11 contact and run as shown in fig1.30.
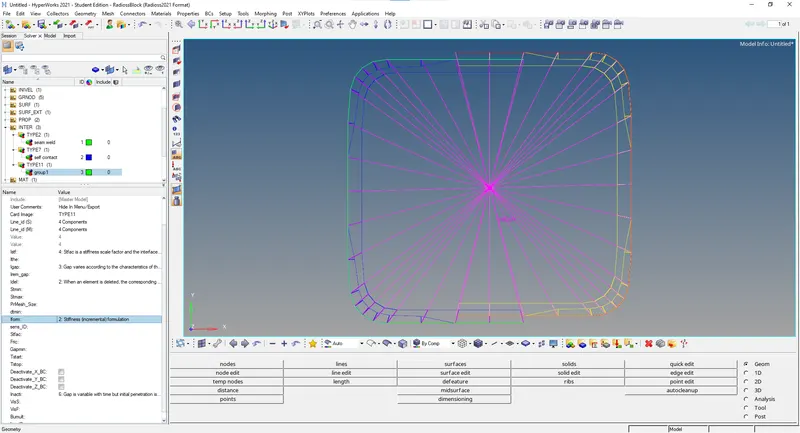
fig1.30
*The time history is created in the mentioned region to provide a time history so the force acting in the regions can be recorded as shown in fig 1.31.
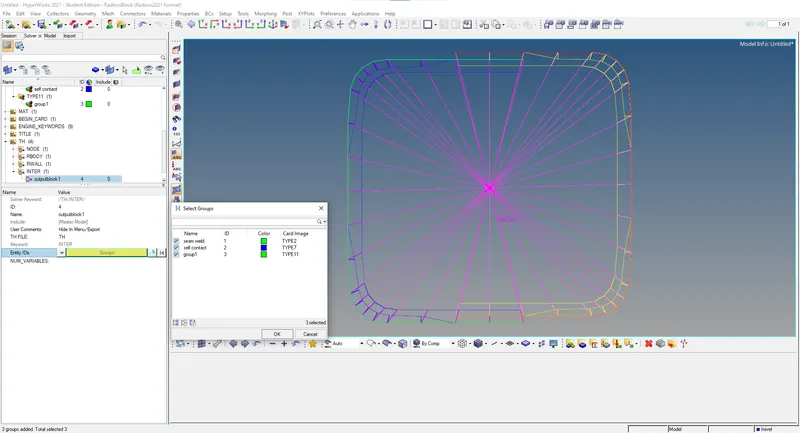
fig1.31
*The simulations are run on hyper view for displacement and Von Mises and have been animated as shown in fig 1.32.
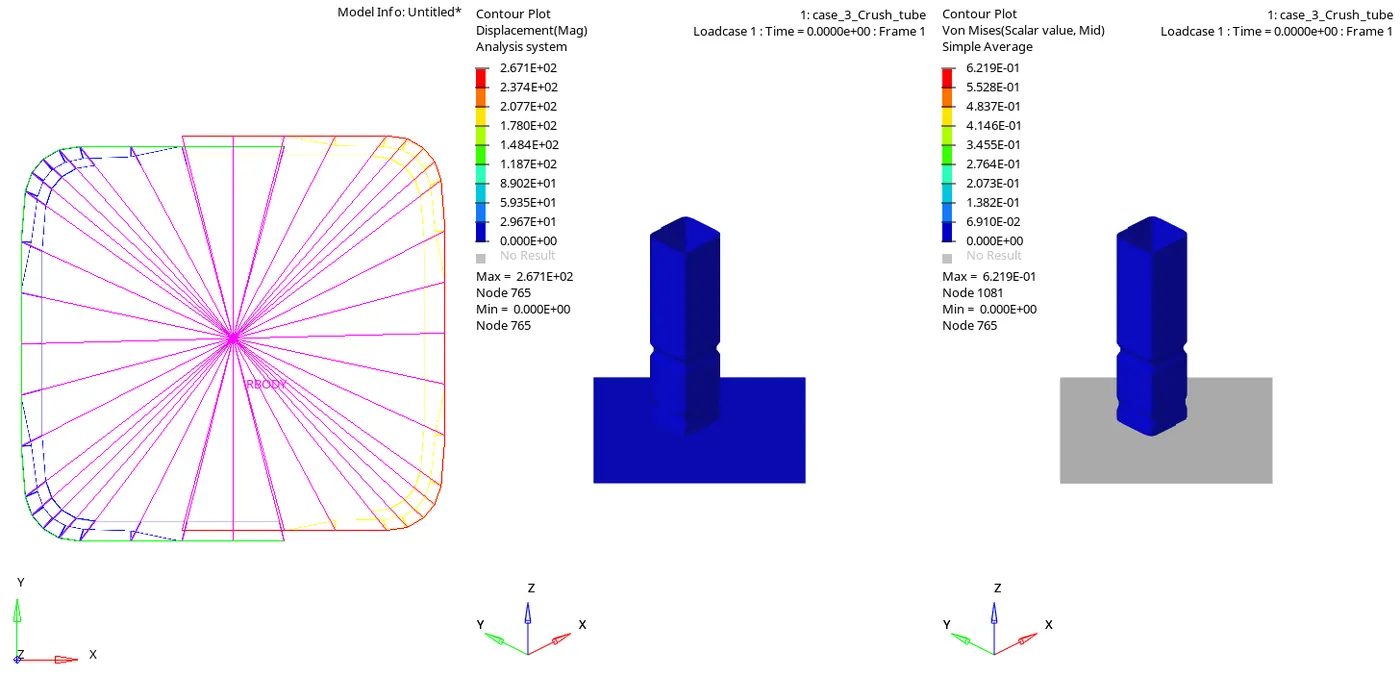
fig1.32
*Hypergraph 2D mode is turned on and graphs have been plotted for Internal energy, Kinetic energy, Hourglass energy, Contact energy, and total energy graphs concerning global variables for Case as shown in fig 1.33.
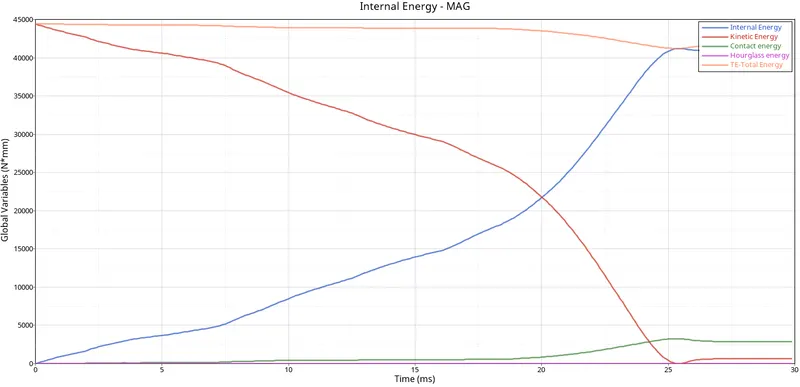
fig1.33
*For the Rigid forces, there is no contact between the Crash Tube and rigid wall. So the curve is in origin. When the rigid Wall hits on the Crash Tube, the curve starts increasing and suddenly the curve starts decreasing, Once, there will be no contact after the elements get deleted which is shown in fig 1.34.
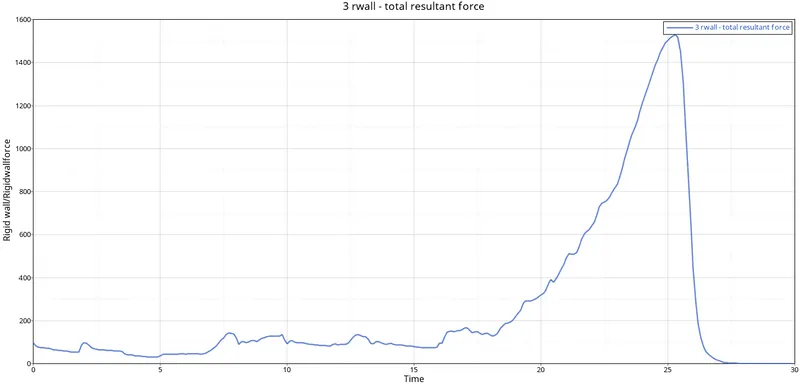
fig 1.34
*The graph is been plotted for the components with self contact with neighboring components for TYPE 11 as shown in fig 1.35.
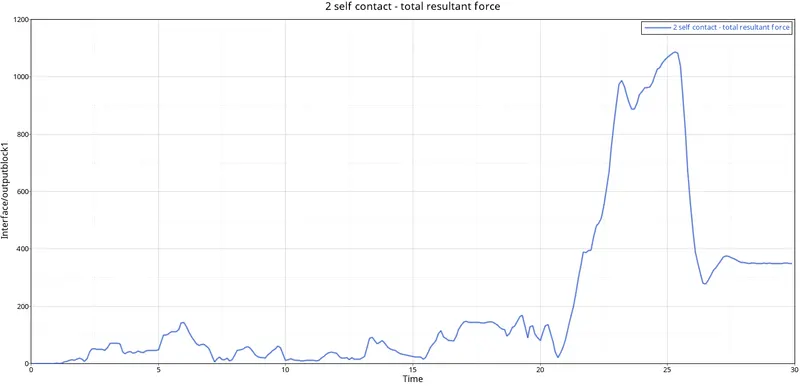
fig 1.35
*The graph is been plotted for the components with the Rigid wall and the crush tube for TYPE 11 as shown in fig 1.36.
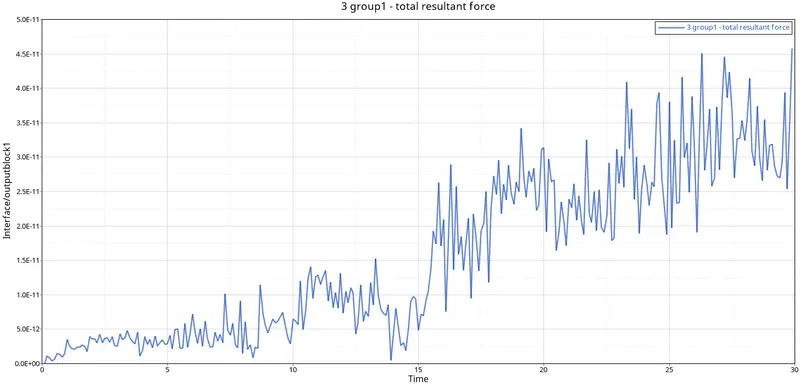
fig 1.36
*The internal energy starts from origin due to there being no contact between the rigid wall and Crash Tube. So the internal energy goes on increasing, proportionally the deformation or displacement is happening, when the displacement increases the internal energy increases as shown in fig1.37.
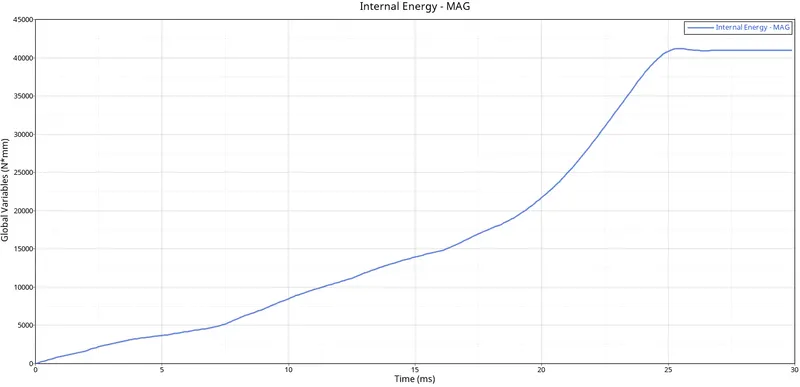
fig 1.37
* Kinetic energy is plotted for the Crash tube, the Crash tube will be moving it will be having some velocity. So due to some velocity, there will be kinetic energy. When the impactor hits the car model the energy will transfer to the model and the kinetic energy of the model gets increases the kinetic energy goes on increasing as shown in fig 1.38.
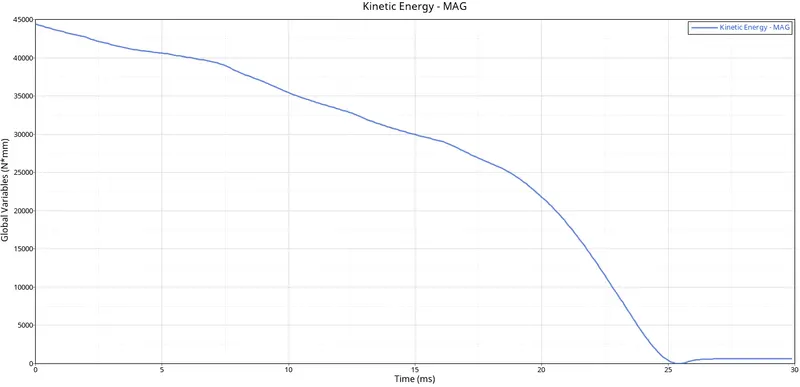
fig1.38
*When both the objects come in contact with each other. If deformable bodies get in contact, then only the contact energy increases. Since the rigid Wall is a rigid body and the Crash Tube is a deformable body, So the contact energy is constant as shown in fig1.39.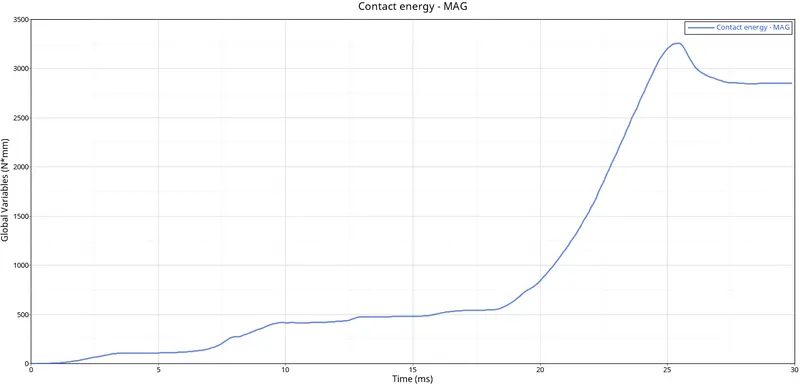
fig 1.39
*For this case the Hourglass energy is zero because of the usage of the property parameters Ishell =24, Ismstr=2, Ish3n=2, N=5, and Iplas=1. The graph has been plotted for Hourglass energy and time as parameters as shown in fig 1.40.
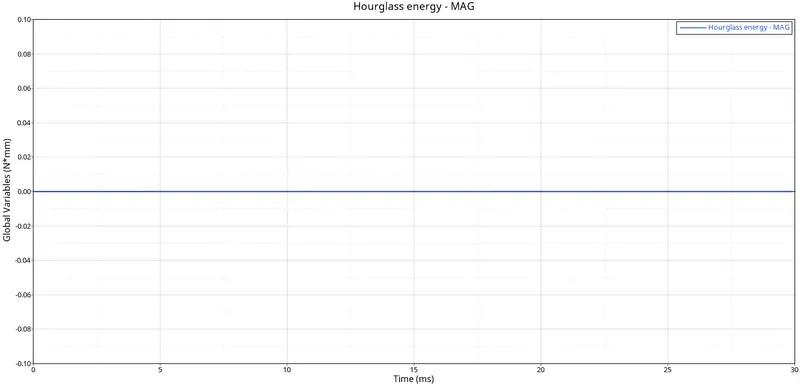
fig 1.40
*Since Total energy is the summation of all the energies so at the start there will only be Internal energy so the total energy will be equal until the deformation starts Total energy averages all energies with respect to time. The graph has been plotted for Total energy and time as parameters as shown in fig 1.41.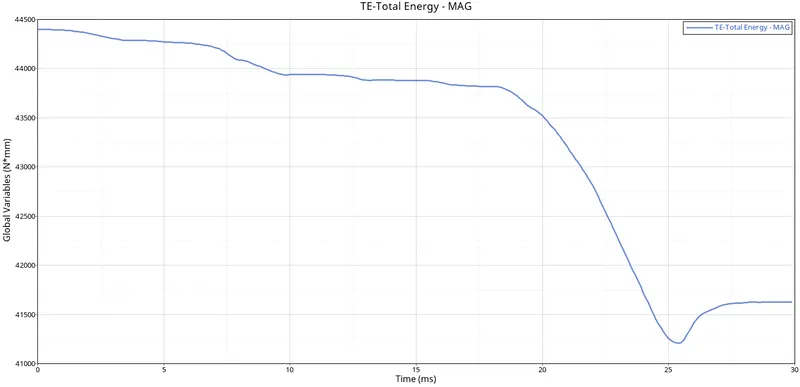
fig 1.41
*The graphs have been plotted by using hypergraph 2D for rigid wall forces, internal energy, hourglass energy, contact energy, and total energy and are verified simultaneously as shown in fig 1.42.
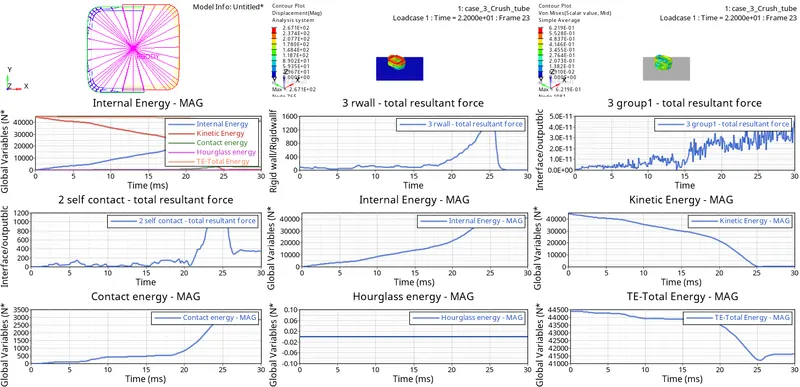
fig 1.42
CASE 4
*The import of the model is been done by Model components for assignment 5 and Remove both notches as shown in fig1.43.
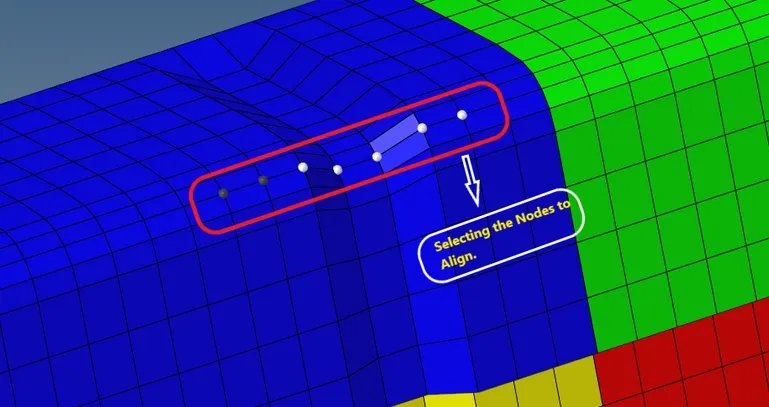
fig1.43
*The boundary condition on a rigid body is deleted and the model is then run fig1.44.
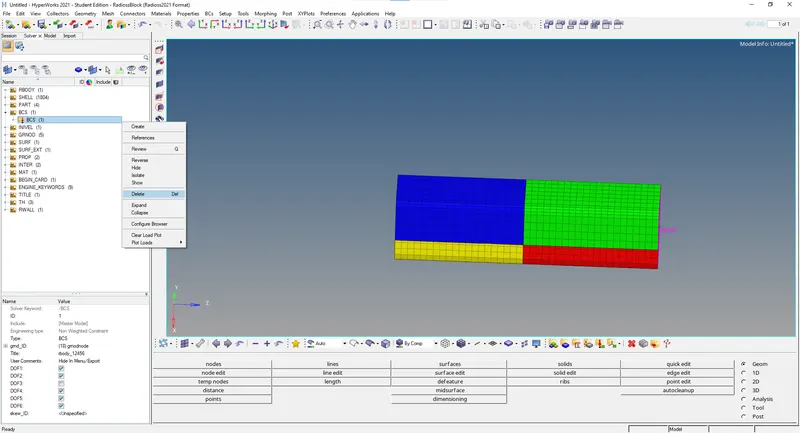
fig1.44
*The simulations are run on hyper view for displacement and Von Mises and have been animated as shown in fig 1.45.
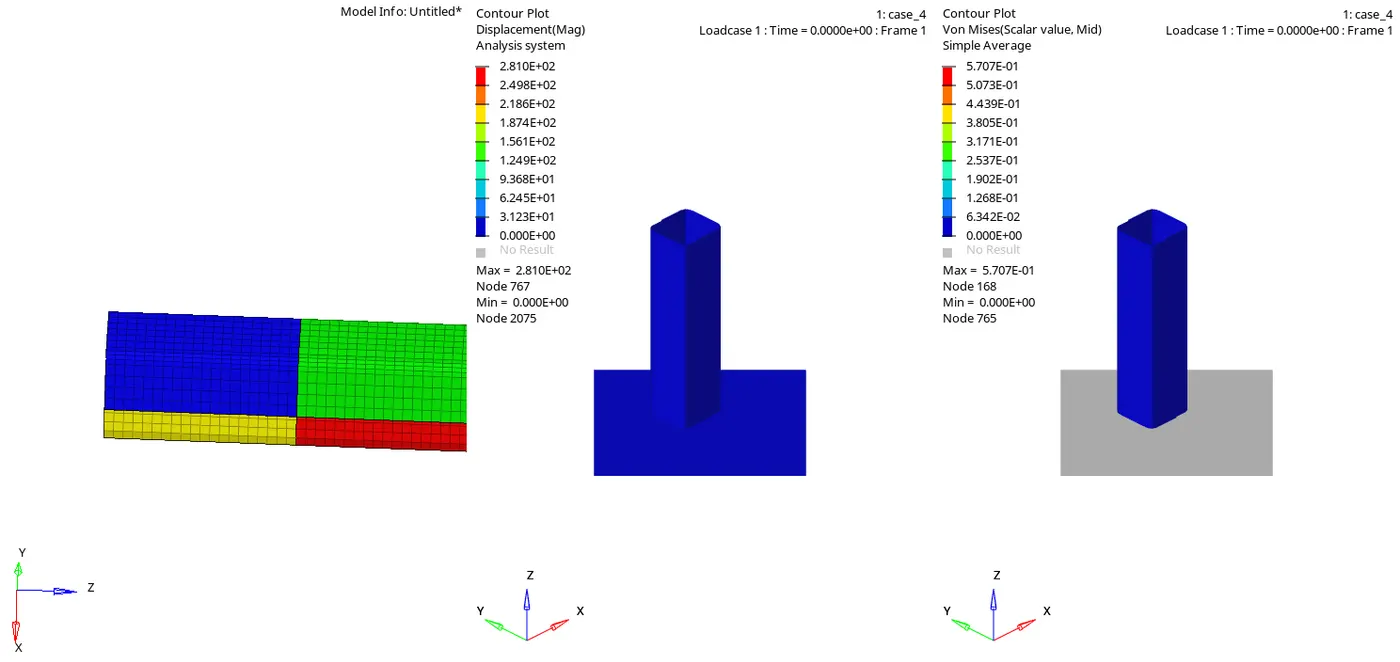
fig1.45
*Hypergraph 2D mode is turned on and graphs have been plotted for Internal energy, Kinetic energy, Hourglass energy, Contact energy, and total energy graphs concerning global variables for Case as shown in fig 1.46.
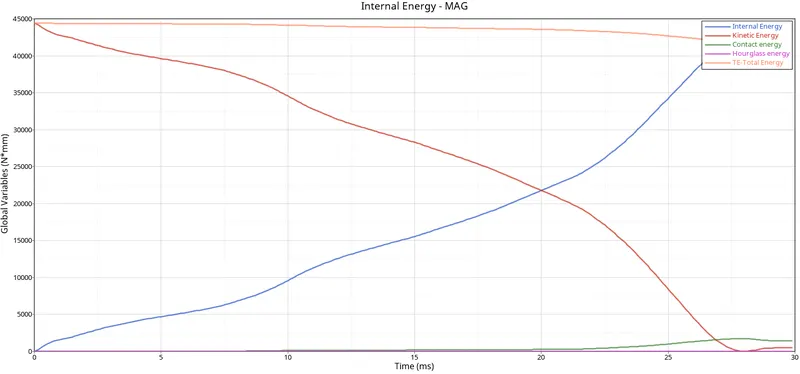
fig1.46
*For the Rigid forces, there is no contact between the Crash Tube and rigid wall. So the curve is in origin. When the rigid Wall hits on the Crash Tube, the curve starts increasing and suddenly the curve starts decreasing, Once, there will be no contact after the elements get deleted which is shown in1.47.
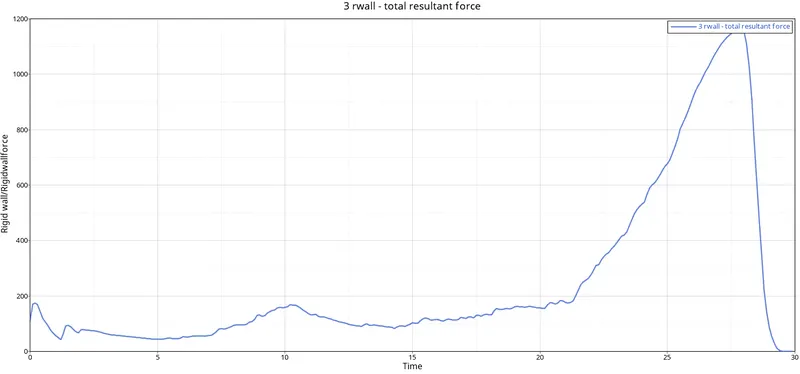
fig1.47
*The graph is been plotted for the components with self contact with neighboring components for TYPE 7 as shown in fig 1.48.
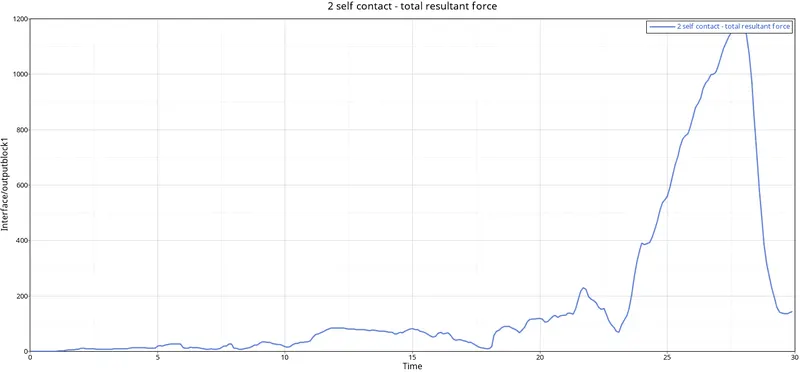
fig1.48
*The internal energy starts from origin due to there being no contact between the rigid wall and Crash Tube. So the internal energy goes on increasing, proportionally the deformation or displacement is happening, when the displacement increases the internal energy increases as shown in fig1.49.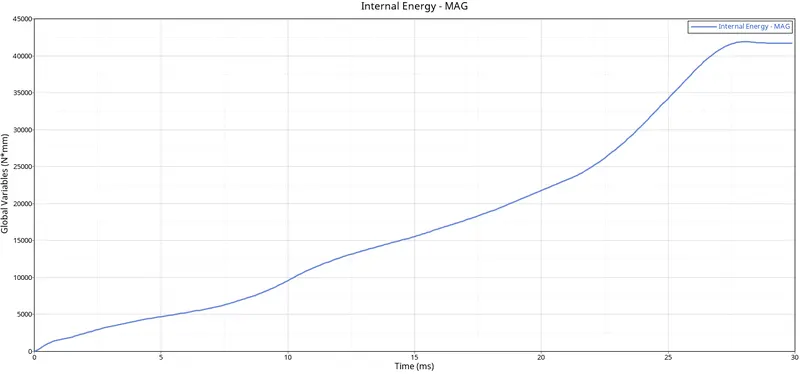
fig1.49
* Kinetic energy is plotted for the Crash tube, the Crash tube will be moving it will be having some velocity. So due to some velocity, there will be kinetic energy. When the impactor hits the car model the energy will transfer to the model and the kinetic energy of the model gets increases the kinetic energy goes on increasing as shown in fig 1.50.
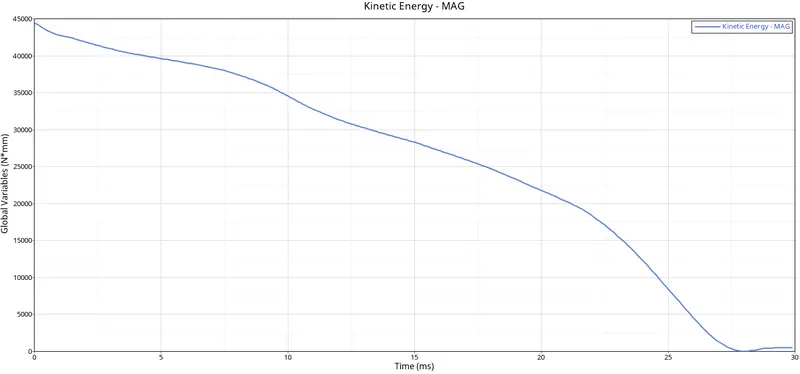
fig1.50
*When both the objects come in contact with each other. If deformable bodies get in contact, then only the contact energy increases. Since the rigid Wall is a rigid body and the Crash Tube is a deformable body, So the contact energy is constant as shown in fig1.51.
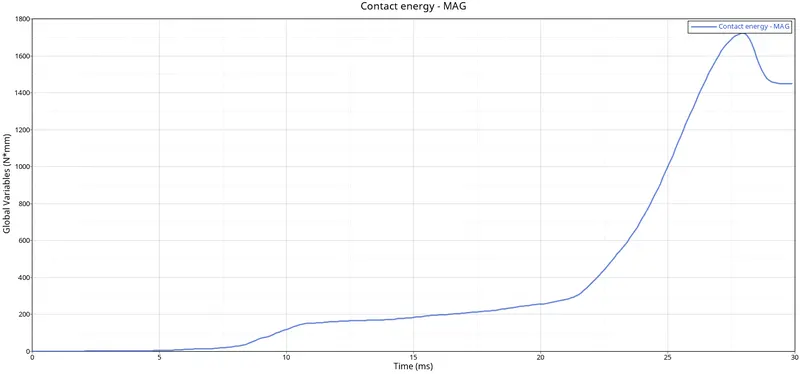
fig1.51
*For this case the Hourglass energy is zero because of the usage of the property parameters Ishell =24, Ismstr=2, Ish3n=2, N=5, and Iplas=1. The graph has been plotted for Hourglass energy and time as parameters as shown in fig 1.52.
fig1.52
*Since Total energy is the summation of all the energies so at the start there will only be Internal energy so the total energy will be equal until the deformation starts Total energy averages all energies with respect to time. The graph has been plotted for Total energy and time as parameters as shown in fig 1.53.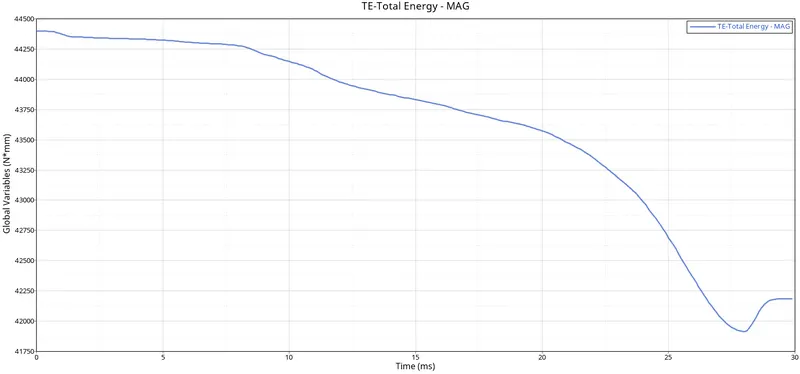
fig1.53
*The graphs have been plotted by using hypergraph 2D for rigid wall forces, internal energy, hourglass energy, contact energy, and total energy and are verified simultaneously as shown in fig 1.54.
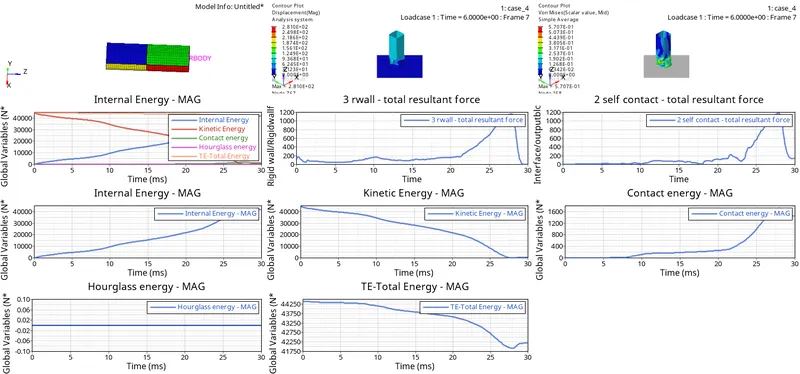
fig1.54
CASE 5
*The Model has to have a notch in center so by using element offset option the notch is created in the center and run as shown in fig 1.55a and fig 1.55b
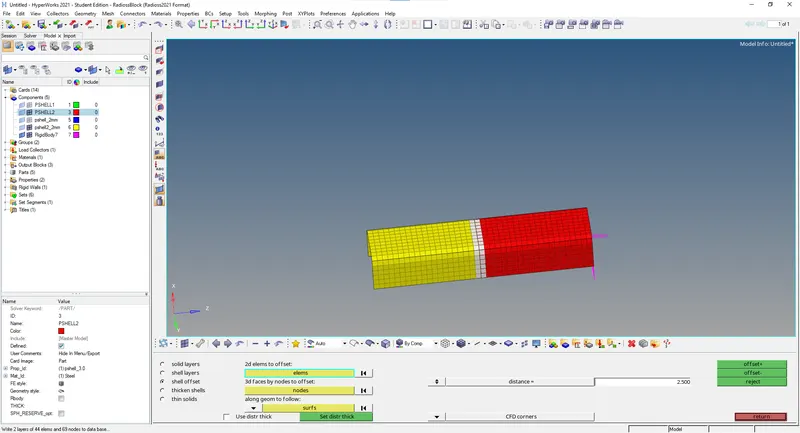
fig 1.55a
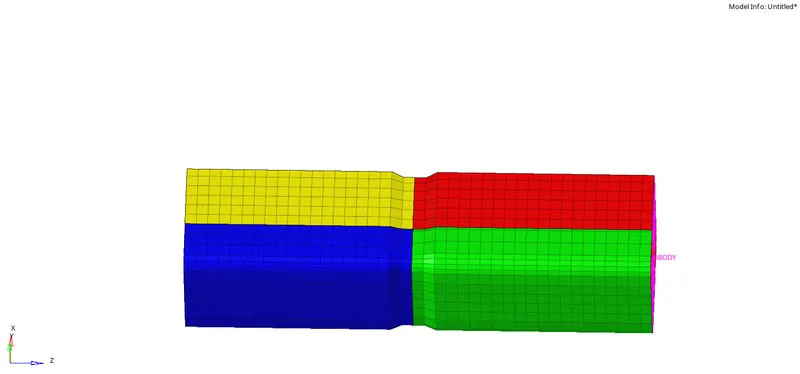
fig 1.55b
*The simulations are run on hyper view for displacement and Von Mises and have been animated as shown in fig 1.56.
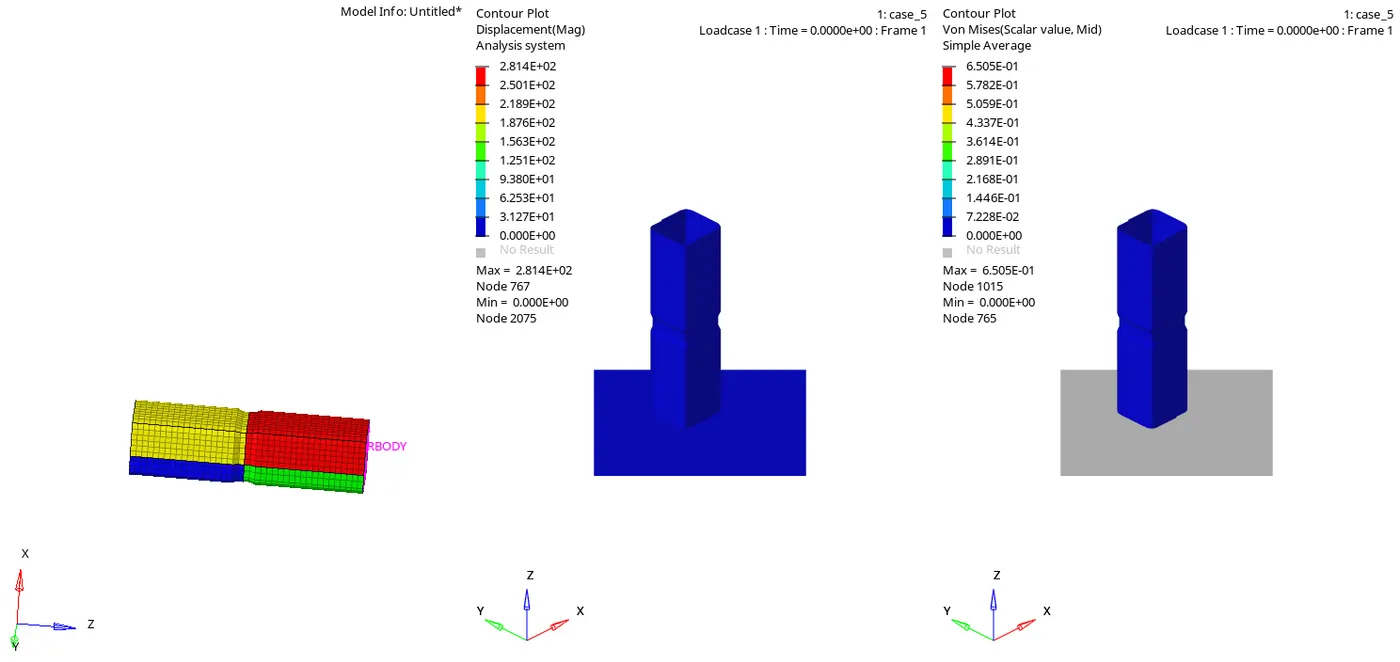
fig 1.56
*Hypergraph 2D mode is turned on and graphs have been plotted for Internal energy, Kinetic energy, Hourglass energy, Contact energy, and total energy graphs concerning global variables for Case as shown in fig 1.57.
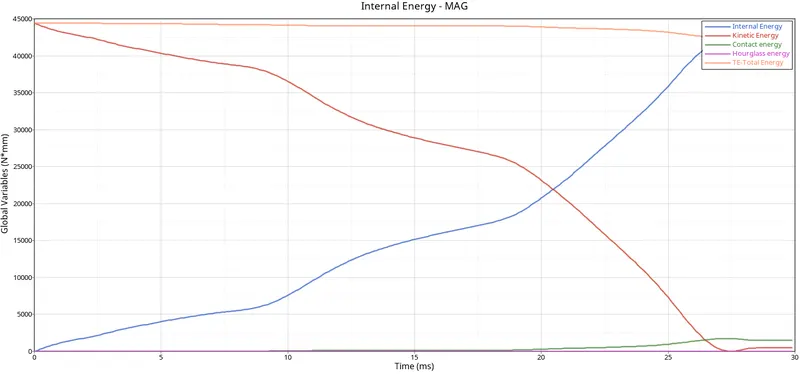
fig 1.57
*For the Rigid forces, there is no contact between the Crash Tube and rigid wall. So the curve is in origin. When the rigid Wall hits on the Crash Tube, the curve starts increasing and suddenly the curve starts decreasing, Once, there will be no contact after the elements get deleted which is shown in1.58.
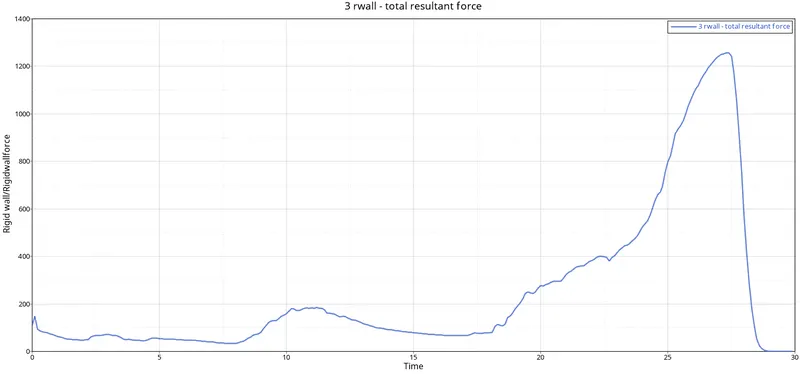
fig 1.58
*The graph is been plotted for the components with self contact with neighboring components for TYPE 7 as shown in fig 1.59.
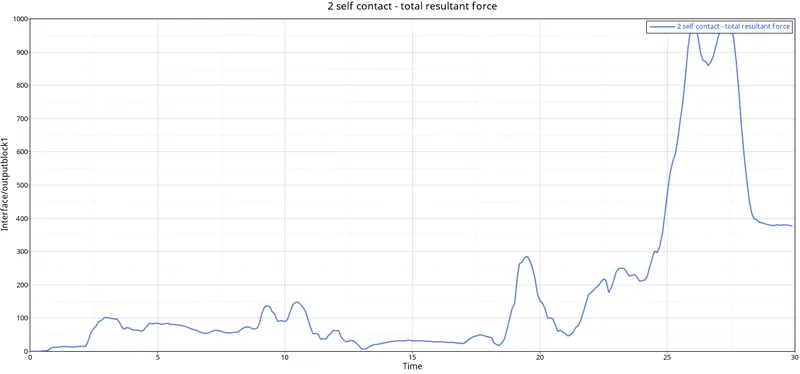
fig 1.59
*The internal energy starts from origin due to there being no contact between the rigid wall and Crash Tube. So the internal energy goes on increasing, proportionally the deformation or displacement is happening, when the displacement increases the internal energy increases as shown in fig1.60.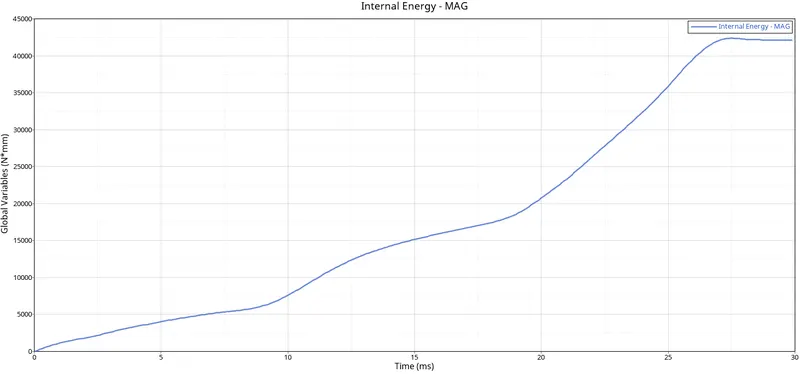
fig1.60
* Kinetic energy is plotted for the Crash tube, the Crash tube will be moving it will be having some velocity. So due to some velocity, there will be kinetic energy. When the impactor hits the car model the energy will transfer to the model and the kinetic energy of the model gets increases the kinetic energy goes on increasing as shown in fig 1.61.
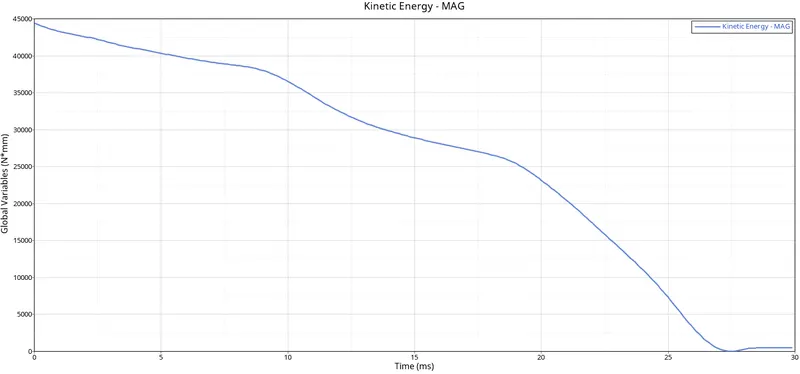
fig1.61
*When both the objects come in contact with each other. If deformable bodies get in contact, then only the contact energy increases. Since the rigid Wall is a rigid body and the Crash Tube is a deformable body, So the contact energy is constant as shown in fig1.62.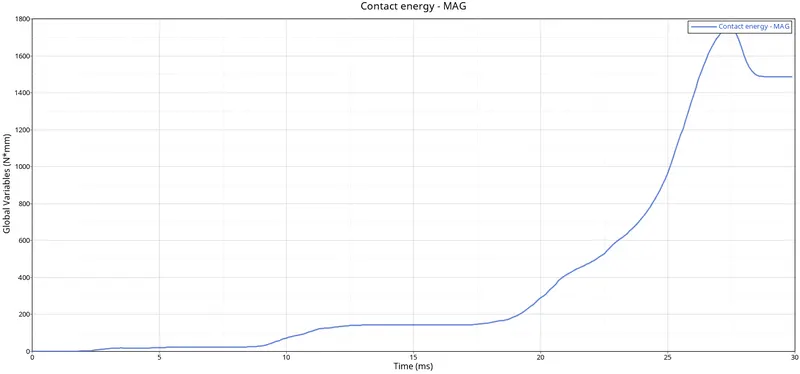
fig1.62
*For this case the Hourglass energy is zero because of the usage of the property parameters Ishell =24, Ismstr=2, Ish3n=2, N=5, and Iplas=1. The graph has been plotted for Hourglass energy and time as parameters as shown in fig 1.63.
fig1.63
*Since Total energy is the summation of all the energies so at the start there will only be Internal energy so the total energy will be equal until the deformation starts Total energy averages all energies with respect to time. The graph has been plotted for Total energy and time as parameters as shown in fig 1.64.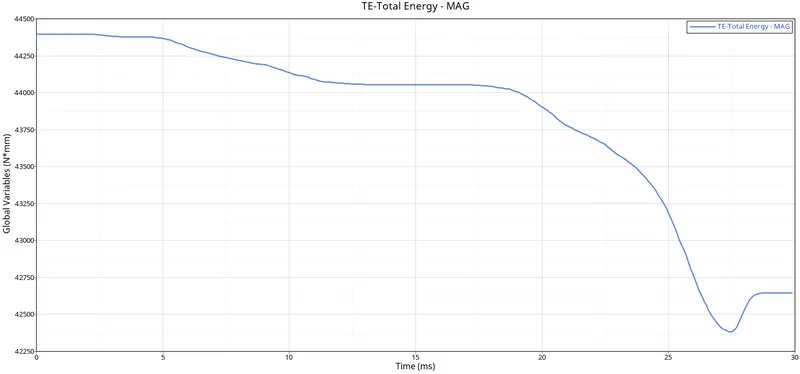
fig1.64
*The graphs have been plotted by using hypergraph 2D for rigid wall forces, internal energy, hourglass energy, contact energy, and total energy and are verified simultaneously as shown in fig 1.65.
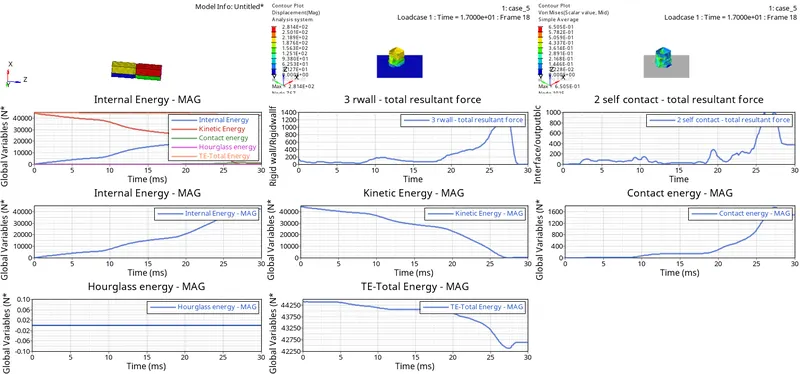
fig1.65
CASE 6
*The Model has to have a notch in center of the opposite sides so by using element offset option the notch is created in the center and run as shown in fig1.66
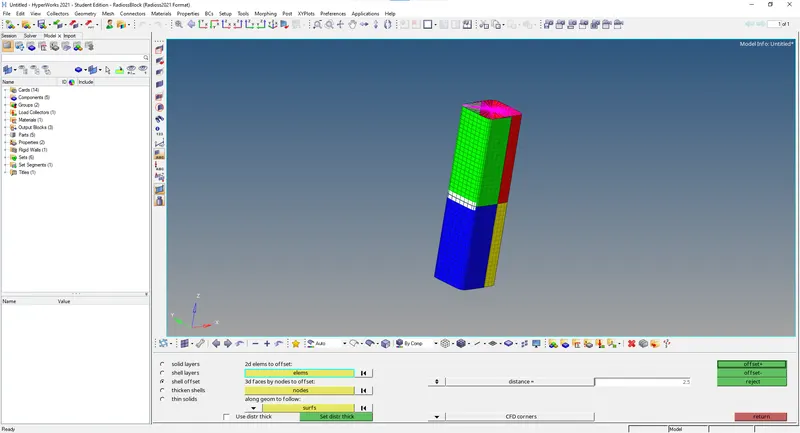
fig1.66
*The simulations are run on hyper view for displacement and Von Mises and have been animated as shown in fig 1.67.
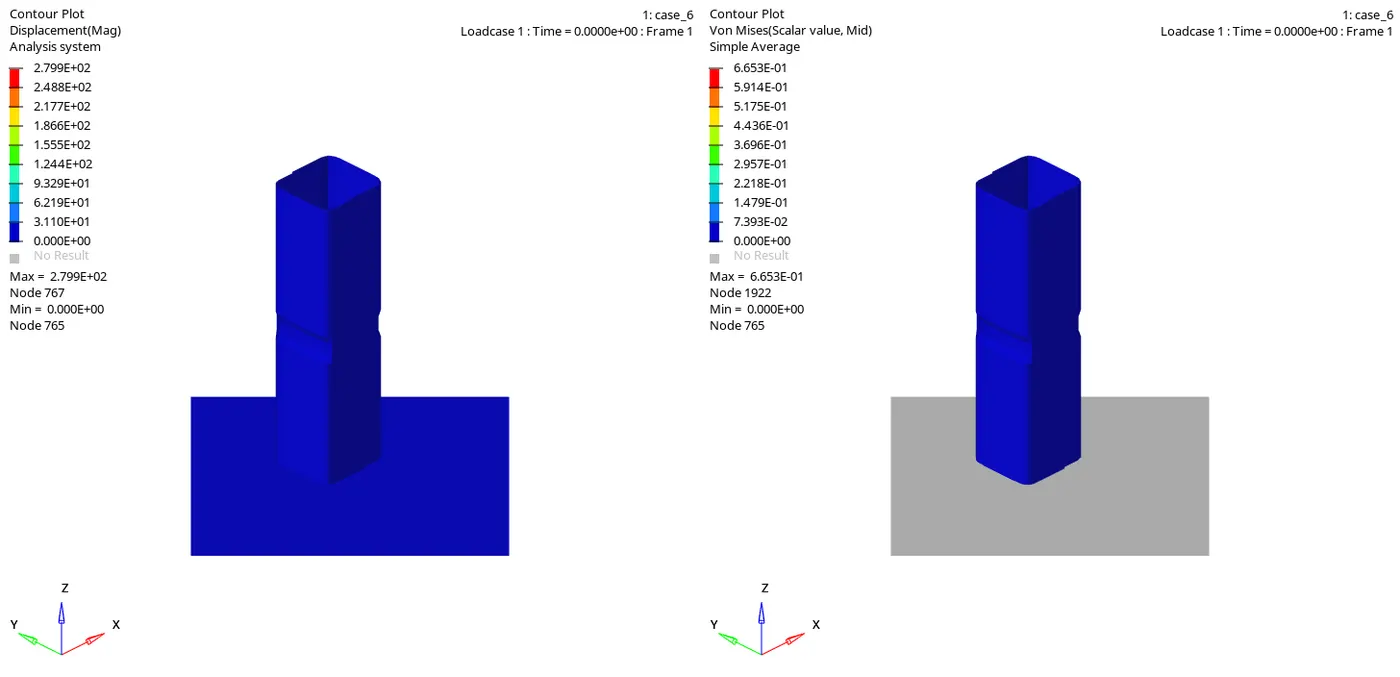
fig1.68
*Hypergraph 2D mode is turned on and graphs have been plotted for Internal energy, Kinetic energy, Hourglass energy, Contact energy, and total energy graphs concerning global variables for Case as shown in fig 1.69.
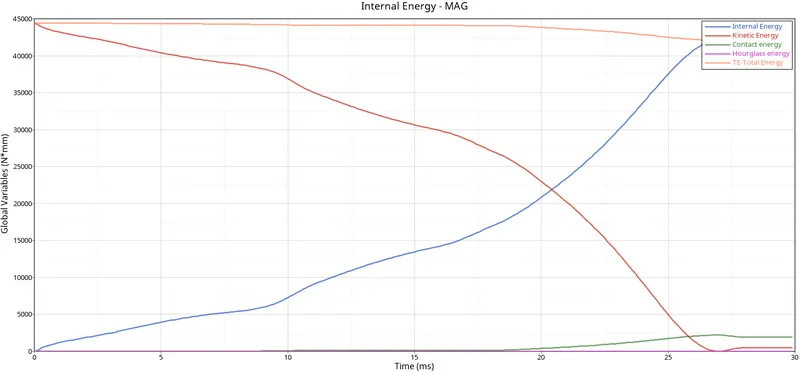
fig1.69
*For the Rigid forces, there is no contact between the Crash Tube and rigid wall. So the curve is in origin. When the rigid Wall hits on the Crash Tube, the curve starts increasing and suddenly the curve starts decreasing, Once, there will be no contact after the elements get deleted which is shown in fig 1.70.
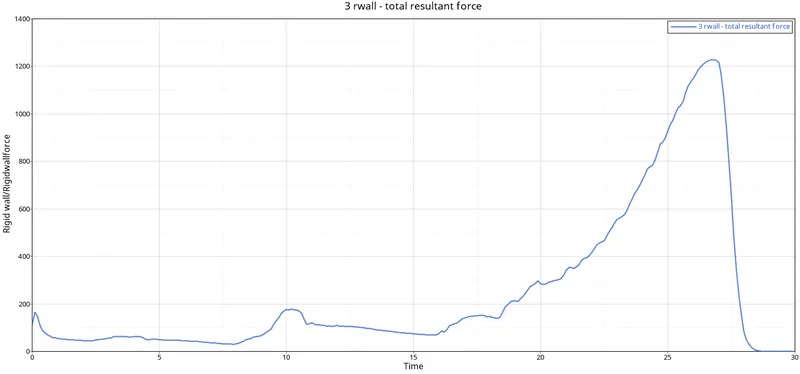
fig1.70
*The graph is been plotted for the components with self contact with neighboring components for TYPE 7 as shown in fig 1.71.
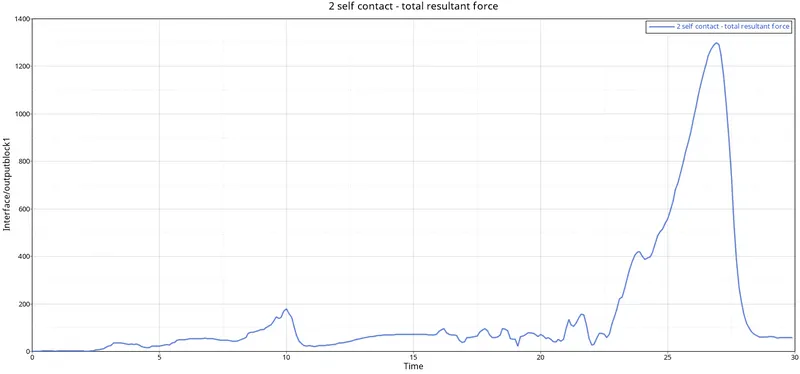
fig1.71
*The internal energy starts from origin due to there being no contact between the rigid wall and Crash Tube. So the internal energy goes on increasing, proportionally the deformation or displacement is happening, when the displacement increases the internal energy increases as shown in fig1.72.
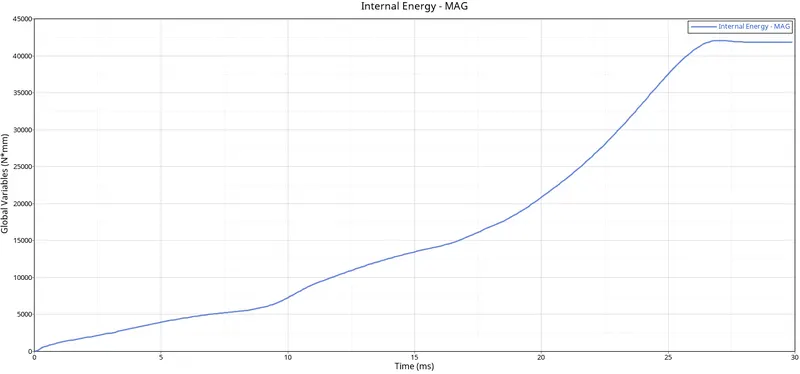
fig1.72
* Kinetic energy is plotted for the Crash tube, the Crash tube will be moving it will be having some velocity. So due to some velocity, there will be kinetic energy. When the impactor hits the car model the energy will transfer to the model and the kinetic energy of the model gets increases the kinetic energy goes on increasing as shown in fig 1.73.
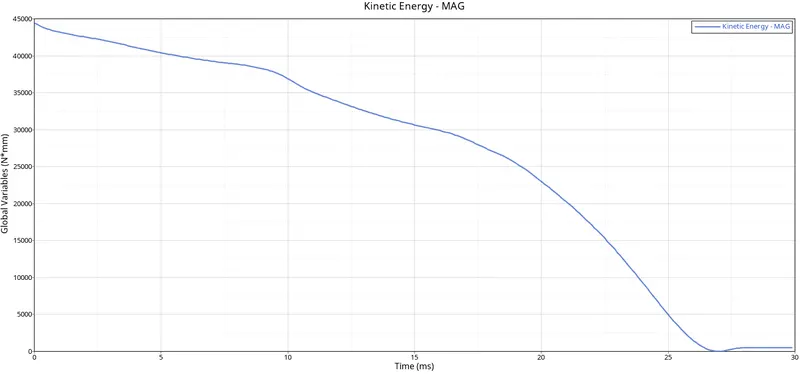
fig1.73
*When both the objects come in contact with each other. If deformable bodies get in contact, then only the contact energy increases. Since the rigid Wall is a rigid body and the Crash Tube is a deformable body, So the contact energy is constant as shown in fig1.74.
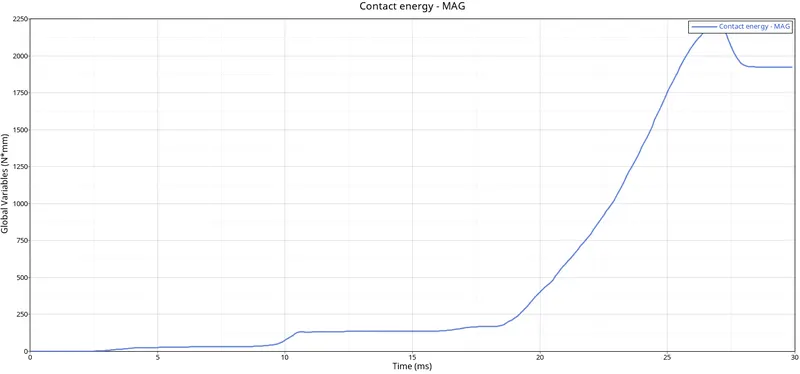
fig1.74
*For this case the Hourglass energy is zero because of the usage of the property parameters Ishell =24, Ismstr=2, Ish3n=2, N=5, and Iplas=1. The graph has been plotted for Hourglass energy and time as parameters as shown in fig 1.75.
fig1.75
*Since Total energy is the summation of all the energies so at the start there will only be Internal energy so the total energy will be equal until the deformation starts Total energy averages all energies with respect to time. The graph has been plotted for Total energy and time as parameters as shown in fig 1.76.
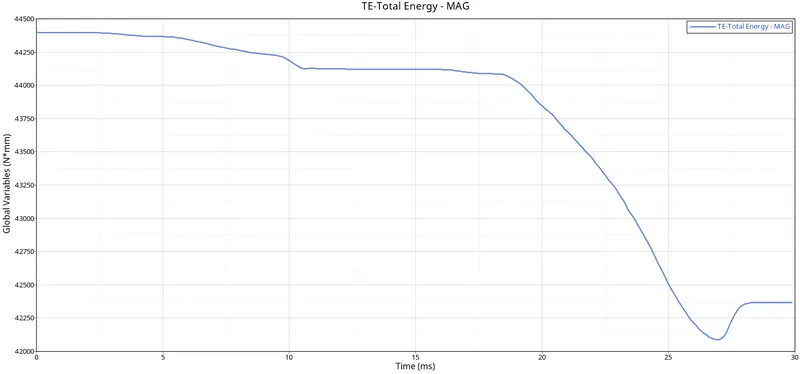
fig1.76
*The graphs have been plotted by using hypergraph 2D for rigid wall forces, internal energy, hourglass energy, contact energy, and total energy and are verified simultaneously as shown in fig 1.77.
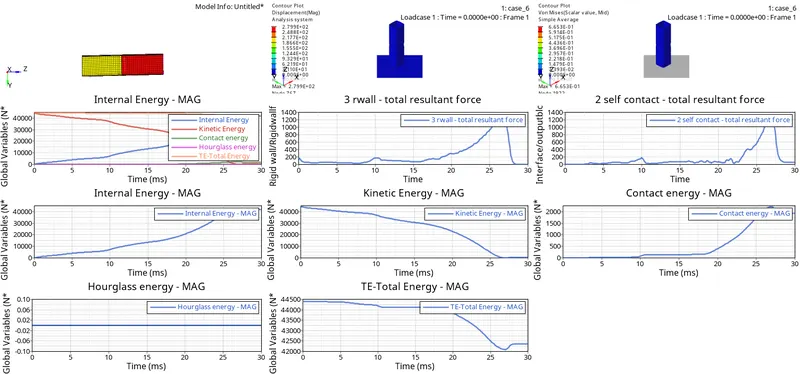
fig1.77
RESULT:-The simulation were run for the mentioned cases and the graphs, animations are taken .