Assignment 4-RADIOSS Material Laws Challenge
AIM: - To simulate the plate and rigid ball by using Law 2 Johnson-Cook Material and Law 27 Elasto Plastic Material with Brittle Failure as per the cases given in the question by using Radioss solver.
OBJECTIVE: -
- Importing the model and running the simulation without changing the time step and Tfreq values.
- For case 1, LAW 2 no values will be changed.
- The simulations are run on hyper view for displacement and Von Mises.
- To check the energy error and mass error for the base simulation.
- To plot the graphs by using hypergraph 2D for rigid wall forces, internal energy, hourglass energy, contact energy, and total energy.
- For case 2, LAW 2 values which are to be changed are Ifail_sh=1,Dadv=1,Ixfem=1.
- The simulations are run on hyper view for displacement and Von Mises.
- To check the energy error and mass error for the base simulation.
- To plot the graphs by using hypergraph 2D for rigid wall forces, internal energy, hourglass energy, contact energy, and total energy.
- For case 3, LAW 2 the failure card is deleted.
- The simulations are run on hyper view for displacement and Von Mises.
- To check the energy error and mass error for the base simulation.
- To plot the graphs by using hypergraph 2D for rigid wall forces, internal energy, hourglass energy, contact energy, and total energy.
- For case 4, LAW 2 Delete the EPS_P_Max Value from the Material Card.
- The simulations are run on hyper view for displacement and Von Mises.
- To check the energy error and mass error for the base simulation.
- To plot the graphs by using hypergraph 2D for rigid wall forces, internal energy, hourglass energy, contact energy, and total energy.
- For case 5 changing the Material Card to LAW 1.
- The simulations are run on hyper view for displacement and Von Mises.
- To check the energy error and mass error for the base simulation.
- To plot the graphs by using hypergraph 2D for rigid wall forces, internal energy, hourglass energy, contact energy, and total energy.
- For case 6 changing the material card to LAW 27 and change the shell properties to the recommended shell properties.
- The simulations are run on hyper view for displacement and Von Mises.
- To check the energy error and mass error for the base simulation.
- To plot the graphs by using hypergraph 2D for rigid wall forces, internal energy, hourglass energy, contact energy, and total energy.
- For case 7 change the material card to LAW 36.
- The simulations are run on hyper view for displacement and Von Mises.
- To check the energy error and mass error for the base simulation.
- To plot the graphs by using hypergraph 2D for rigid wall forces, internal energy, hourglass energy, contact energy, and total energy.
- Comparing the values for all the cases and tabulating them.
THEORETICAL EXPLANATION: -
LAW 1 LINEAR ELASTIC MATERIAL
- Linear Elastic Material defines an isotropic, linear elastic material using Hooke’s law. This law represents a linear relationship between stress and strain. It is available for truss, beam (type 3 only), shell, and solid elements as shown in fig 1.1.
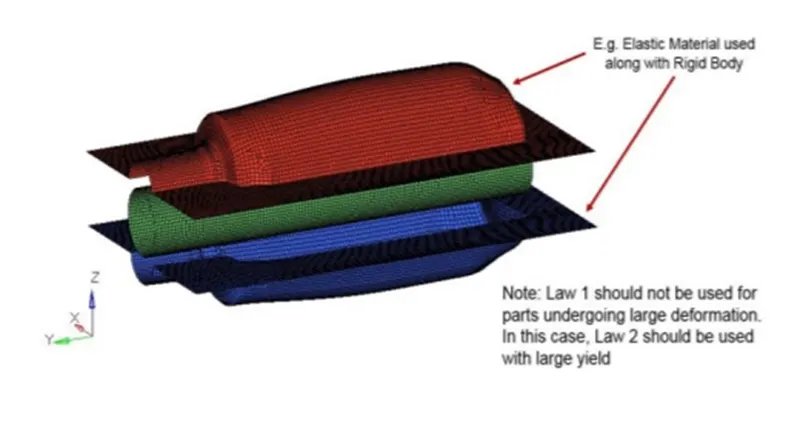
fig 1.1
- This material law is used to model purely elastic materials. The material stiffness is determined by only two values: The Young’s modulus (E), and Poisson’s ratio (n). The shear modulus (G) can be computed using E and n:
LAW 2 JOHNSON-COOK PLASTICITY MODEL
- In this law the material behaves as linear elastic when the equivalent stress is lower than the yield stress.
- For the higher value of stress, the material behavior is plastic. This law is valid for brick, shell, truss, and beam elements.
- The Graph shows a typical stress-strain curve in the elastic region. When the maximum stress is reached during computation, the stress remains constant and the material undergoes deformation until the maximum plastic strain. Element rupture occurs if the plastic strain is larger than as shown in fig1.2.
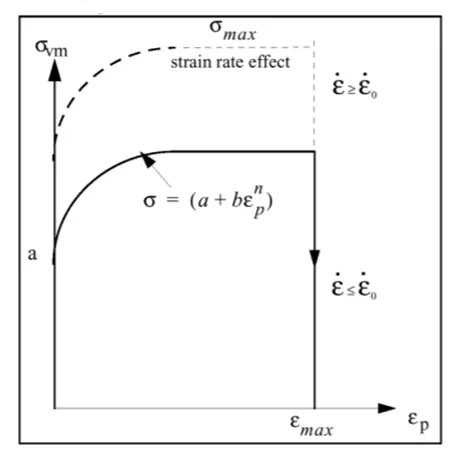
fig1.2
- If the element is a shell, the ruptured element is deleted. If the element is solid, the ruptured element has its deviatoric stress tensor permanently set to zero, but the element is not deleted. Therefore, the material rupture is modeled without any damaging effect.
LAW 27 BRITTLE DAMAGE FOR JOHNSON-COOK PLASTICITY MODEL
- For shell applications, a simple damage model can be associated with this law to take into account the brittle failure as shown in fig 1.3.
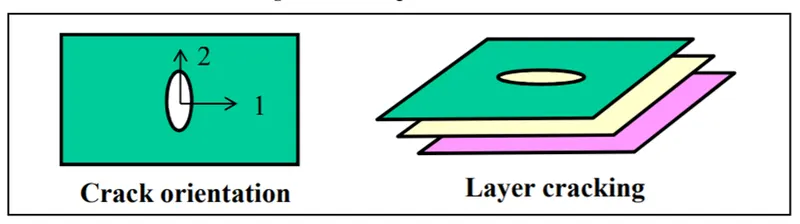
fig1.3
- The crack propagation occurs in the plan of shell in the case of mono-layer property and through the thickness if a multi-layer property is defined Damage Affected Material the elastic-plastic behavior of the material is defined by Johnson-Cook model.
- This law combines an isotropic elastoplastic Johnson-Cook material model with an orthotropic brittle failure model. Material damage is accounted for before failure.
- Failure and damage occur only in tension. This law is applicable only for shells.
- Yield surface definition same as Johnson-Cook (Law2) Useful for modeling brittle failure of glass Damage and rupture defined with 4 parameters for each principal direction as shown in fig 1.4.
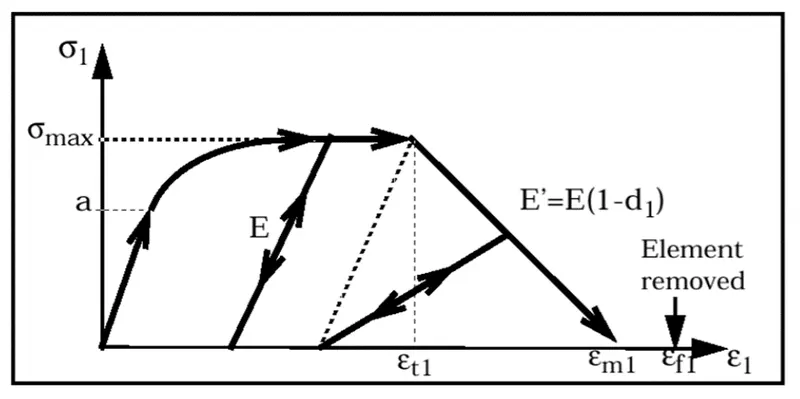
fig 1.4
LAW 36 TABULATED PIECEWISE LINEAR
- The elastic-plastic behavior of isotropic material is modeled with user-defined functions for work hardening curves.
- The elastic portion of the material stress-strain curve is modeled using the elastic modulus, E, and Poisson's ratio. The hardening behavior of the material is defined in the function of plastic strain for a given strain rate as shown in fig 1.5.
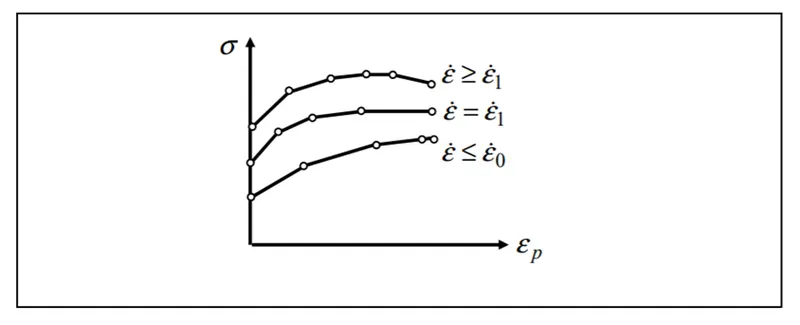
fig1.5
- An arbitrary number of material plasticity curves can be defined for different strain rates. For a given strain rate, a linear interpolation of stress for plastic strain change can be used.
- This is the case of law 36 in RADIOSS. For a given plastic strain, a linear interpolation of stress for strain rate change is used. Compared to the Johnson-Cook model (law 2), there is no maximum value for the stress.
- The curves are extrapolated if the plastic deformation is larger than the maximum plastic strain. The hardening model may be isotropic, kinematic, or a combination of the two models as the material failure model is the same as in Zhao law.
Failure cards
- at = 1 (Default) solid element is deleted
- at= 2 For each integration point, the deviatoric stress tensor vanishes
- at = 1 (Default)
- Then Dadv = 1 (max accumulation damage value D, used for crack initiation).
- at= 0 (Default) Without XFEM.
- at = 1 XFEM formulation.
- at=2 (Integer).
PROCEDURE:-
CASE 1
*The model has been imported from the solver deck as shown in fig 1.6.
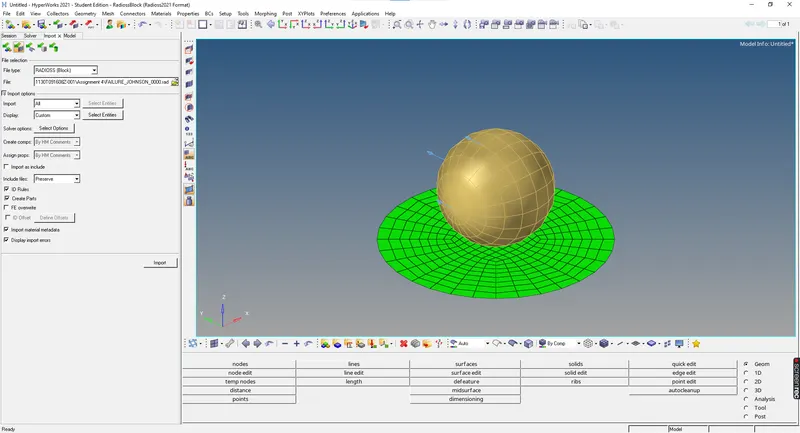
fig 1.6
*There is no change in the material properties the case 1 is ready for simulations as shown in fig 1.7.
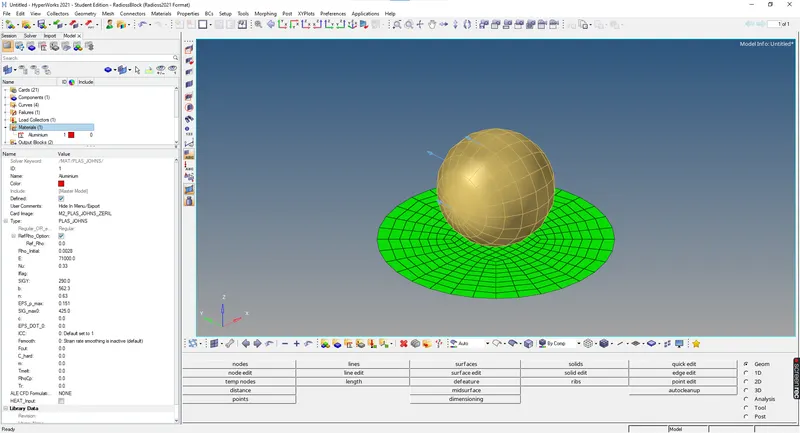
fig1.7
*The model is been analyzedelapsed and the no of cycles and elapsed time is displayed as shown in fig1.8.
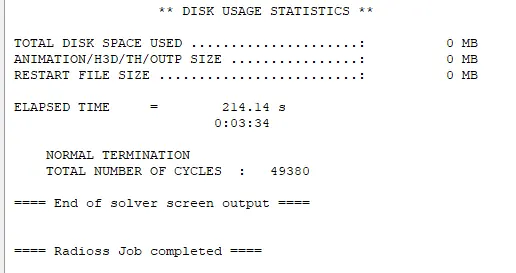
fig1.8
*Engine Output File [00001. out] has been generated after analysis. The Engine Output File [00001. out] contains the data of the analyzed errors as shown in fig 1.9.
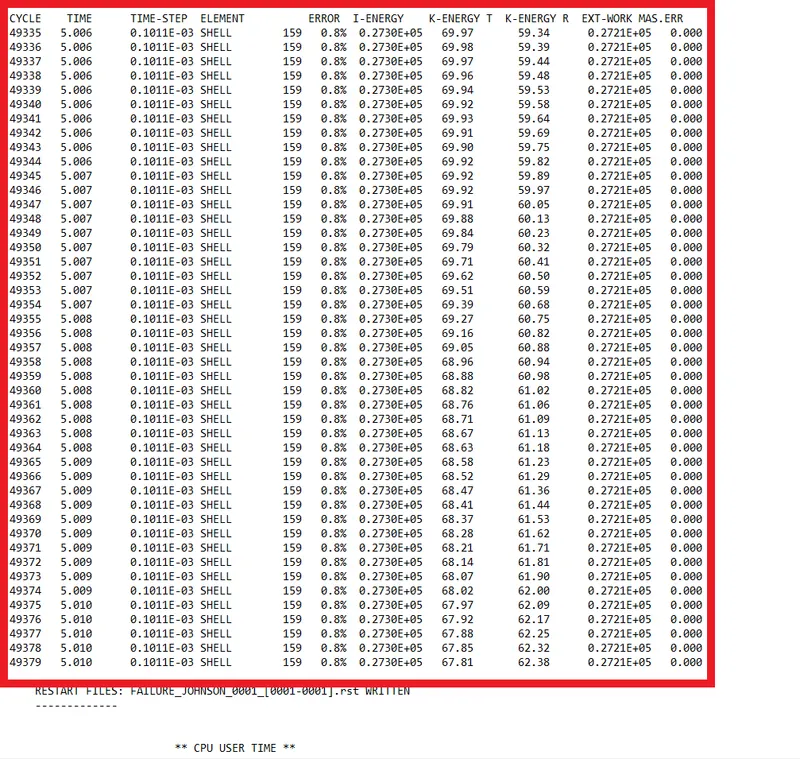
fig 1.9
*The simulations are run on hyper view for displacement and Von Mises and have been animated as shown in fig 1.10.
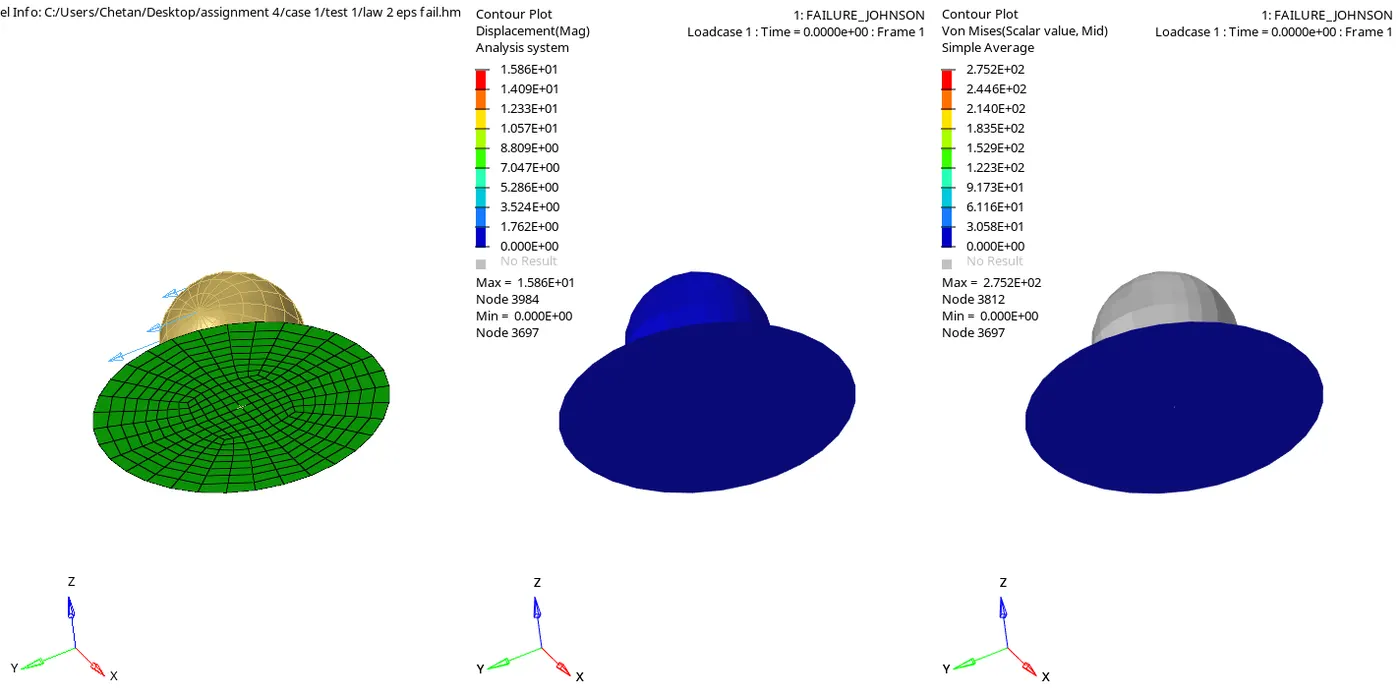
fig 1.10
*Hypergraph 2D mode is turned on and graphs have been plotted for Internal energy, Kinetic energy, Hourglass energy, Contact energy, and total energy graphs concerning global variables for Case as shown in fig 1.11.
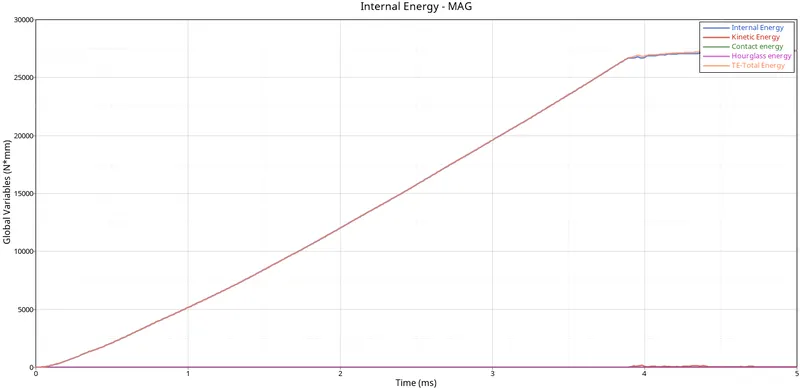
fig 1.11
*For the Rigid forces, there is no contact between the plate and rigid wall. So the curve is in origin. When the rigid ball hits on the rupture plate, the curve starts increasing and suddenly the curve starts decreasing, Once, there will be no contact after the elements get deleted which is shown in1.13.
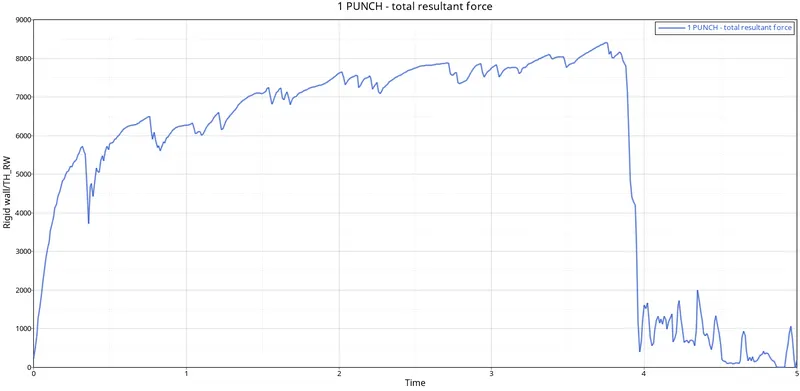
fig 1.13
*The internal energy starts from origin due to there being no contact between the rigid ball and rupture plate. So the internal energy goes on increasing, proportionally the deformation or displacement is happening, when the displacement increases the internal energy increases as shown in fig1.14.
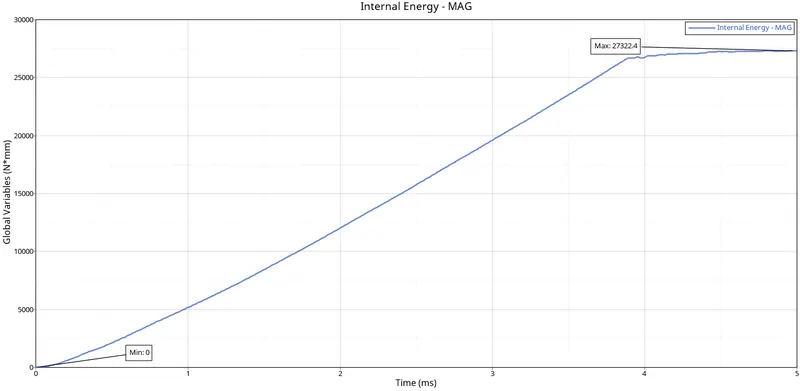
fig 1.14
*The Kinetic energy starts at a small value and gradually peaks up and the Cause of the Noise and Vibrations will be produced when the rigid ball hits the rupture plate, so the kinetic energy curve is in a waveform as shown in fig 1.15.
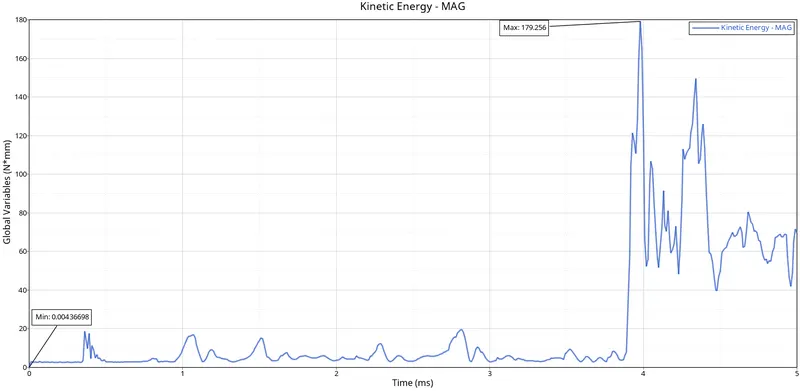
fig 1.15
*Due to elements are deleting when both the objects come in contact with each other. If deformable bodies get in contact, then only the contact energy increases. Since the rigid ball is a rigid body and the rupture plate is a deformable body, So the contact energy is constant as shown in fig1.16.
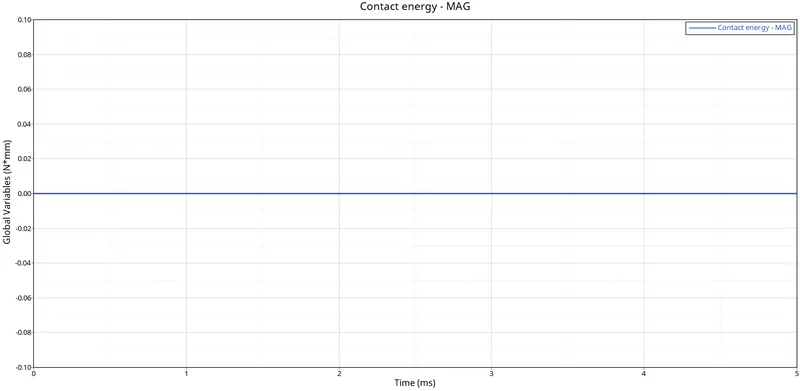
fig 1.16
*For this case the Hourglass energy is zero because of the usage of the property parameters Ishell =24, Ismstr=2, Ish3n=2, N=5, and Iplas=1. The graph has been plotted for Hourglass energy and time as parameters as shown in fig 1.17.
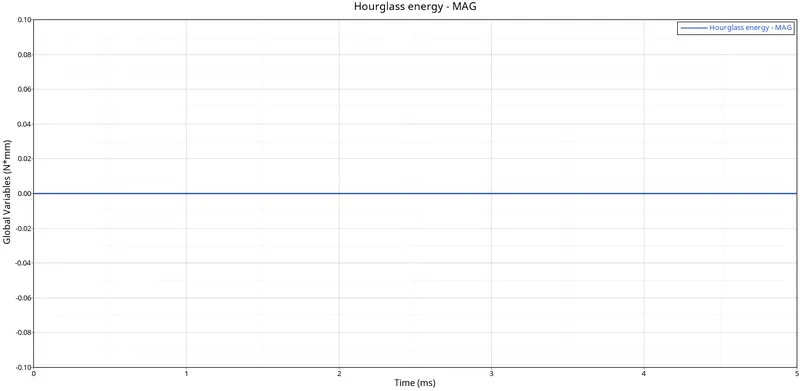
fig 1.17
*Since Total energy is the summation of all the energies so at the start there will only be Kinetic energy so the total energy will be equal until the deformation starts Total energy averages all energies with respect to time. The graph has been plotted for Total energy and time as parameters as shown in fig 1.18.
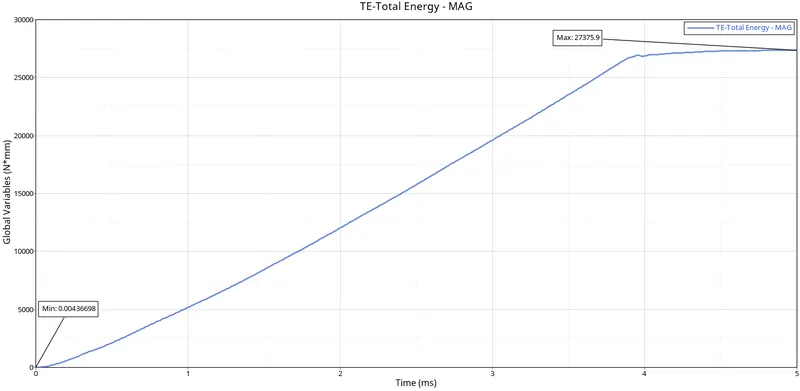
fig 1.18
*The graphs have been plotted by using hypergraph 2D for rigid wall forces, internal energy, hourglass energy, contact energy, and total energy and are verified siminatusly as shown in fig 1.19.
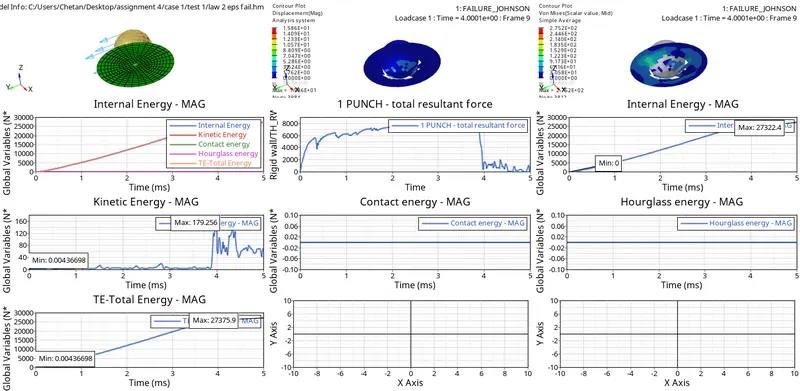
fig 1.19
CASE 2
*For case 2, LAW 2 values that are to be changed are Ifail_sh=1, Dadv=1, Ixfem=1 as shown in fig 1.21.
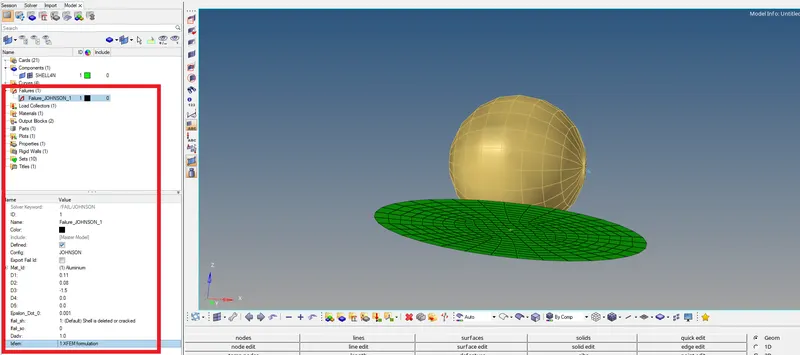
fig 1.21
*The model is been analyzed and the no of cycles and elapsed time is displayed as shown in fig1.22.
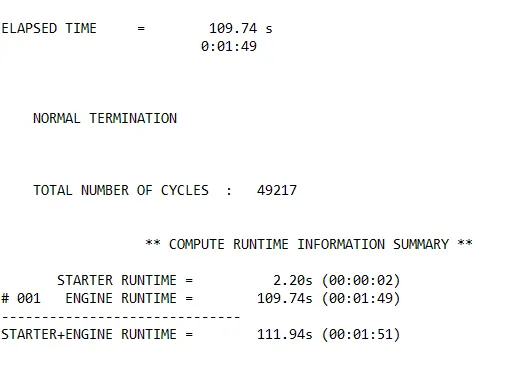
fig 1.22
*Engine Output File [00001. out] has been generated after analysis. The Engine Output File [00001. out] contains the data of the analyzed errors as shown in fig 1.23.
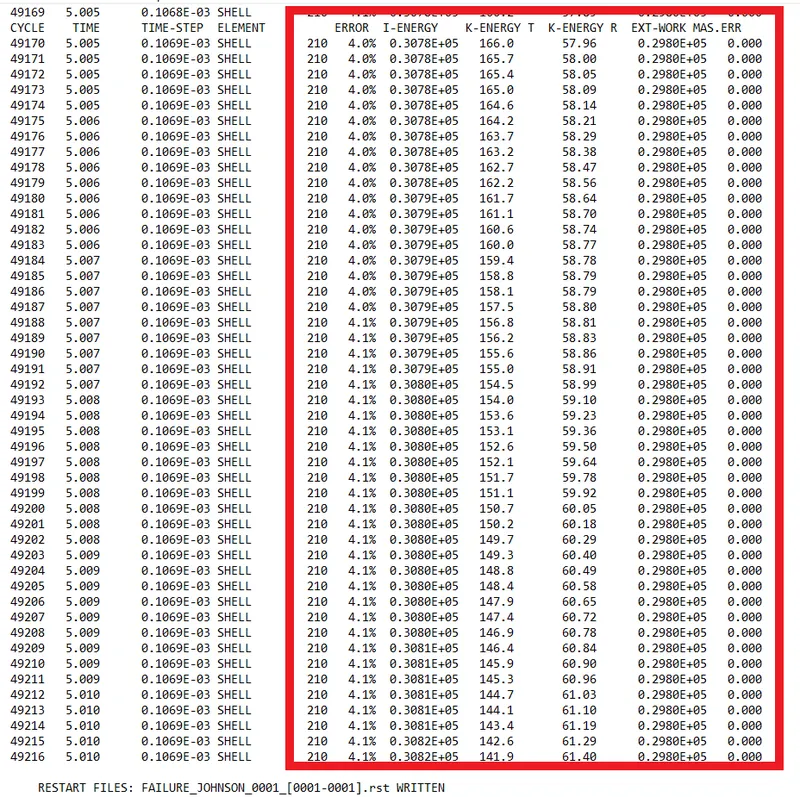
fig 1.23
*The simulations are run on hyper view for displacement and Von Mises and have been animated as shown in fig 1.24 .
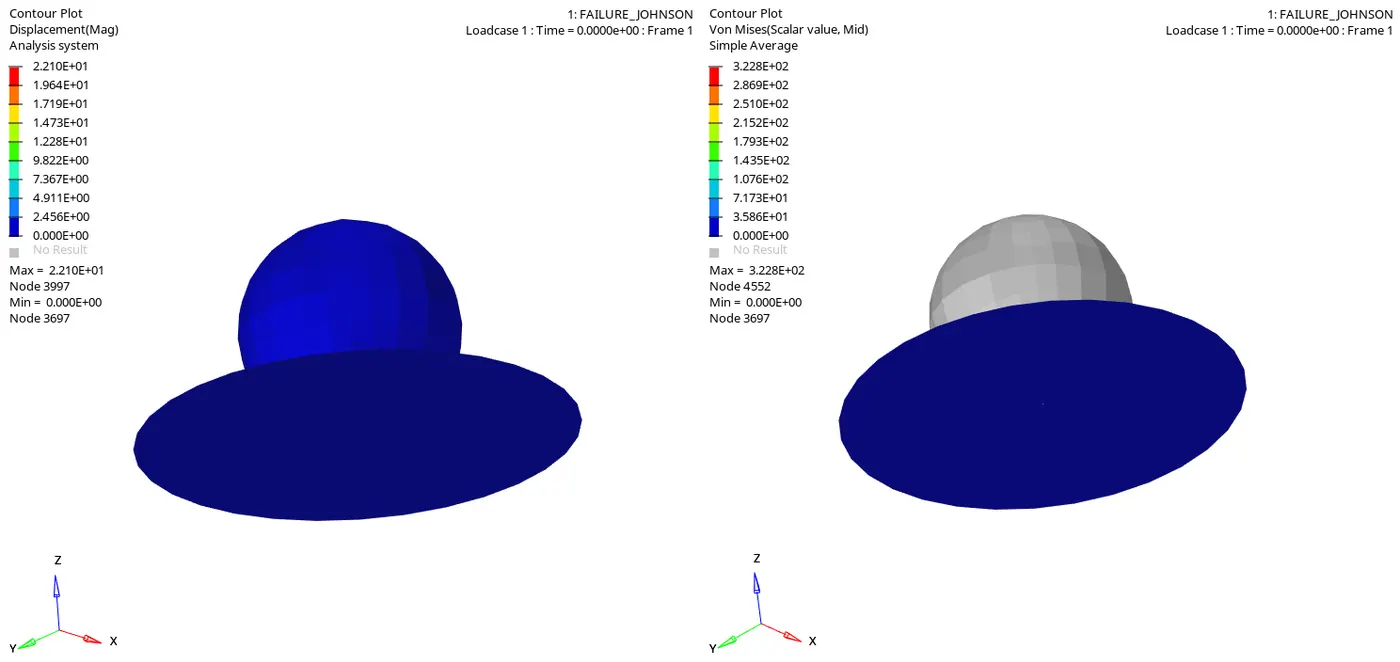
fig 1.24
*Hypergraph 2D mode is turned on and graphs have been plotted for Internal energy, Kinetic energy, Hourglass energy, Contact energy, and total energy graphs concerning global variables for Case as shown in fig 1.25.
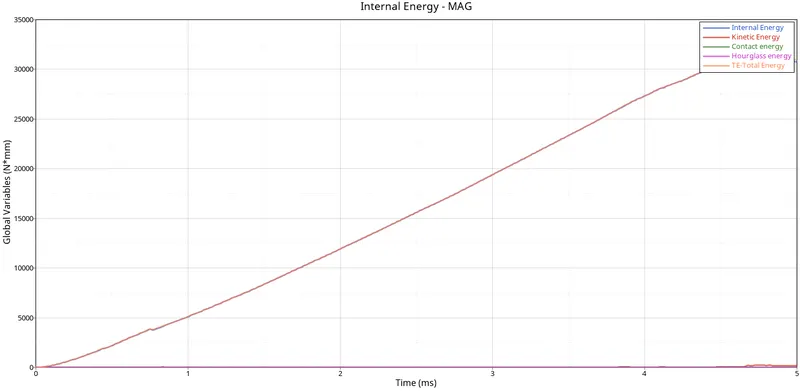
fig 1.25
*For the Rigid forces, there is no contact between the plate and rigid wall. So the curve is in origin. When the rigid ball hits on the rupture plate, the curve starts increasing and suddenly the curve starts decreasing, Once, there will be no contact after the elements get deleted which is shown in fig 1.27.
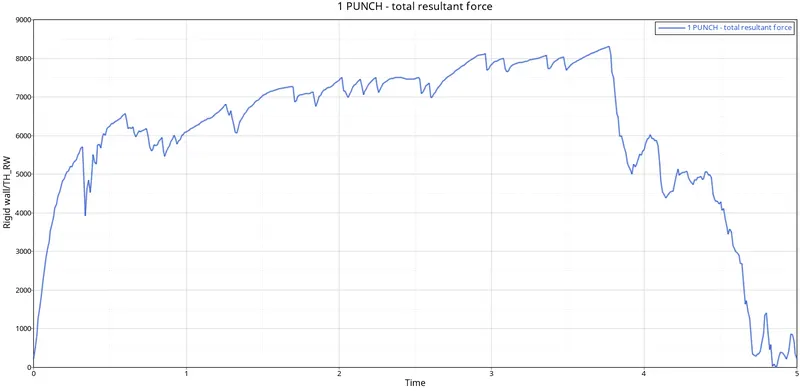
fig 1.27
*The internal energy starts from origin due to there being no contact between the rigid ball and rupture plate. So the internal energy goes on increasing, proportionally the deformation or displacement is happening, when the displacement increases the internal energy increases as shown in fig1.28.
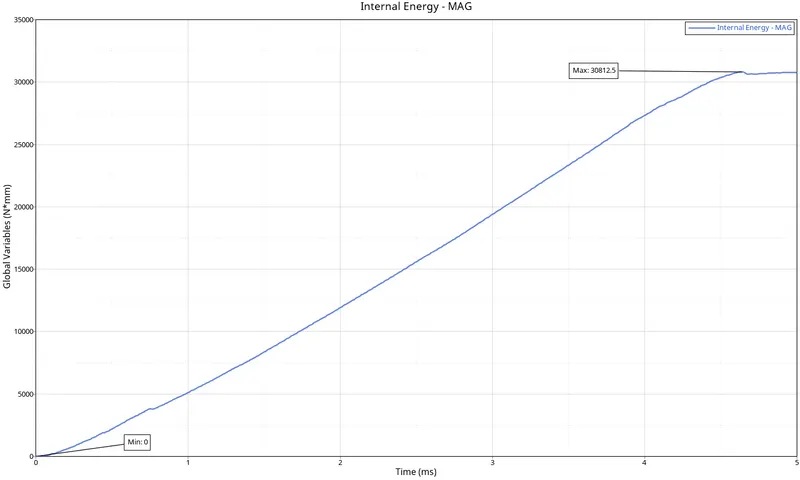
fig 1.28
*The Kinetic energy starts at a small value and gradually peaks up and the Cause of the Noise and Vibrations will be produced when the rigid ball hits the rupture plate, so the kinetic energy curve is in a waveform as shown in fig 1.29.
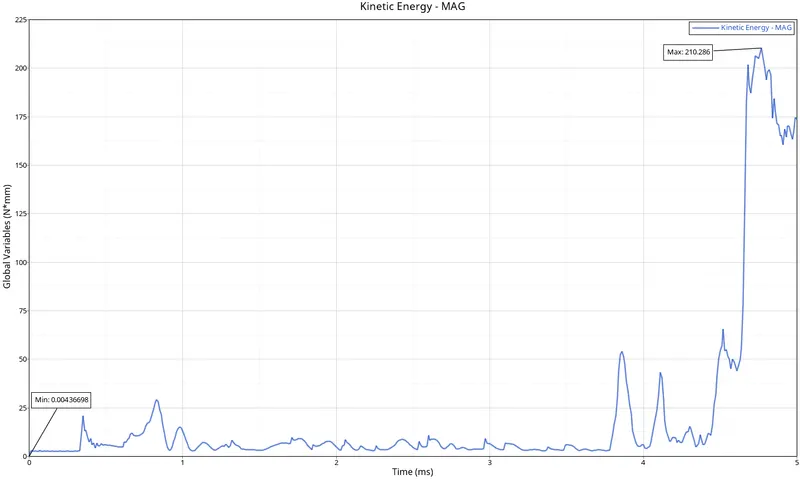
fig 1.29
*Due to elements are deleting when both the objects come in contact with each other. If deformable bodies get in contact, then only the contact energy increases. Since the rigid ball is a rigid body and the rupture plate is a deformable body, So the contact energy is constant as shown in fig1.30.
fig 1.30
*For this case the Hourglass energy is zero because of the usage of the property parameters Ishell =24, Ismstr=2, Ish3n=2, N=5, and Iplas=1. The graph has been plotted for Hourglass energy and time as parameters as shown in fig 1.31.
fig 1.31
*Since Total energy is the summation of all the energies so at the start there will only be Kinetic energy so the total energy will be equal until the deformation starts Total energy averages all energies with respect to time. The graph has been plotted for Total energy and time as parameters as shown in fig 1.32.
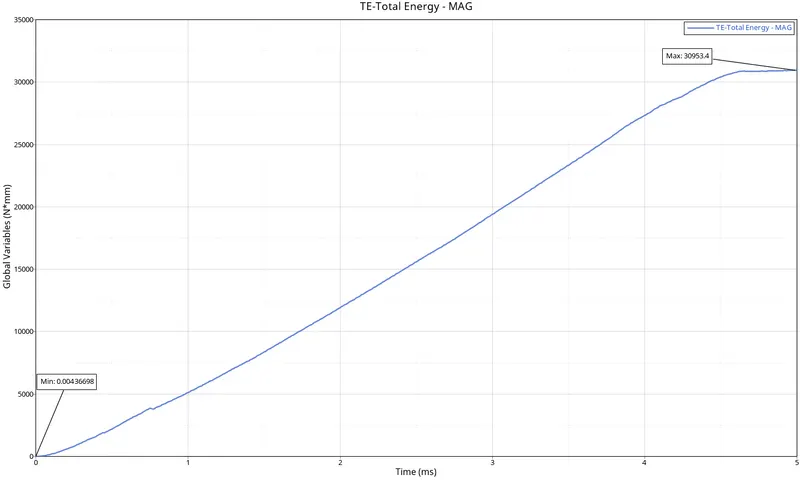
fig 1.32
*The graphs have been plotted by using hypergraph 2D for rigid wall forces, internal energy, hourglass energy, contact energy, and total energy and are verified siminatusly as shown in fig 1.33.
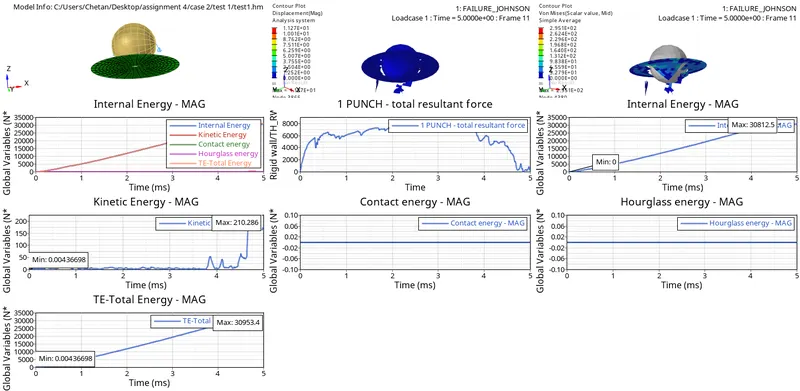
fig 1.33
CASE 3
For case 3, LAW 2 the failure card is deleted as shown in fig 1.35.
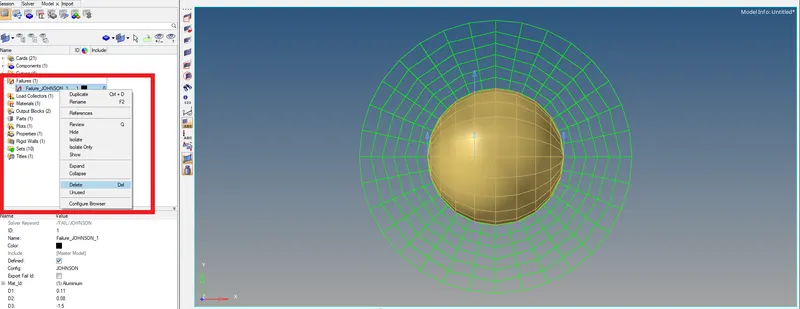
fig 1.35
*The model is been analyzed and the no of cycles and elapased time is displayed as shown in fig1.36.
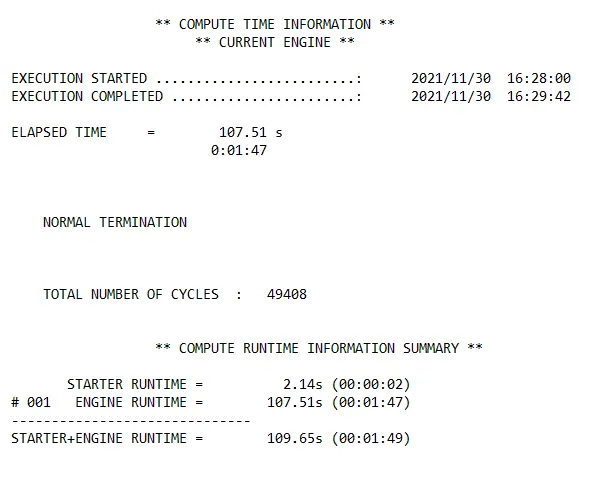
fig 1.36
*Engine Output File [00001. out] has been generated after analysis. The Engine Output File [00001. out] contains the data of the analyzed errors as shown in fig 1.37.
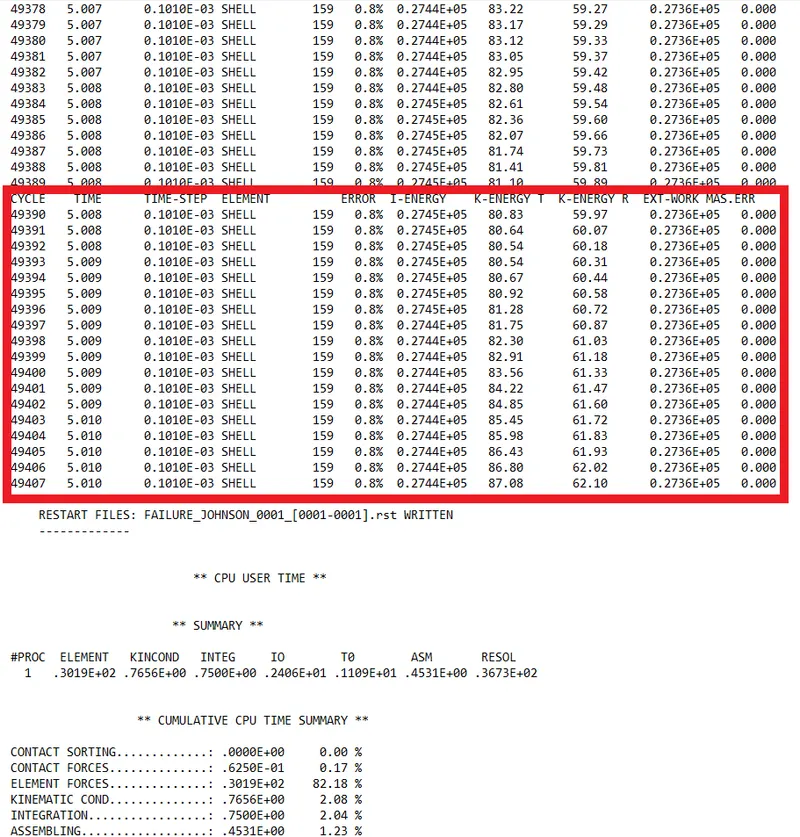
fig 1.37
*The simulations are run on hyper view for displacement and Von Mises and have been animated as shown in fig 1.38
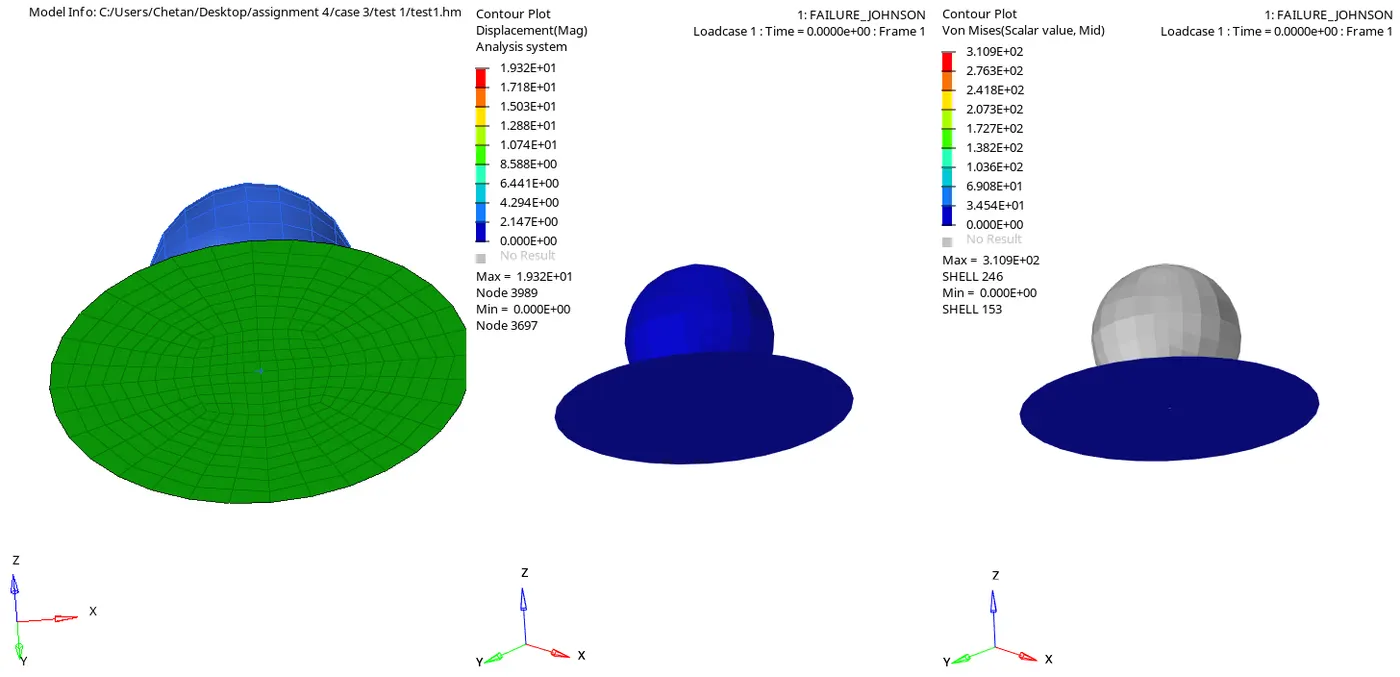
fig 1.38
*Hypergraph 2D mode is turned on and graphs have been plotted for Internal energy, Kinetic energy, Hourglass energy, Contact energy, and total energy graphs concerning global variables for Case as shown in fig 1.39.
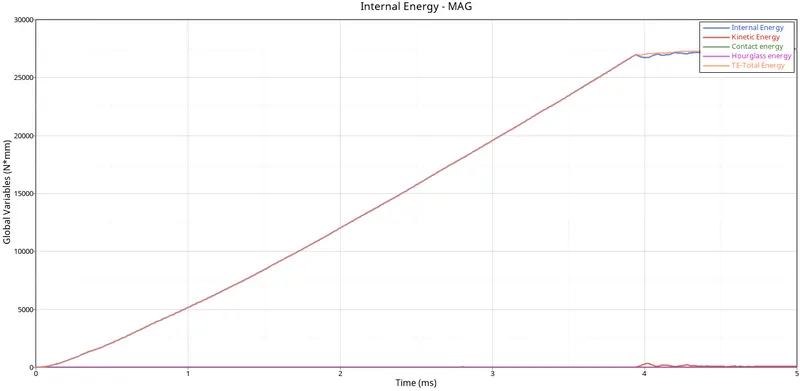
fig 1.39
*For the Rigid forces, there is no contact between the plate and rigid wall. So the curve is in origin. When the rigid ball hits on the rupture plate, the curve starts increasing and suddenly the curve starts decreasing, Once, there will be no contact after the elements get deleted which is shown in1.41.
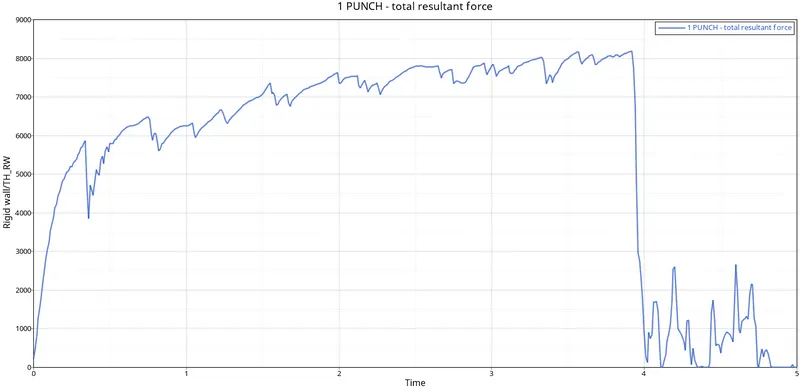
fig1.41
*The internal energy starts from origin due to there being no contact between the rigid ball and rupture plate. So the internal energy goes on increasing, proportionally the deformation or displacement is happening, when the displacement increases the internal energy increases as shown in fig1.42.
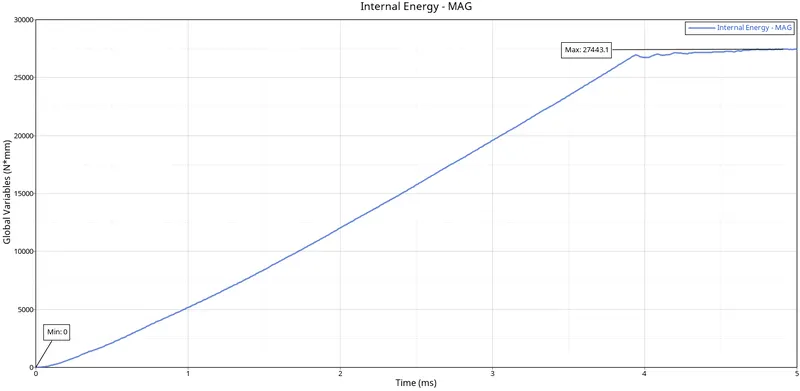
fig1.42
*The Kinetic energy starts at a small value and gradually peaks up and the Cause of the Noise and Vibrations will be produced when the rigid ball hits the rupture plate, so the kinetic energy curve is in a waveform as shown in fig 1.43.
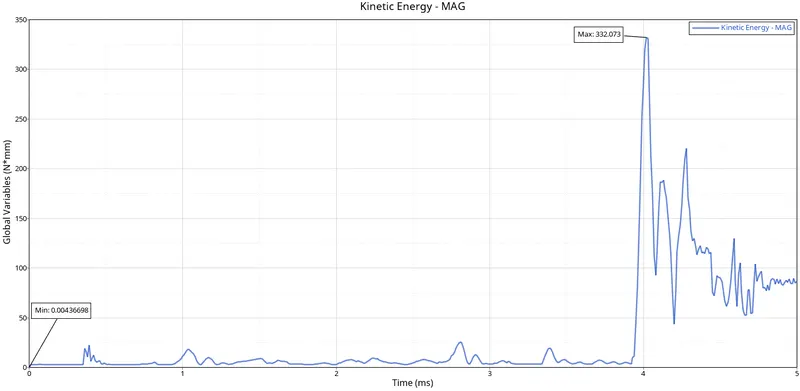
fig1.43
*Due to elements are deleting when both the objects come in contact with each other. If deformable bodies get in contact, then only the contact energy increases. Since the rigid ball is a rigid body and the rupture plate is a deformable body, So the contact energy is constant as shown in fig1.44.
fig1.44
*For this case the Hourglass energy is zero because of the usage of the property parameters Ishell =24, Ismstr=2, Ish3n=2, N=5, and Iplas=1. The graph has been plotted for Hourglass energy and time as parameters as shown in fig 1.45.
fig1.45
*Since Total energy is the summation of all the energies so at the start there will only be Kinetic energy so the total energy will be equal until the deformation starts Total energy averages all energies with respect to time. The graph has been plotted for Total energy and time as parameters as shown in fig 1.46.
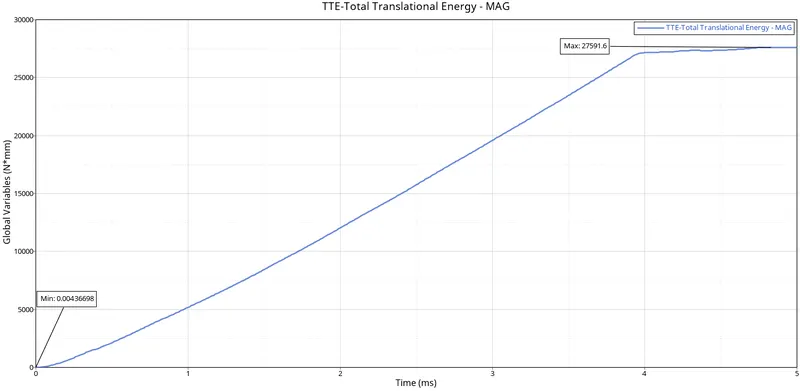
fig1.46
*The graphs have been plotted by using hypergraph 2D for rigid wall forces, internal energy, hourglass energy, contact energy, and total energy and are verified siminatusly as shown in fig 1.47.
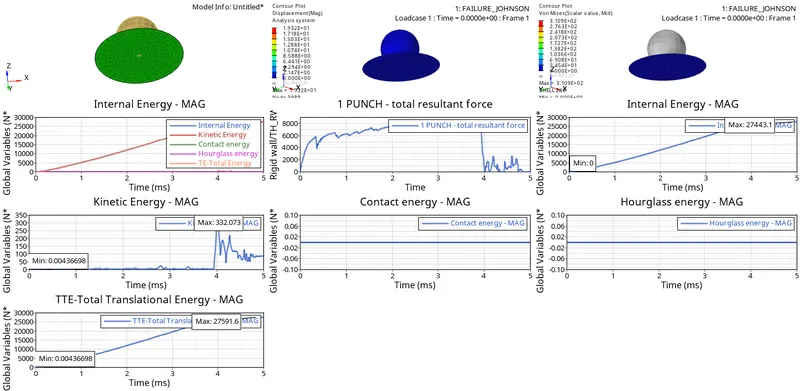
fig1.47
CASE 4
For case 4, LAW 2 Delete the EPS_P_Max Value from the Material Cardas shown in fig 1.49.
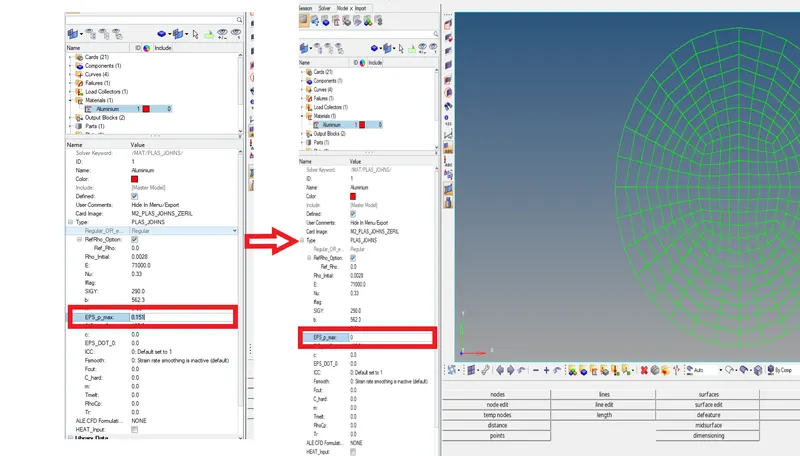
fig1.49
*The model is been analyzed and the no of cycles and elapsed time is displayed as shown in fig1.50.
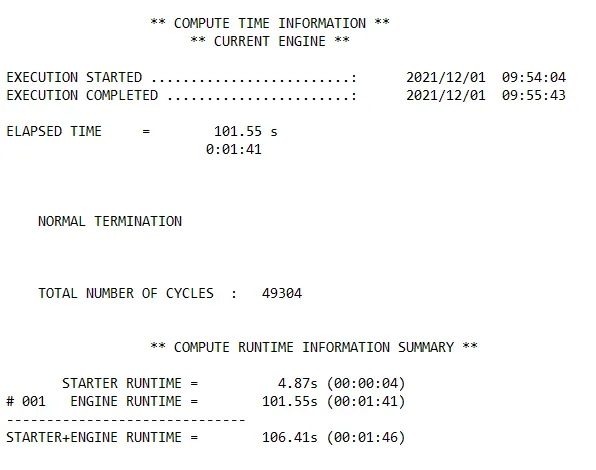
fig1.50.
*Engine Output File [00001. out] has been generated after analysis. The Engine Output File [00001. out] contains the data of the analyzed errors as shown in fig 1.51.
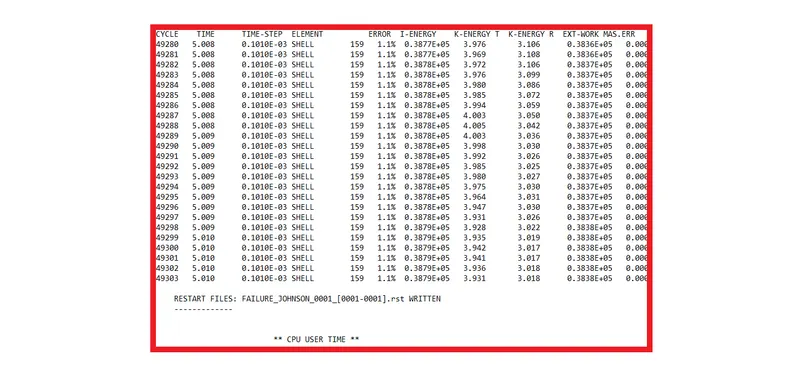
fig1.51
*The simulations are run on hyper view for displacement and Von Mises and have been animated as shown in fig 1.52 .
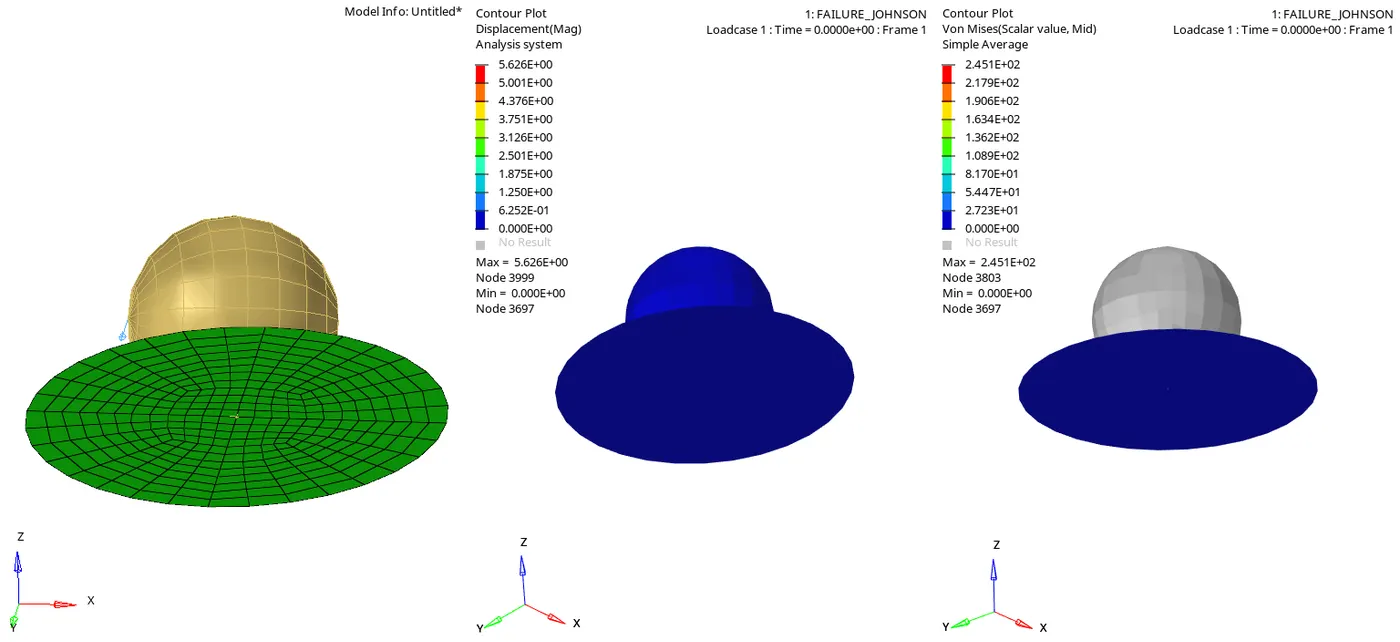
fig1.52
*Hypergraph 2D mode is turned on and graphs have been plotted for Internal energy, Kinetic energy, Hourglass energy, Contact energy, and total energy graphs concerning global variables for Case as shown in fig 1.53.
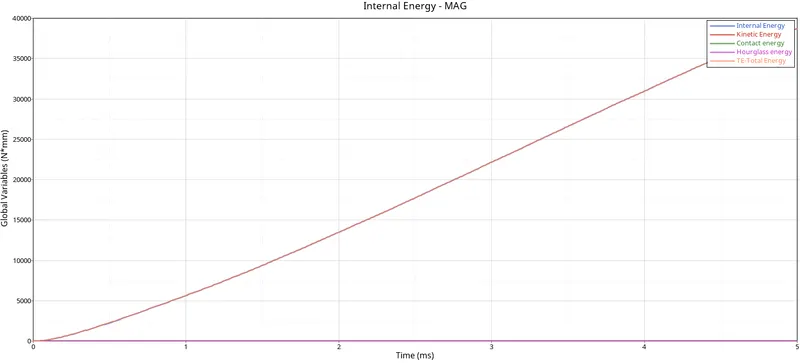
fig1.53.
*For the Rigid forces, there is no contact between the plate and rigid wall. So the curve is in origin. When the rigid ball hits on the rupture plate, the curve starts increasing and suddenly the curve starts decreasing, Once, there will be no contact after the elements get deleted which is shown in fig 1.55.
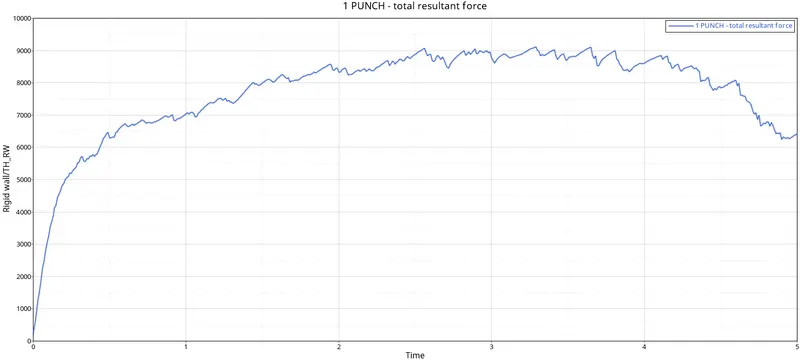
fig1.55
*The internal energy starts from origin due to there being no contact between the rigid ball and rupture plate. So the internal energy goes on increasing, proportionally the deformation or displacement is happening, when the displacement increases the internal energy increases as shown in fig1.56.
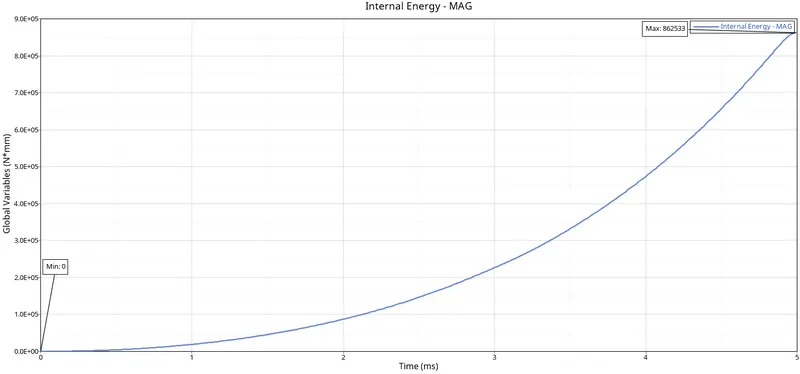
fig1.56
*The Kinetic energy starts at a small value and gradually peaks up and the Cause of the Noise and Vibrations will be produced when the rigid ball hits the rupture plate, so the kinetic energy curve is in a waveform as shown in fig 1.57.
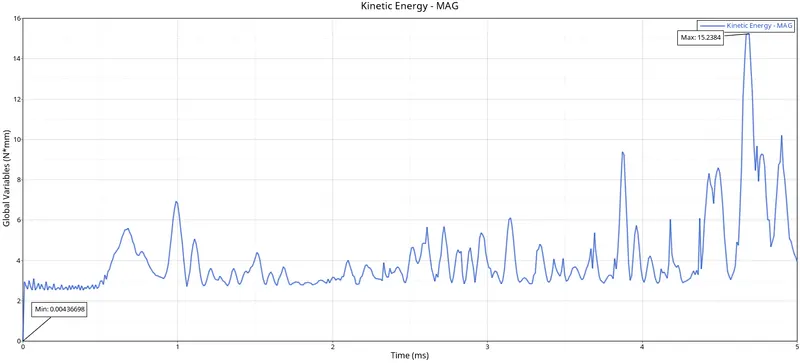
fig1.57
*Due to elements are deleting when both the objects come in contact with each other. If deformable bodies get in contact, then only the contact energy increases. Since the rigid ball is a rigid body and the rupture plate is a deformable body, So the contact energy is constant as shown in fig1.58.
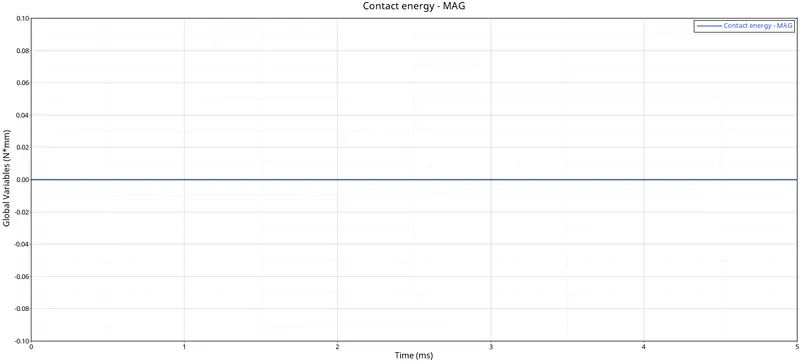
fig1.58
*For this case the Hourglass energy is zero because of the usage of the property parameters Ishell =24, Ismstr=2, Ish3n=2, N=5, and Iplas=1. The graph has been plotted for Hourglass energy and time as parameters as shown in fig 1.59.
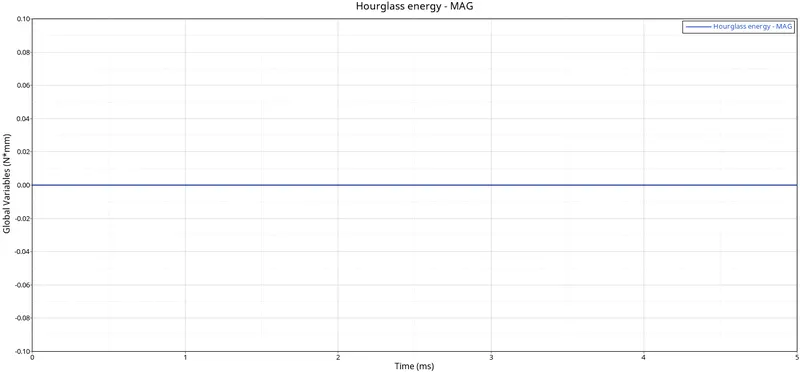
fig1.59
*Since Total energy is the summation of all the energies so at the start there will only be Kinetic energy so the total energy will be equal until the deformation starts Total energy averages all energies with respect to time. The graph has been plotted for Total energy and time as parameters as shown in fig 1.60.
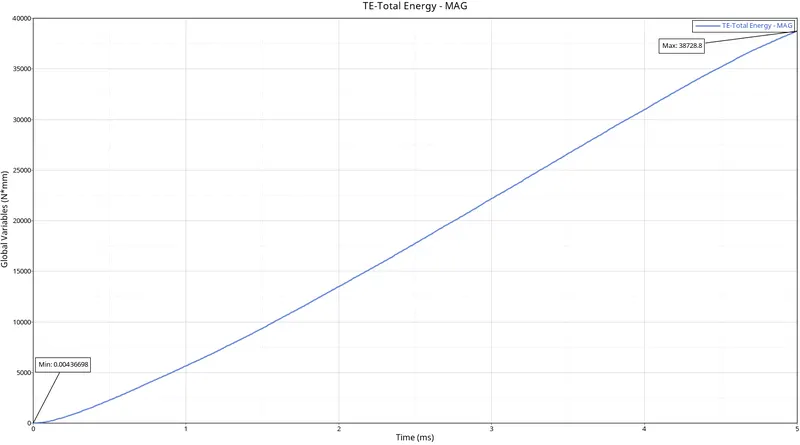
fig 1.60
*The graphs have been plotted by using hypergraph 2D for rigid wall forces, internal energy, hourglass energy, contact energy, and total energy and are verified siminatusly as shown in fig 1.61.
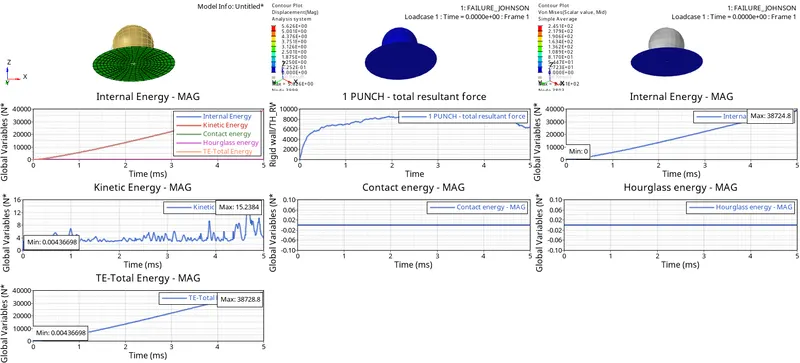
fig 1.61
CASE 5
For case 5 changing the Material Card to LAW 1 as shown in fig 1.63.
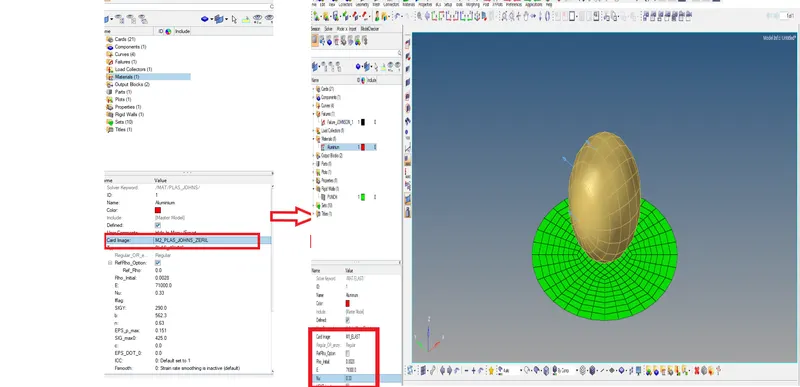
fig 1.63
*The model is been analyzed and the no of cycles and elapsed time is displayed as shown in fig1.64.
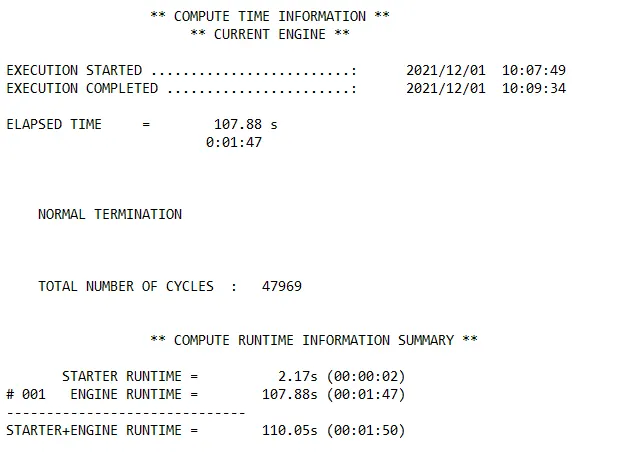
fig 1.64
*Engine Output File [00001. out] has been generated after analysis. The Engine Output File [00001. out] contains the data of the analyzed errors as shown in fig 1.65.
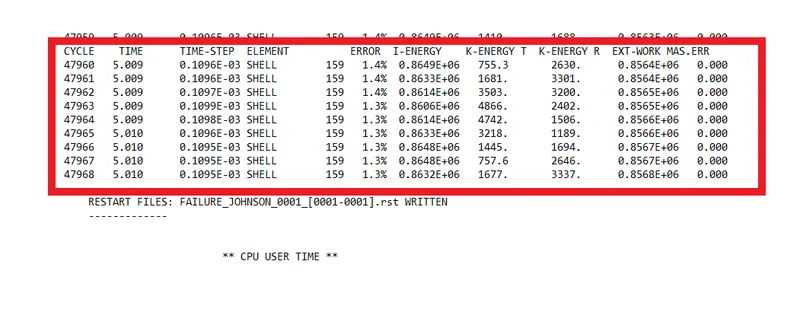
fig 1.65
*The simulations are run on hyper view for displacement and Von Mises and have been animated as shown in fig 1.66.
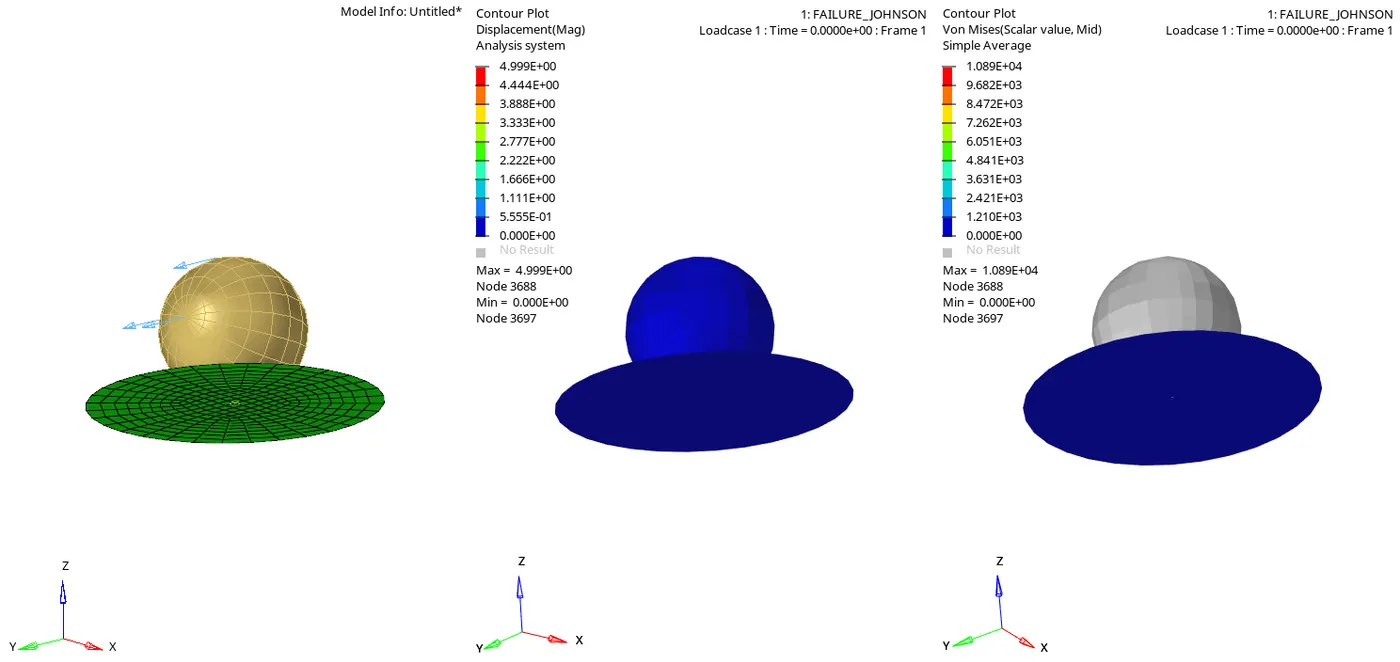
fig 1.66
*Hypergraph 2D mode is turned on and graphs have been plotted for Internal energy, Kinetic energy, Hourglass energy, Contact energy, and total energy graphs concerning global variables for Case as shown in fig 1.67.
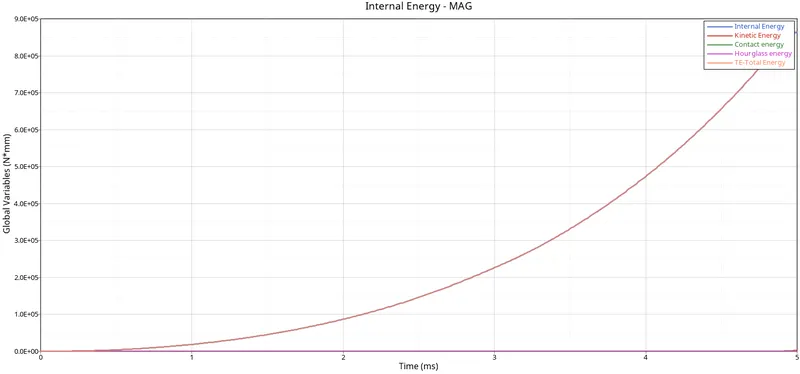
fig 1.67
*The graphs have been animated to show the simulation and graphs at each frame and the direction of the energy plot in comparison to each other as shown in fig 1.68.
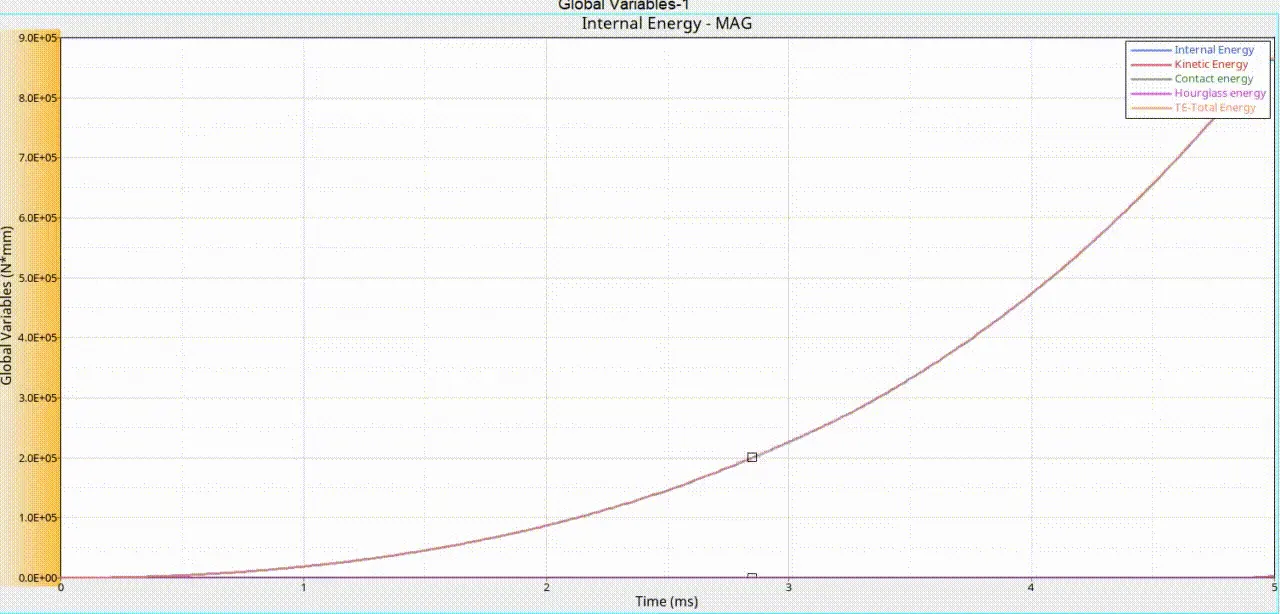
fig 1.68
*For the Rigid forces, there is no contact between the plate and rigid wall. So the curve is in origin. When the rigid ball hits on the rupture plate, the curve starts increasing and suddenly the curve starts decreasing, Once, there will be no contact after the elements get deleted which is shown in1.69.
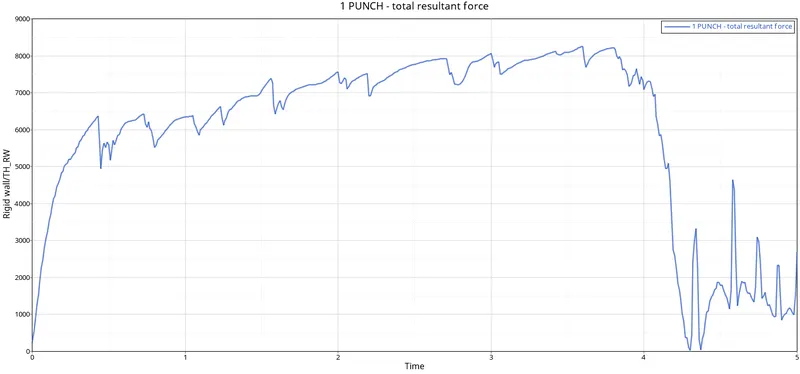
fig 1.69
*The internal energy starts from origin due to there being no contact between the rigid ball and rupture plate. So the internal energy goes on increasing, proportionally the deformation or displacement is happening, when the displacement increases the internal energy increases as shown in fig1.70.
fig 1.70
*The Kinetic energy starts at a small value and gradually peaks up and the Cause of the Noise and Vibrations will be produced when the rigid ball hits the rupture plate, so the kinetic energy curve is in a waveform as shown in fig 1.71.
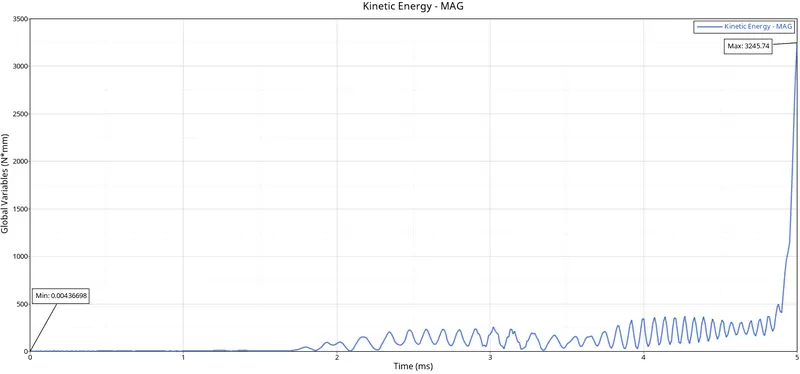
fig 1.71
*Due to elements are deleting when both the objects come in contact with each other. If deformable bodies get in contact, then only the contact energy increases. Since the rigid ball is a rigid body and the rupture plate is a deformable body, So the contact energy is constant as shown in fig1.72.
fig 1.72
*For this case the Hourglass energy is zero because of the usage of the property parameters Ishell =24, Ismstr=2, Ish3n=2, N=5, and Iplas=1. The graph has been plotted for Hourglass energy and time as parameters as shown in fig 1.73.
fig 1.73
*Since Total energy is the summation of all the energies so at the start there will only be Kinetic energy so the total energy will be equal until the deformation starts Total energy averages all energies with respect to time. The graph has been plotted for Total energy and time as parameters as shown in fig 1.74.
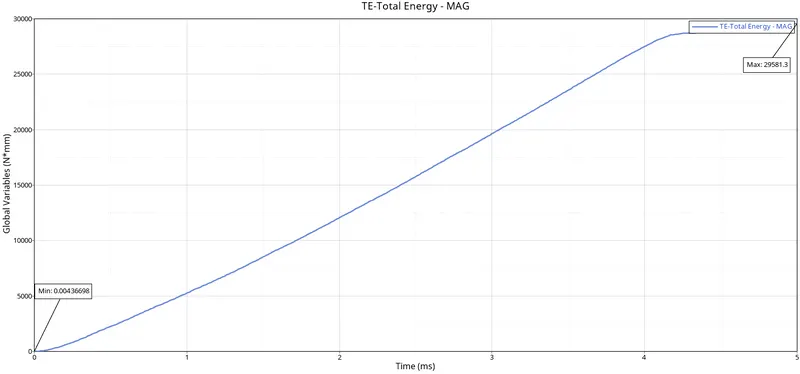
fig 1.74
*The graphs have been plotted by using hypergraph 2D for rigid wall forces, internal energy, hourglass energy, contact energy, and total energy and are verified siminatusly as shown in fig 1.75.
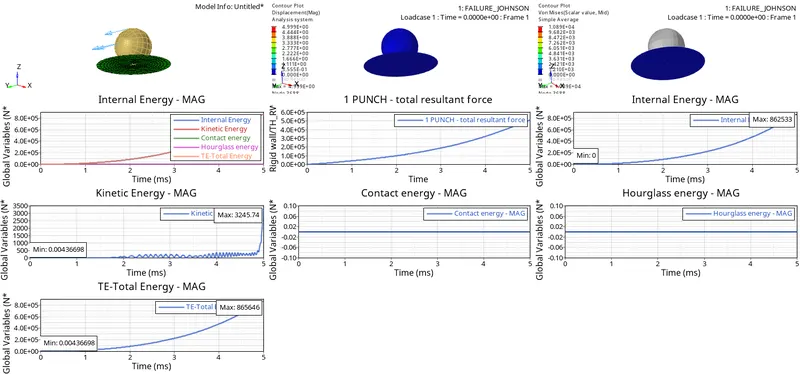
fig 1.75
CASE 6
For case 6 changing the material card to LAW 27 and change the shell properties to the recommended shell properties as shown in fig 1.77.
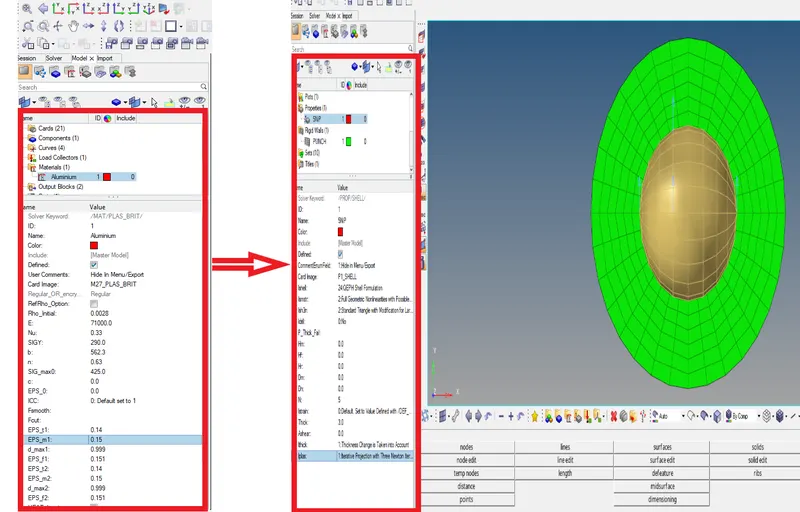
fig 1.77
*The model is been analyzed and the no of cycles and elapsed time is displayed as shown in fig1.78.
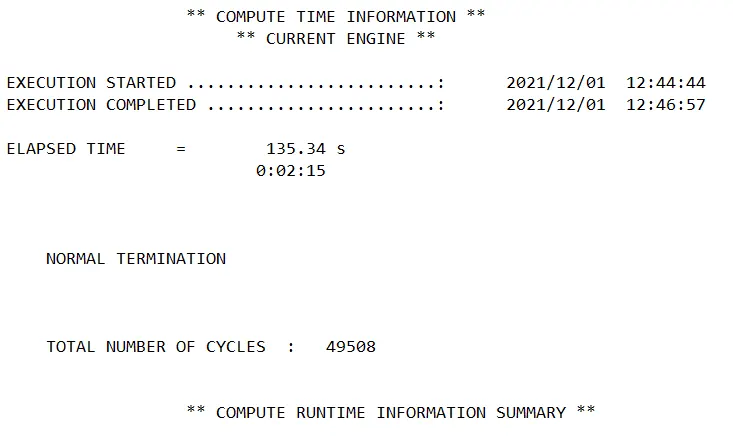
fig 1.78
*Engine Output File [00001. out] has been generated after analysis. The Engine Output File [00001. out] contains the data of the analyzed errors as shown in fig 1.79.
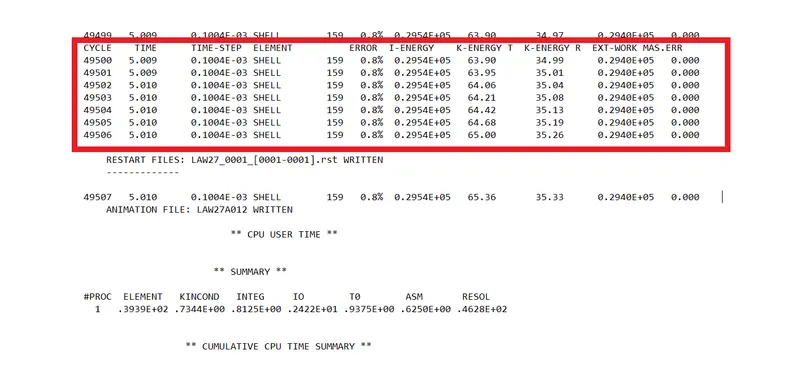
fig 1.79
*The simulations are run on hyper view for displacement and Von Mises and have been animated as shown in fig 1.80.
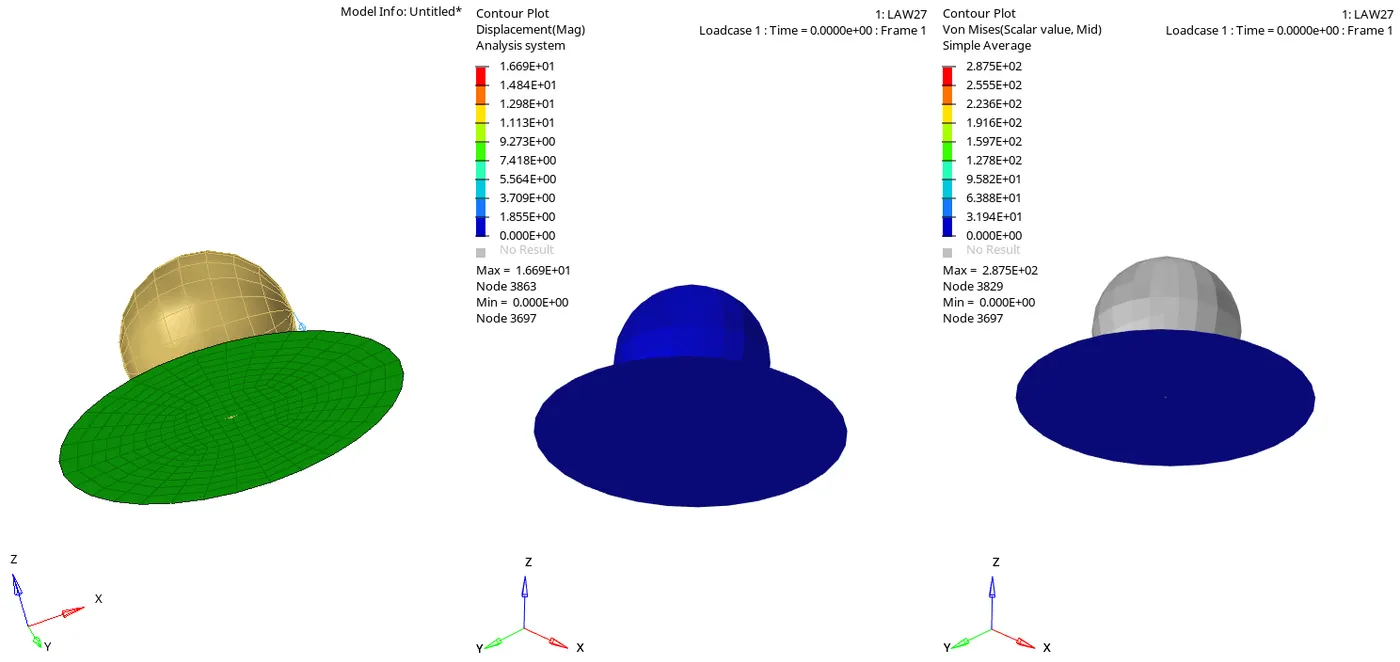
fig 1.80
*Hypergraph 2D mode is turned on and graphs have been plotted for Internal energy, Kinetic energy, Hourglass energy, Contact energy, and total energy graphs concerning global variables for Case as shown in fig 1.81.
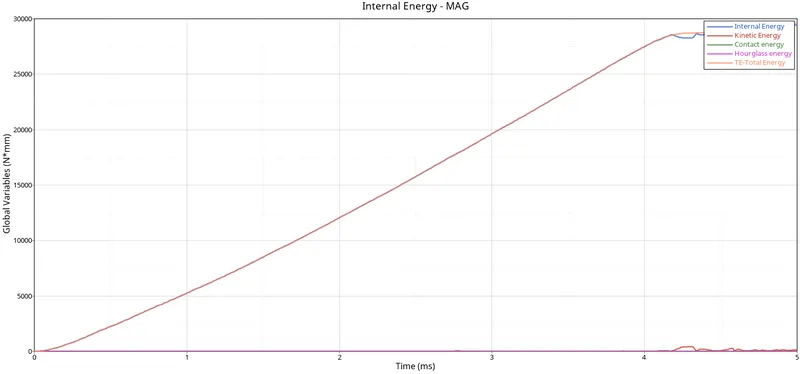
fig 1.81
*The graphs have been animated to show the simulation and graphs at each frame and the direction of the energy plot in comparison to each other as shown in fig 1.82.
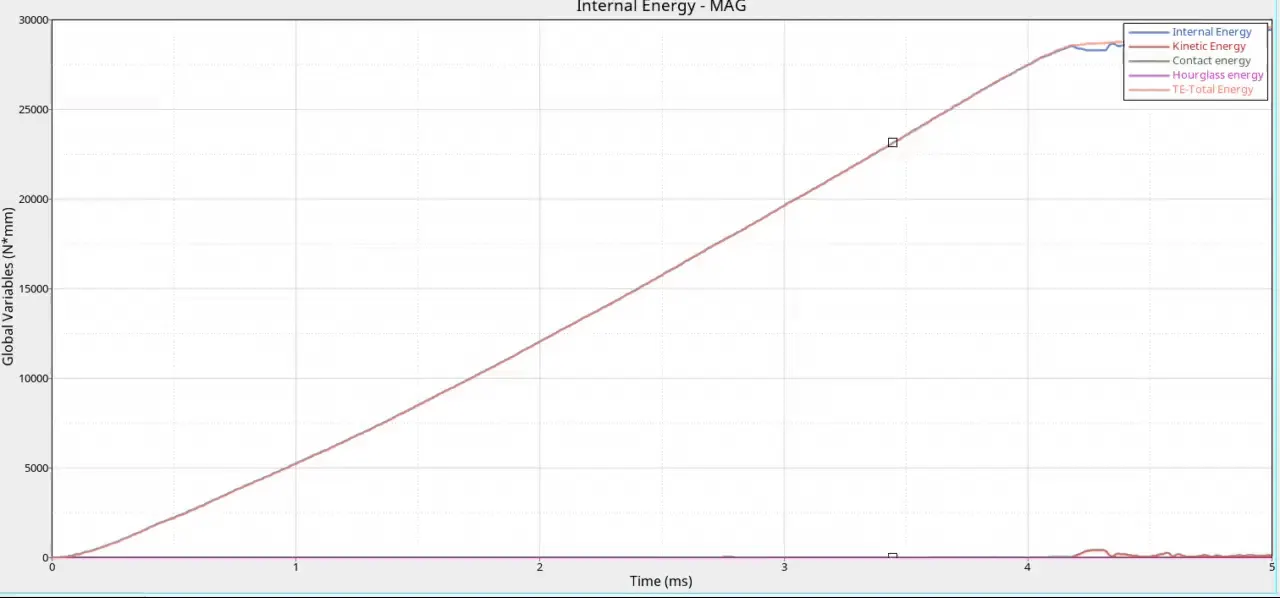
fig 1.82
*For the Rigid forces, there is no contact between the plate and rigid wall. So the curve is in origin. When the rigid ball hits on the rupture plate, the curve starts increasing and suddenly the curve starts decreasing, Once, there will be no contact after the elements get deleted which is shown in1.83.
fig 1.83
*The internal energy starts from origin due to there being no contact between the rigid ball and rupture plate. So the internal energy goes on increasing, proportionally the deformation or displacement is happening, when the displacement increases the internal energy increases as shown in fig1.84.
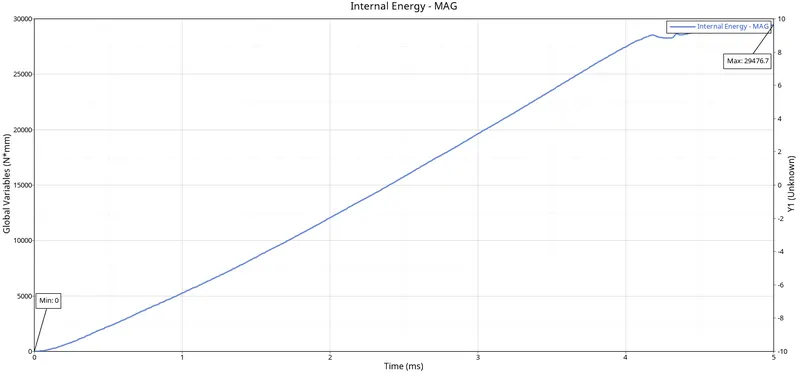
fig 1.84
*The Kinetic energy starts at a small value and gradually peaks up and the Cause of the Noise and Vibrations will be produced when the rigid ball hits the rupture plate, so the kinetic energy curve is in a waveform as shown in fig 1.85.
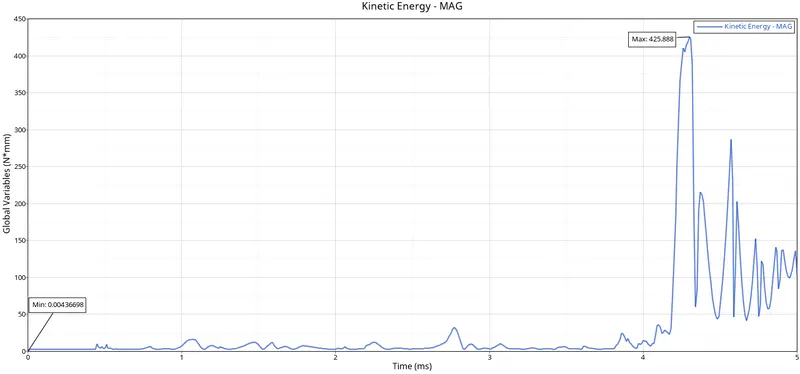
fig 1.85
*Due to elements are deleting when both the objects come in contact with each other. If deformable bodies get in contact, then only the contact energy increases. Since the rigid ball is a rigid body and the rupture plate is a deformable body, So the contact energy is constant as shown in fig1.86.
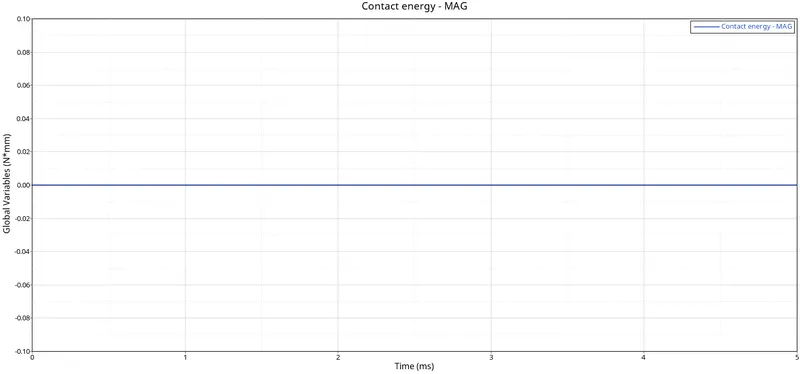
fig 1.86
*For this case the Hourglass energy is zero because of the usage of the property parameters Ishell =24, Ismstr=2, Ish3n=2, N=5, and Iplas=1. The graph has been plotted for Hourglass energy and time as parameters as shown in fig 1.87.
fig 1.87
*Since Total energy is the summation of all the energies so at the start there will only be Kinetic energy so the total energy will be equal until the deformation starts Total energy averages all energies with respect to time. The graph has been plotted for Total energy and time as parameters as shown in fig 1.88.
fig 1.88
*The graphs have been plotted by using hypergraph 2D for rigid wall forces, internal energy, hourglass energy, contact energy, and total energy and are verified siminatusly as shown in fig 1.89.
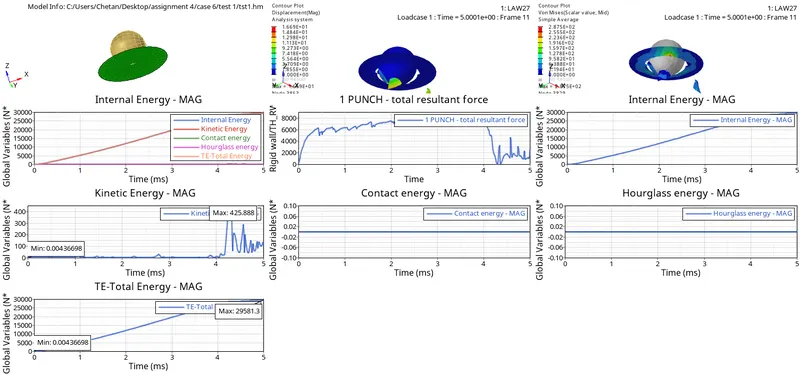
fig 1.89
CASE 7
*For law 36 the material is based on tabulated results of the stress and strain so the curve is created as shown in fig 1.91.
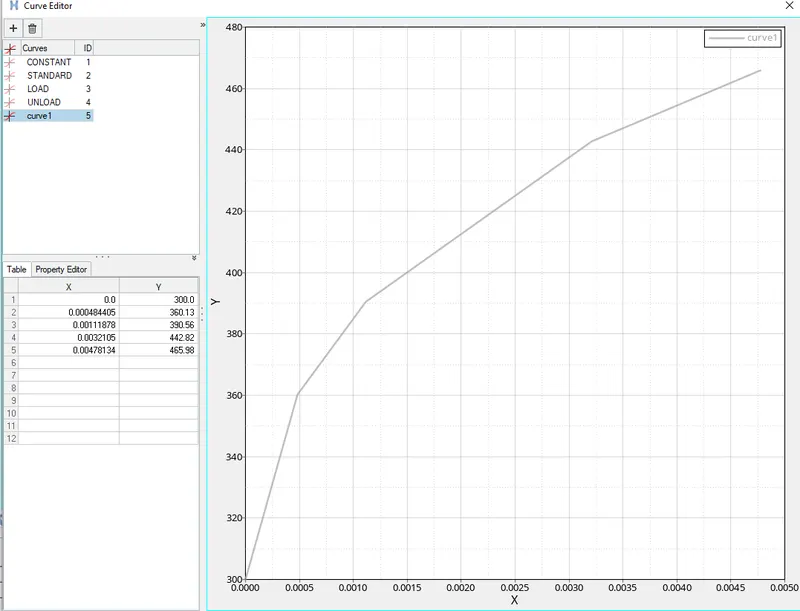
fig 1.91
For case 7 change the material card to LAW 36 as shown in fig 1.92.
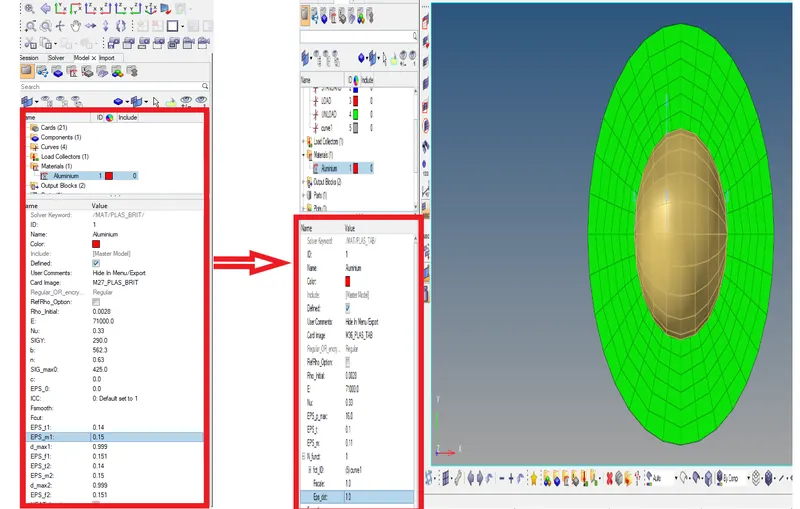
fig 1.93
*The model is been analyzed and the no of cycles and elelapsedime is displayed as shown in fig1.93.
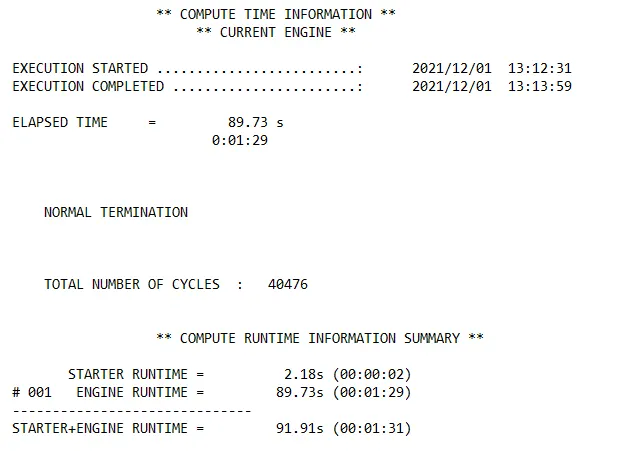
fig 1.93
*Engine Output File [00001. out] has been generated after analysis. The Engine Output File [00001. out] contains the data of the analyzed errors as shown in fig 1.94.
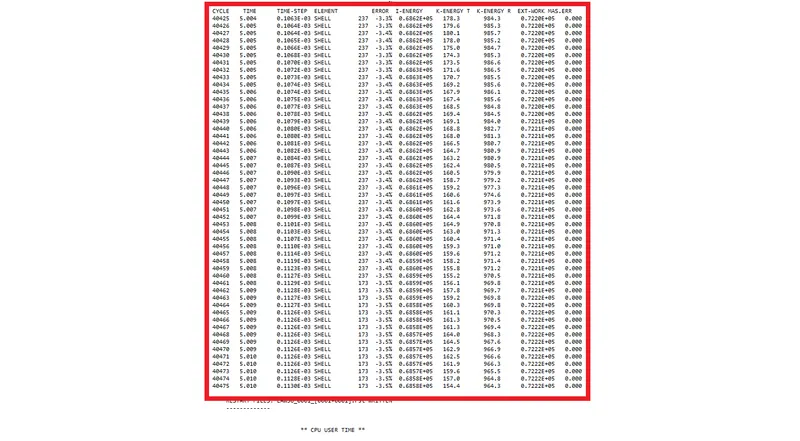
fig 1.94
*The simulations are run on hyper view for displacement and Von Mises and have been animated as shown in fig 1.95.
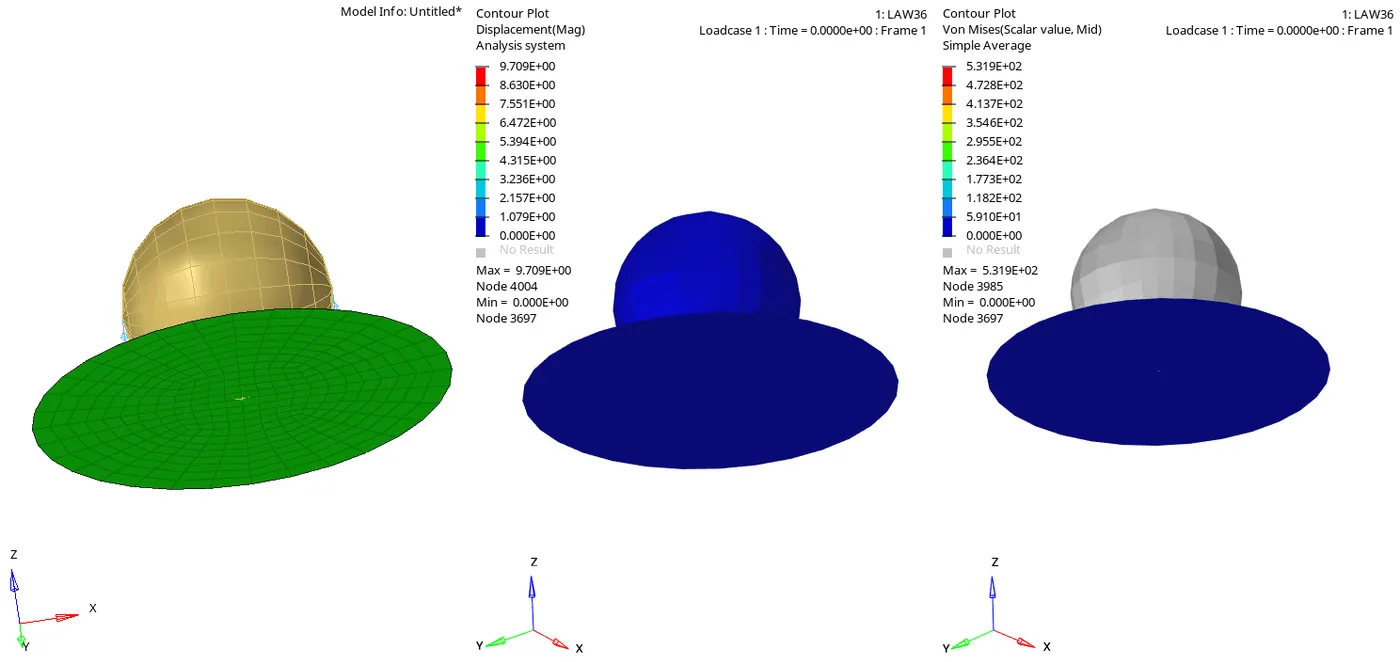
fig 1.95
*Hypergraph 2D mode is turned on and graphs have been plotted for Internal energy, Kinetic energy, Hourglass energy, Contact energy, and total energy graphs concerning global variables for Case as shown in fig 1.96.
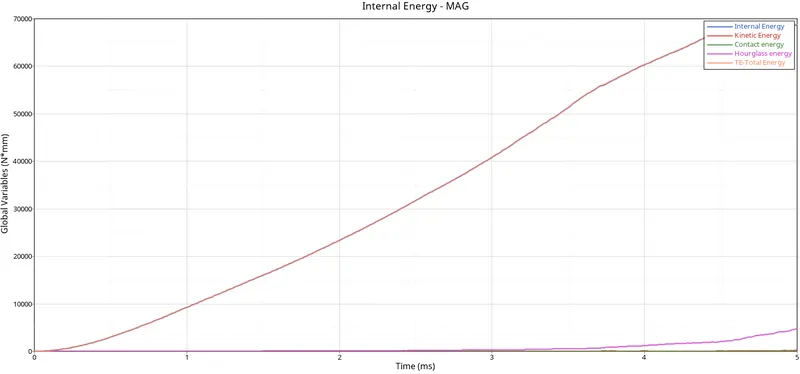
fig 1.96
*For the Rigid forces, there is no contact between the plate and rigid wall. So the curve is in origin. When the rigid ball hits on the rupture plate, the curve starts increasing and suddenly the curve starts decreasing, Once, there will be no contact after the elements get deleted which is shown in1.98.
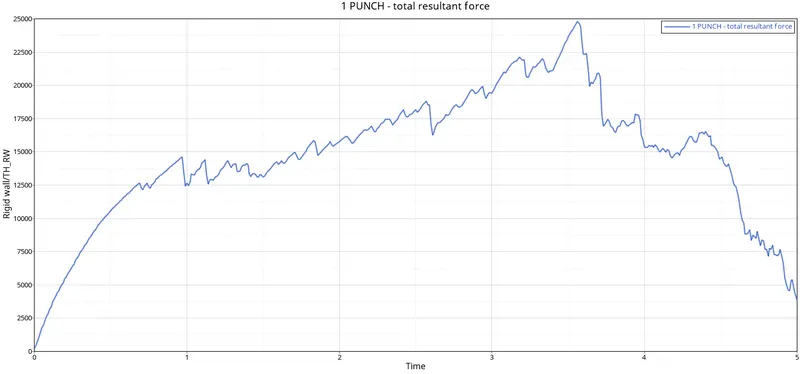
fig 1.98
*The internal energy starts from origin due to there being no contact between the rigid ball and rupture plate. So the internal energy goes on increasing, proportionally the deformation or displacement is happening, when the displacement increases the internal energy increases as shown in fig1.99.
fig 1.99
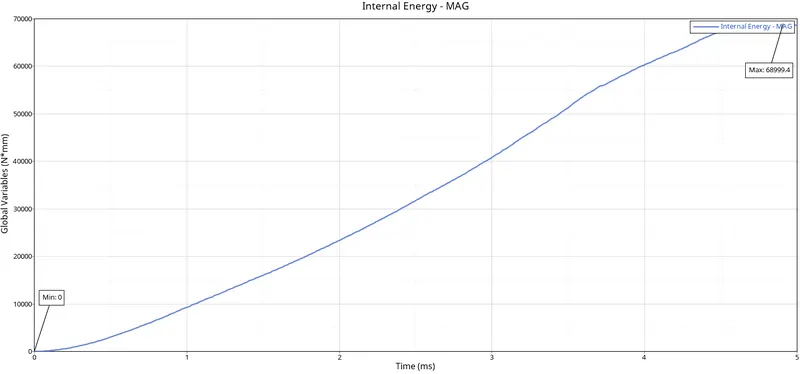
*The Kinetic energy starts at a small value and gradually peaks up and the Cause of the Noise and Vibrations will be produced when the rigid ball hits the rupture plate, so the kinetic energy curve is in a waveform as shown in fig 1.100.
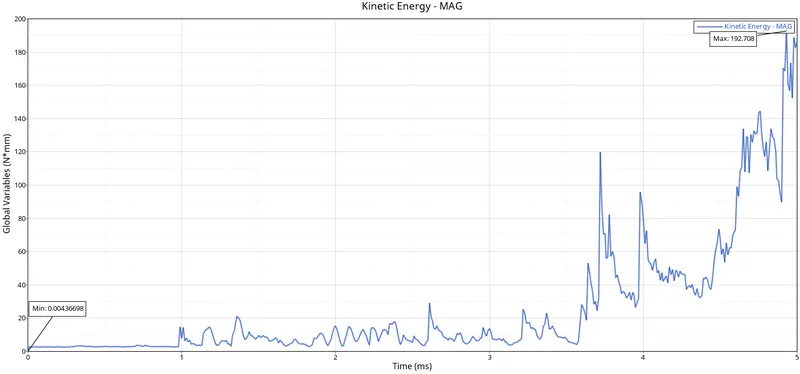
fig 1.100
*Due to elements are deleting when both the objects come in contact with each other. If deformable bodies get in contact, then only the contact energy increases. Since the rigid ball is a rigid body and the rupture plate is a deformable body, So the contact energy is constant as shown in fig1.101.
fig 1.101
*For this case the Hourglass energy is zero because of the usage of the property parameters Ishell =24, Ismstr=2, Ish3n=2, N=5, and Iplas=1. The graph has been plotted for Hourglass energy and time as parameters as shown in fig 1.102.
fig 1.102
*Since Total energy is the summation of all the energies so at the start there will only be Internal energy so the total energy will be equal until the deformation starts Total energy averages all energies with respect to time. The graph has been plotted for Total energy and time as parameters as shown in fig 1.103.
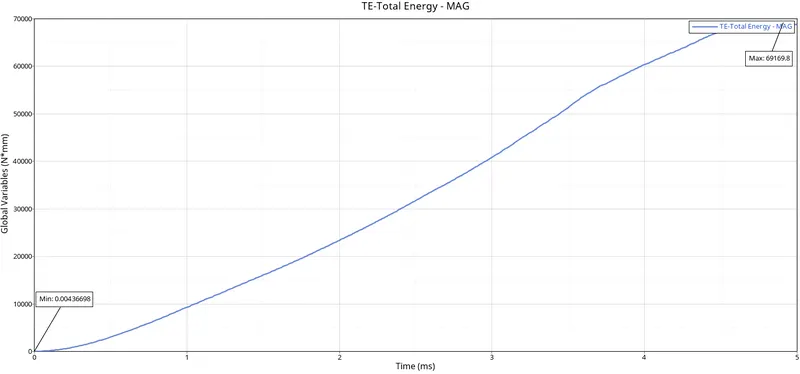
fig 1.103
*The graphs have been plotted by using hypergraph 2D for rigid wall forces, internal energy, hourglass energy, contact energy, and total energy and are verified siminatusly as shown in fig 1.104.
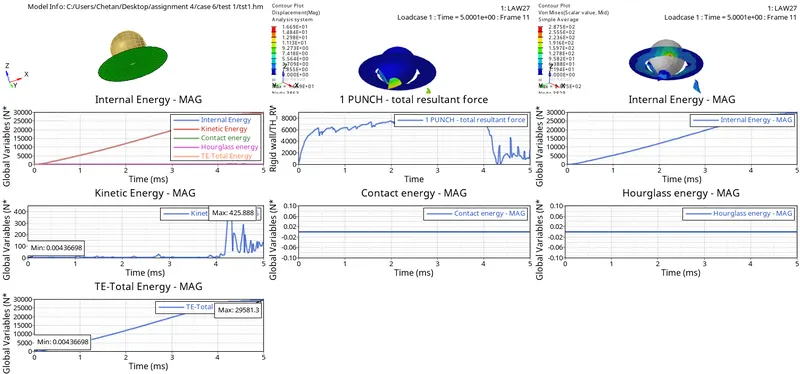
fig1.104
OVERALL COMPARISON:-
|
Changes in Material Parameters |
Energy Error |
Internal Energy |
Kinetic Energy |
External Work |
Material Used |
Element Failure Behaviour |
|
|
Case-1 |
Used Default Shell Parameters and ran the Simulation. |
0.8% |
0.2730E+05 |
67.81 |
0.2721E+05 |
Johnson-Cook [LAW2] |
After contact,Elements Deleted. |
|
Case-2 |
Changed the Values for Ifail_sh, Dadv,Ixfem in the Failure Card. |
4.1% |
0.3082E+05 |
141.9
|
0.2980E+05 |
Johnson-Cook [LAW2] |
After contact, Elements will be Cracked and Deleted. |
|
Case-3 |
Deleted the Failure Card from the Model Browser. |
0.8% |
0.2744E+05 |
87.08 |
0.2736E+05 |
Johnson-Cook [LAW2] |
After contact,ElementsDeleted. |
|
Case-4 |
Changed the Value for Maximum Plastic Strain [Eps_Max=0]. |
1.1% |
0.3879E+05 |
3.931 |
0.3838E+05 |
Johnson-Cook [LAW2] |
After contact,Elements Deformed, Cracked but not Deleted. |
|
Case-5 |
Changed the Material Card to LAW1 and Kept the Same Material Properties. |
7.4% |
0.7195E+06 |
425.7 |
0.7780E+06 |
Elastic [LAW1] |
After contact,Elements Deformed, but not Deleted. |
|
Case-6 |
Assigned the Rupture Parameters for the Plate and Used Recommended Element Parameters. |
0.8% |
0.2954E+05 |
65 |
0.2940E+05 |
Elasto-Plastic-Brittle [LAW27] |
After contact,Elements Deleted. |
|
Case-7 |
Created a PlasticStress-Strain Curve by Using Plastic Strains and Yield Stress Values. |
0.7% |
0.7078E+05 |
21.31 |
0.7046E+05 |
Elasto-Plastic-Tabulated [LAW36]. |
After contact, Elements Deleted. |
ALL ERRORS ARE IN THE PERMISSIBLE RANGE.
RESULT:-The simulation were run for the mentioned cases and the graphs, animations are taken . All the cases were compared using atabularcolumn