Week 6 - Data analysis
AIM: To write a python program which reads the engine output parameter data file and perform the required objectives
Objective: The objective of this project is to write a python program which reads the engine data file and perform the required objective.
- To read the data file from a given engine data file.
- To take the file name as an input from user and check whether the file is present or not.
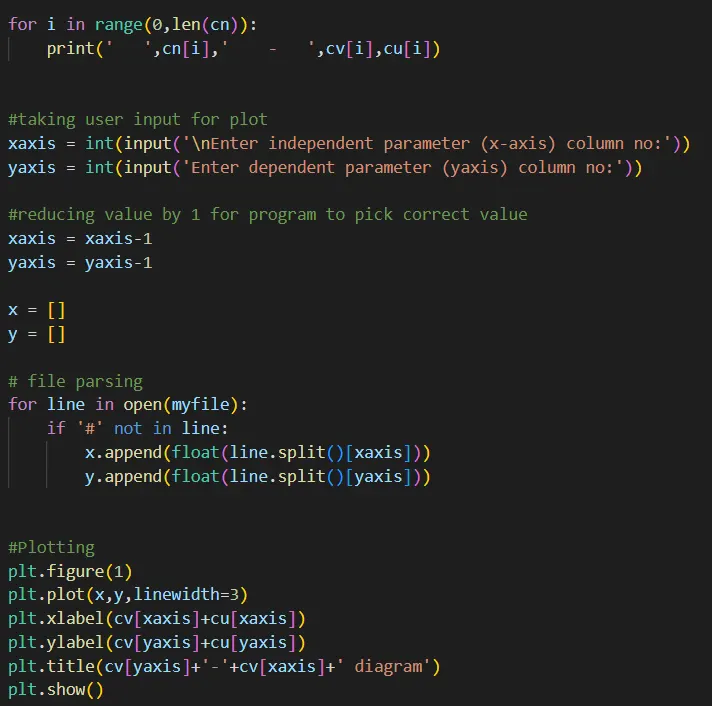
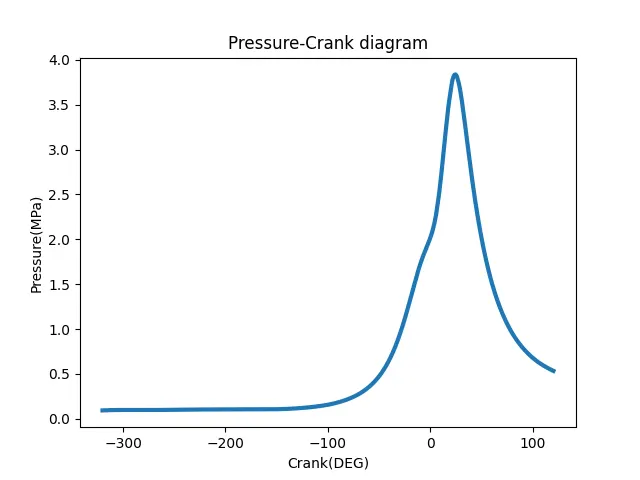
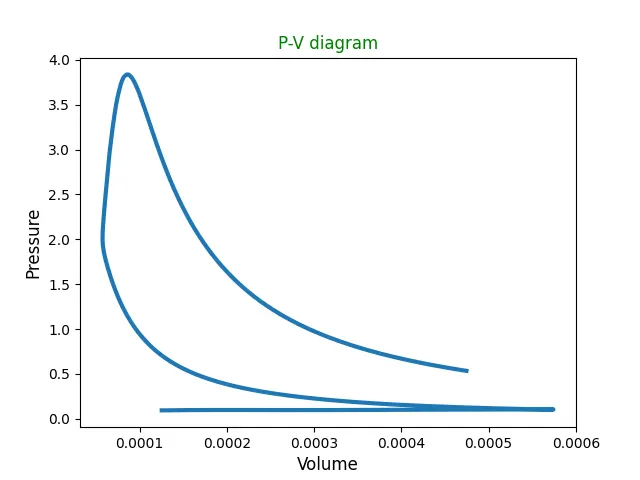
- To plot a graph between any two parameter given by user as an input.
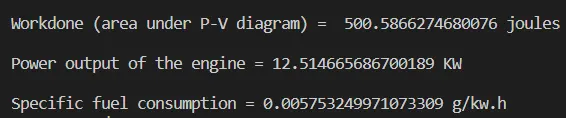
- To do basic performance calculation by calculating area under the P-V diagram, power output of the engine (1500 rpm) and specific fuel consumption where engine consumed 20 micro grams of fuel (per 1 stroke cycle).
Introduction:
Data analysis is a process of inspecting, cleansing, transforming, and modeling data with goal of discovering useful information, informing conclusion, and supporting decision-making. Data analysis has multiple facets and approaches, encompassing diverse techniques under a variety of names, and is used in different business, science and social science domains. In today's business world, data analysis plays a role in making decisions more scientific and helping business operates more effectively.
- Descriptive Analysis: Descriptive data analysis looks at past data and tells what happened. This is often used when tracking Key Performance Indicators (KPIs), revenue, sales leads, and more.
- Diagnostic Analysis: Diagnostic data analysis aims to determine why something happened. Once your descriptive analysis shows that something negative or positive happened, diagnostic analysis can be done to figure out the reason. A business may see that leads increased in the month of October and use diagnostic analysis to determine which marketing efforts contributed the most.
- Predictive Analysis: Predictive data analysis predicts what is likely to happen in the future. In this type of research, trends are derived from past data which are then used to form predictions about the future. For example, to predict next year’s revenue, data from previous years will be analyzed. If revenue has gone up 20% every year for many years, we would predict that revenue next year will be 20% higher than this year. This is a simple example, but predictive analytics can be applied to much more complicated issues such as risk assessment, sales forecasting, or qualifying leads.
- Prescriptive Analysis: Prescriptive data analysis combines the information found from the previous 3 types of data analysis and forms a plan of action for the organization to face the issue or decision. This is where data-driven choices are made.
These 4 types of data analysis can be applied to any issue with data related to it. And with the internet, data can be found about pretty much everything.
Data analysis has been used here to open and read the contents of the data and perform some basic calculations using certain formulas.
Governing Equations used:
Since the data file consists of various parameters for an engine, the file contents can be used to perform certain basic engine calculations.
The quantities calculated here are:
- Work done by the engine (Area under the curve).
- The power output of the engine. This is generally called engine brake power.
Using the 'trapezoidal' rule and 'Simpsons' rule, the area under the curve can be computed. For calculating the power and the specific fuel consumption, the following equations are used:
`power = (Wout * r* n)/(60*1000*2)` in `kW`
Where, `n =`No. of cylinders of the engine.
`r =` rpm is converted to rps (revolution per second)
`Wout =` workdone by the engine (4-stroke so it means devided by 2)
`SFC = (Fuel Cons) / (power)` in `(kg)/(hrs)`
Where, `SFC =` Specific fuel consumption
`Fuel Cons =`Amount of fuel consumption
`power =` power
Engine consumed 20 micro grams of fuel (per 1 stroke cycle) nad RPM = 1500.
Procedure and Explaination:
Step-1: Before writing the program first we have to import command to import libraries which will be used in mathematical operation and plotting.
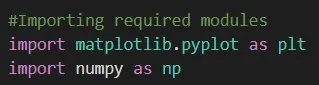
Function of the libraries is:
- matplotlib library for plotting graphs
- numpy library to use np as command which returns evenly spaced samples
Step-2: Compatibility check of the file.
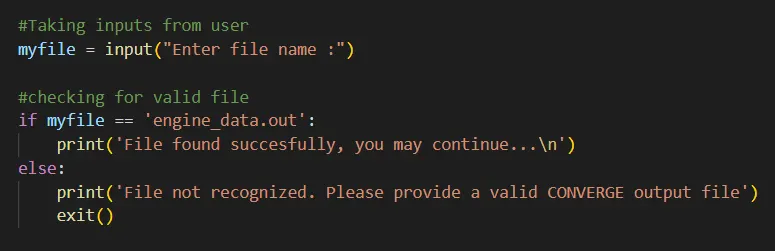
Here we create myfile function where we give input file name and using if else we check given file is present or not in given directory. f(t)=y=at+b">
Step-3: Data availability
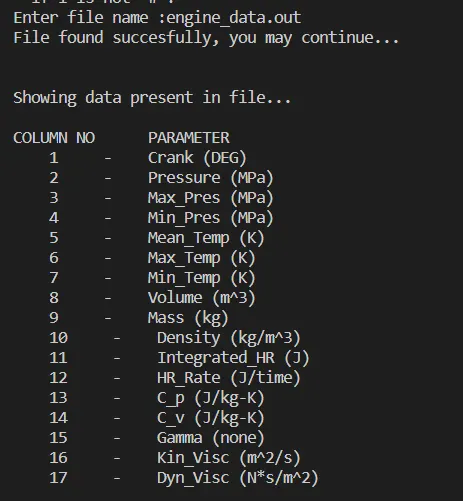
Now the next part of the program is to asks the user which file we would like to open. It opens the file and prints out the data available to us.
Use return to read all the line step by step and store values in empty array accordingly.
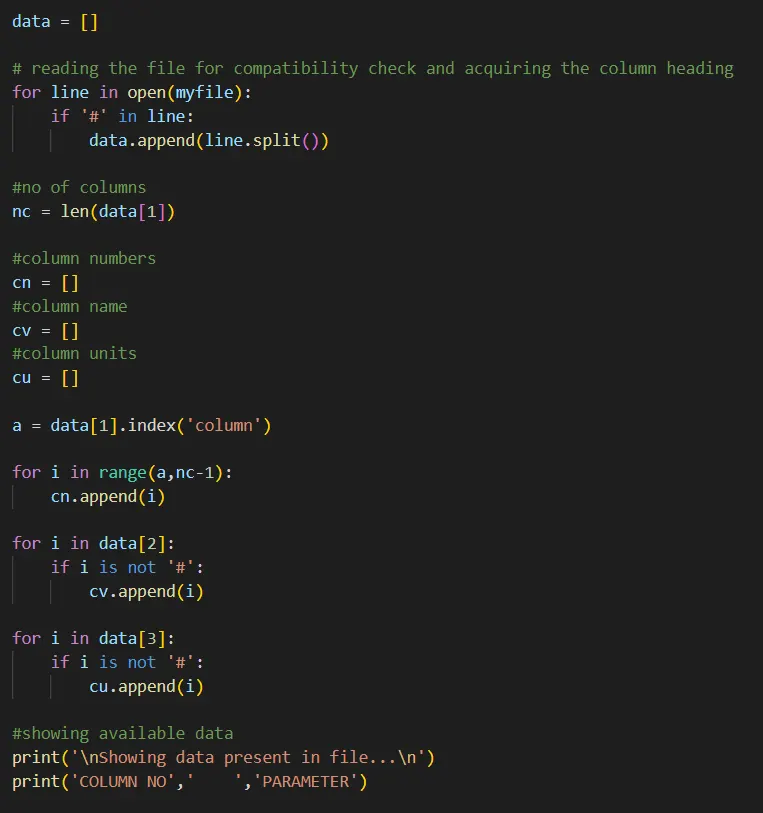
Step-4: Asking column number and plotitng graph accordingly
From this point on, the user is asked to input the column numbers for which we would like to display the data. After that, the selected columns are separated into lists and the graph is plotted.
Step-5: Basic performance calculation
The final part of this assignment will be to calculate area under P-V diagram, Power and specific fuel consumption.
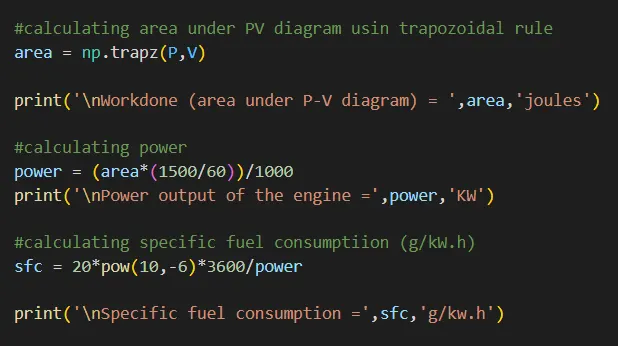
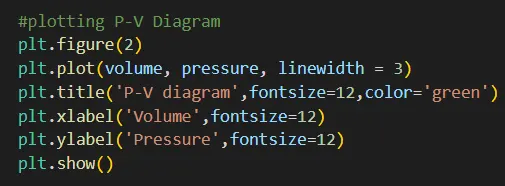
After defining all the terms we need the output so to do that we are using the plot command and plot the graph. Plotting pressure vs volume graph
After properly arranging the program we get out the desired program.
Python Program for Engine data analysis
CODE:


CONCLUSION:
- The data from the output file was read successfully and the plot required as per the user need was made.
- The performance calculations were done and displayed successfully.