Project 2 Thermal modeling of battery pack
Objective :
- Create a 10 cell series lithium ion battery pack.
- And simulate the thermal effects and compare cycle life performance at various temperatures, charge & discharge rate.
Theory :
A lithium-ion (Li-ion) battery is an advanced battery technology that uses lithium ions as a key component of its electrochemistry. During a discharge cycle, lithium atoms in the anode are ionized and separated from their electrons. The lithium ions move from the anode and pass through the electrolyte until they reach the cathode, where they recombine with their electrons and electrically neutralize. The lithium ions are small enough to be able to move through a micro-permeable separator between the anode and cathode. In part because of lithium’s small size (third only to hydrogen and helium), Li-ion batteries are capable of having a very high voltage and charge storage per unit mass and unit volume.
A battery consists of multiple connected lithium-ion cells. Battery packs for large consumer electronics like laptop computers also contain temperature sensors, voltage regulator circuits, voltage taps, and charge-state monitors. These components minimize safety risks like overheating and short circuiting. To power larger devices, such as electric cars, connecting many small batteries in a parallel circuit is more effective and more efficient than connecting a single large battery.
And when 10 cell connected in series so their voltage becomes 10 times but current remains constant. If we want to more efficient battery pack so we need to keep more battery in series becouse of less amount of heat loss occur. And if heat loss is less so we get more power and their life span also increases.
Model :
This model created by using simscape and simulink blocks which consist a 10 cell series lithium ion battery pack. And it give output as the thermal effect on battery, SOC (state of charge) and voltage as well.
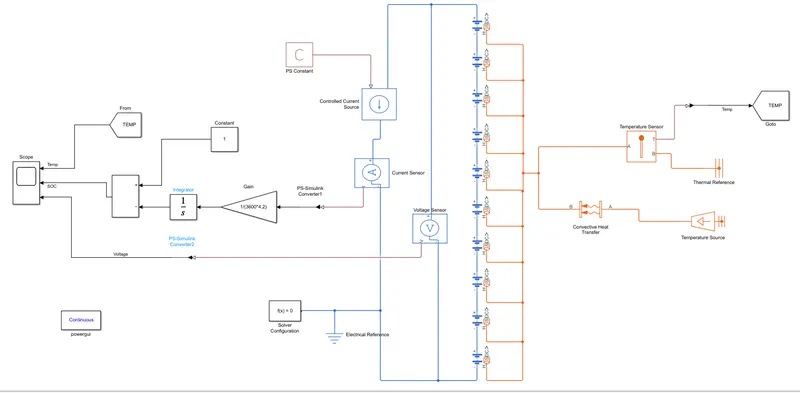
Blocks used in this model :
- Battery (table based)
- PS constant
- controlled current source
- current sensor
- voltage sensor
- convective heat transfer
- Temperature source
- Temperature sensor
- Thermal reference
- Goto & From
- PS simulink converter
- gain
- integrator
- Add
- constant
- Solver configuration
- Eletrical referance
- powergui
- Scope
Explaination :
- First shorted out all the required simscpe/simulink blocks.
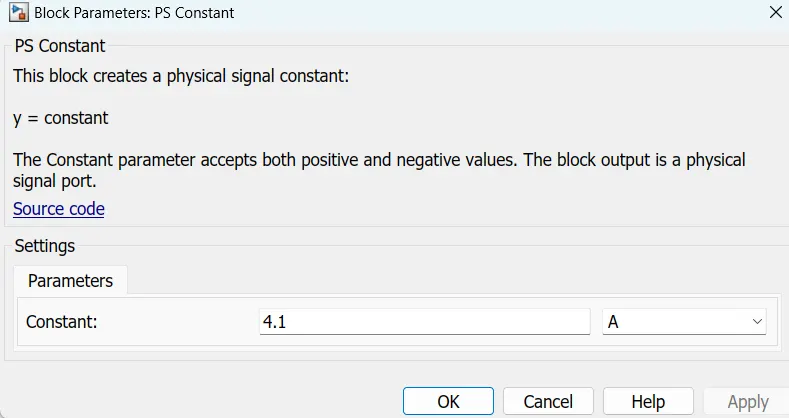
- Constant block: To define the rate of discharge of the battery in Amperes (4.1 A).
- Controlled Current Source block: To moniter and control the flow of current from the battery.
- Table-based battery block: Instrumented + Show Thermal port.
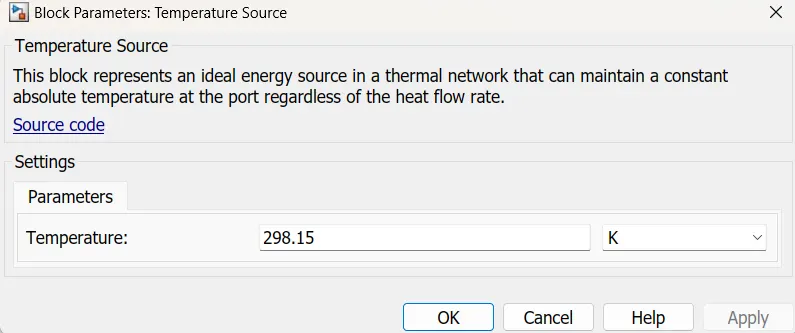
- Temperature Source block: To define the temperature (293.15 K) input to the system under study.
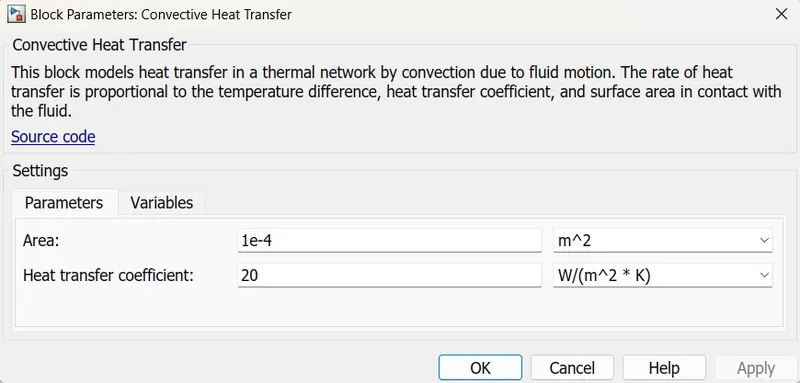
- Convective Heat Transfer block: To define the Area (1e-4 m^2) and the Heat transfer coefficient (20 w/[m^2*K]) of the system under study.
- Temperature Sensor block: To sense and measure the temperature of the system.
- Goto Tag block: To define the value of a parameter of a system under study and assign it to the 'From Tag'.
- From Tag block: To define the value of a parameter of a system under study received from the 'Goto Tag'.
- Voltage sensor : It measure the voltage of a battery which is connected in parallel.
- Current sensor : it measure the current of a battery which is connected in series.
- for SOC estimation : This estimation is done by using coulamb counting method where we use gain, constant, integrator and add blocks.
- Configuration Solver block: To support the simulation of the system under study.
- PS-Simulink Converter block: To convert the Physical system into simulink signal.
- Electrical Reference block: Electrical reference for the electrical blocks of the system under study.
- Scope block: To display the results of the system under study.
Parameter taken in in blocks :
Battery :
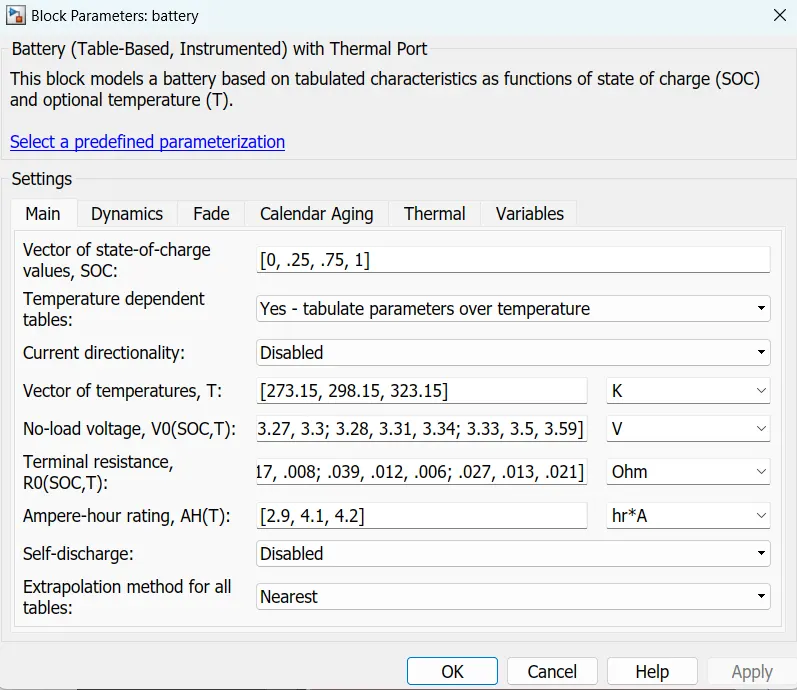
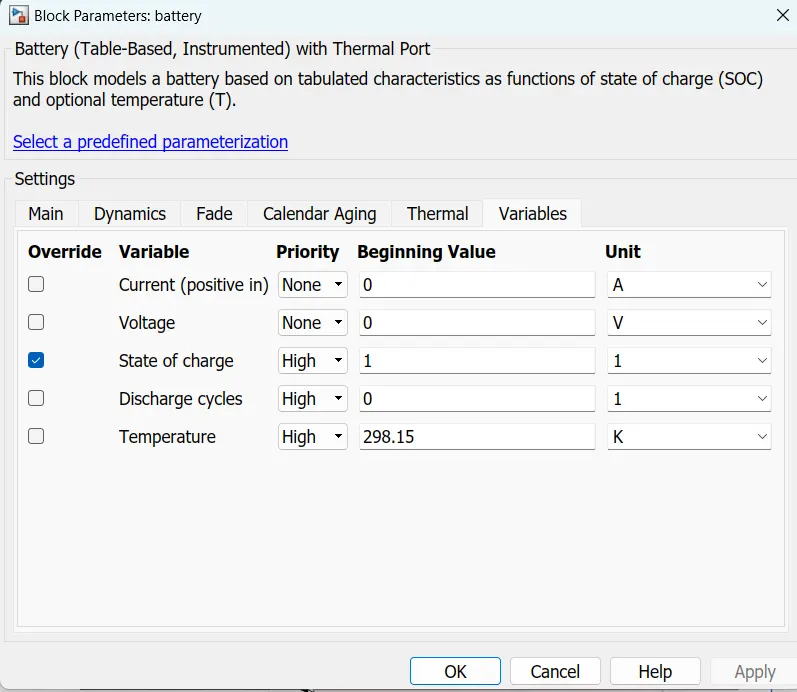
Source taken as constant in PS constant block :
SOC estimation : Here we estimate the SOC using coulamb counting method which have initial SOC ( life of begining) minus integration of current with respest to time and inverselly proportional to the capacity (Ah).
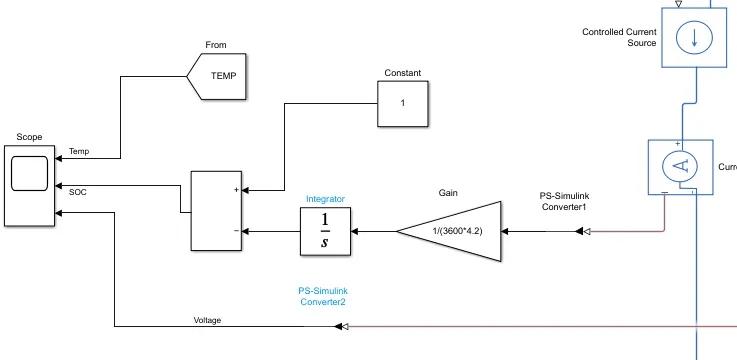
For temperature measurement : first we took temp. source and this source passing through convective heat transfer and connected to the thermal port and temp. measurement sensor to gives out thermal effect on the battery model.
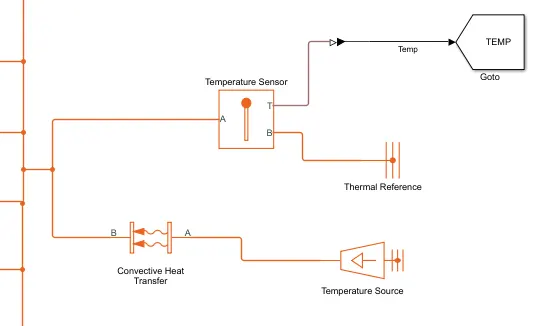
parameter taken for this temperature measurement, we took a very small area (1e-4) but to see thermal effect so we have to regulate and see through scope what happen when we increase the area.
Voltage measurement : we take voltage sensor block and connect parallel with battery model.
RESULT :
This graph show the SOC of battery pack , rise in temperature and their voltage.
Case I : temp. at 298.15 K and surface area is 1e-4 m^2.
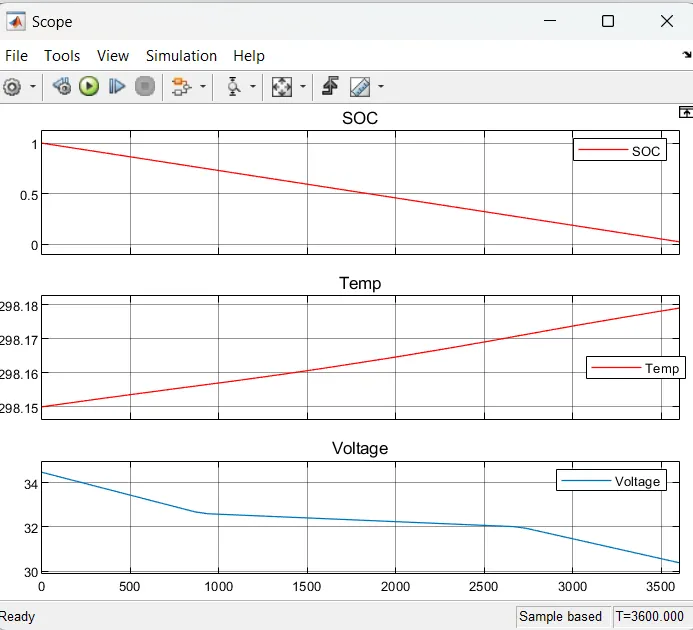
When the SOC level of the battery system reaches 100% to 0% at approx 1 C-rate so we clearly see within an hour there are some temperature rises to 298.18 K from 298.15 K in a battery. And voltage of the battery reaches 34.5V to 30.5V as the time increases it means battery is in discharging condition.
Case II : Temp at 250 K and surface area increases to 10 m^2 from 1e-4 m^2.
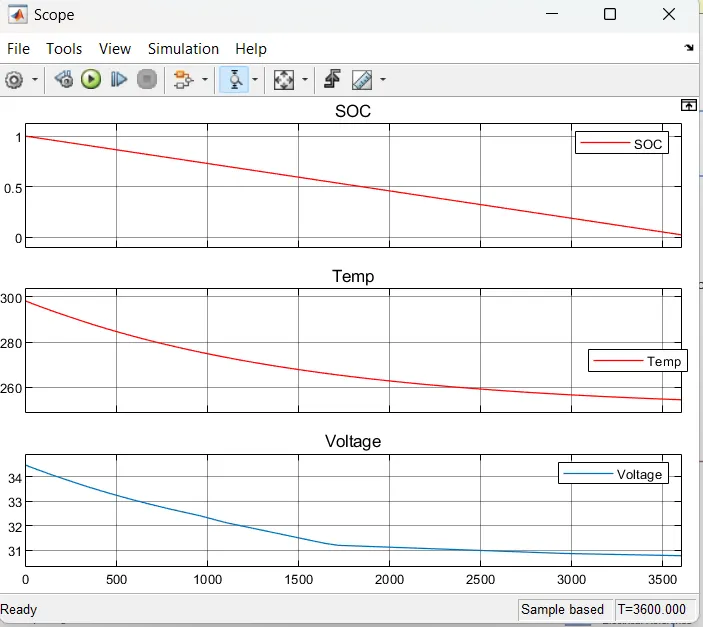
The SOC of the system reaches to 0% within an hour and when we set temp. at 250 K so the temperature fall to 250 K from 298.15 K with an exponential decreament becouse of surface area increase to 10 m^2 from 1e-4 m^2. Temperature also depends on C-rate when the C-rate regulates at 0.5C,0.25C so there are some temperature rises in the cell and due to regulation of C-rate simulation time also change.
Case III : Temp at 310 K and surface area increases to 10 m^2 from 1e-4 m^2.
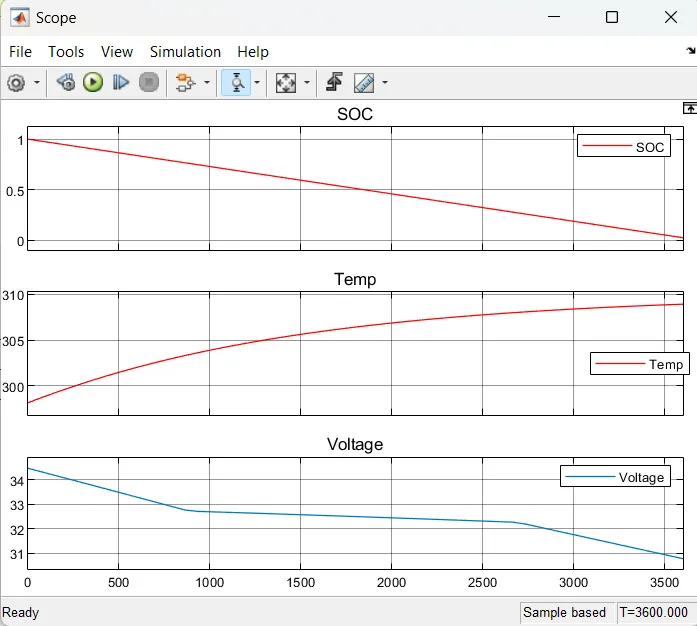
The SOC of the battery system reaches to 0% from 100% within an hour and when we setthe temp. at 310 K so the temperature rise to 310 K from 298.15 K with an exponential increament becouse of surface area increase to 10 m^2 from 1e-4 m^2.
we can see case (I,II,and III), when we set temp. at different Kelvin so temperature ries and fall accordingly but the graph goes exponentially just becouse of increament in surface area. When the surface area of the battery increases so there are some gap between the cell and cell are contact with the convective heat flow rate so this flow of heat cool down the whole battery pack.
Now we have to see what change in life span so to want to check life span we have to create a different model
Model for life span :
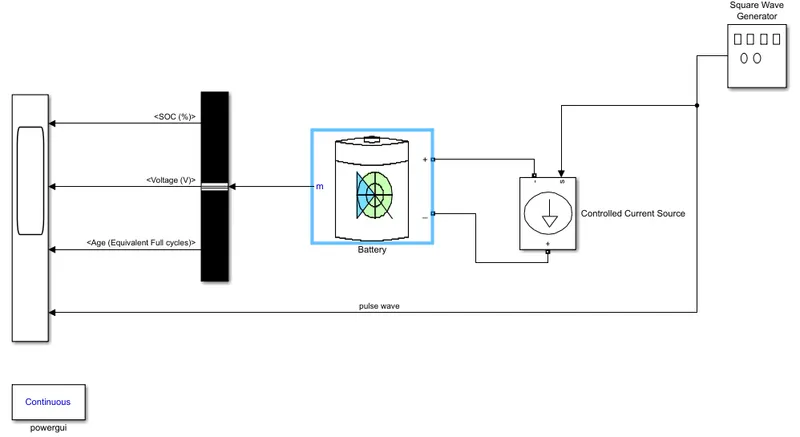
Block used in model :
- Square wave generator
- Controlled current source
- Generic battery
- Bus selector
- powergui
- Scope
Explaination :
- Square wave generator block : It give the output as wave form to see charging and discharging effect.
- Controlled current source block : To moniter and control the flow of current from the battery.
- Generic battery block : It gives the aging effect of battery.
- Scope block: To display the results of the system under study.
Parameter taken as input for this model
Generic Battery :
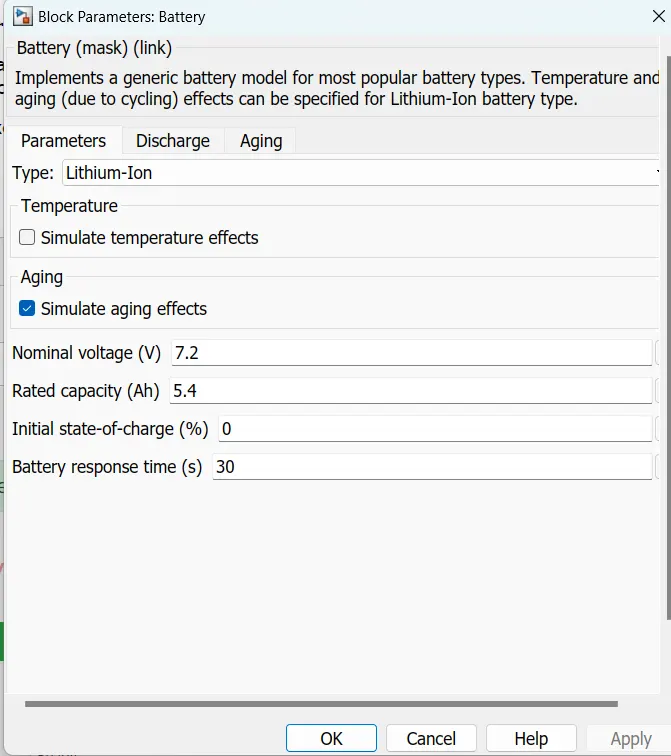
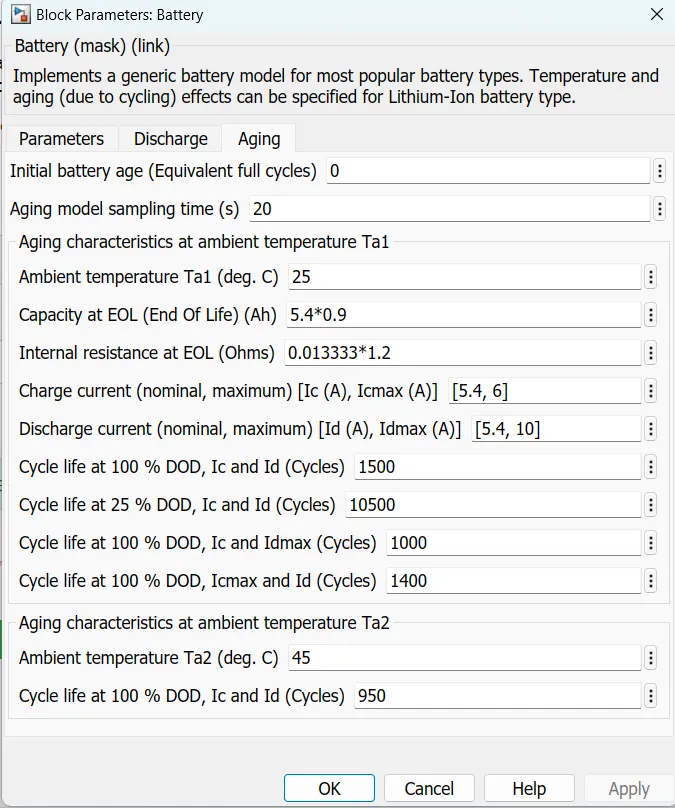
Square wave generator block :
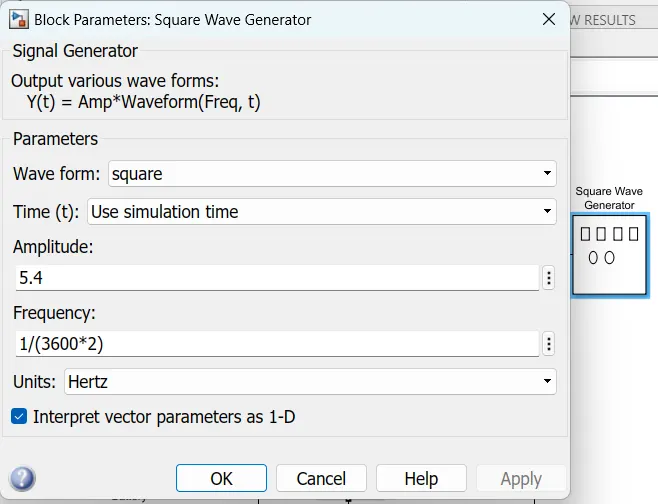
Simulation time : 3600*10 (we give 3600 second as input time for life cycle (see in f = 1/T) So in an hour, charging and discharging completely done. It simulate 10 Hours to see 5 life cycle.
Result :
This plot shows the SOC, Voltage, battery pack Age and Pulse that we give as input source.
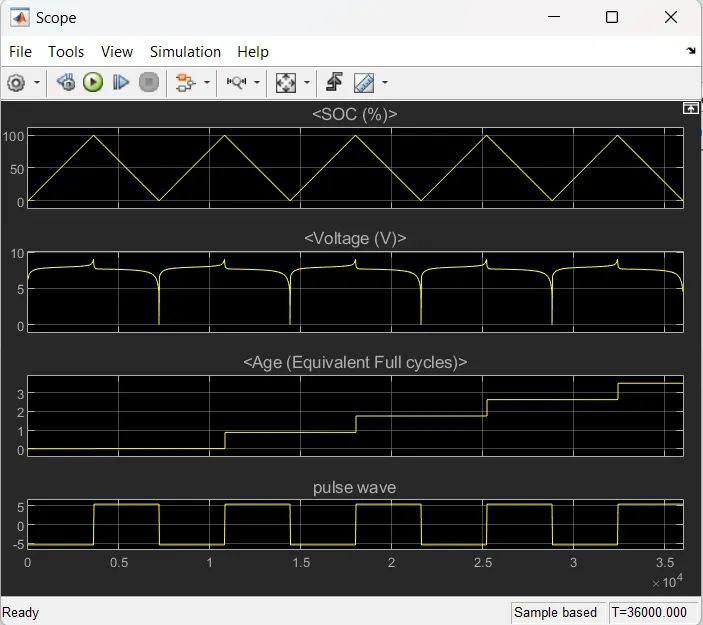
Here we see in Aging and pusle wave plot, at the end of one cycle life span of battery is also equal.One life cycle means a battery charge and discharge fully. voltage plot shows underlimit it means it not cross the limit of battery voltage.
Conclusion :
The thermal effects of battery pack at different ambient temperatures for cycling charging/discharging has been analysed and plotted. The life cycle performance also evaluated for individual cells and overall battery pack.