Project 2 - 3D CFD modelling of Air cooling system and liquid cooling system for battery thermal management
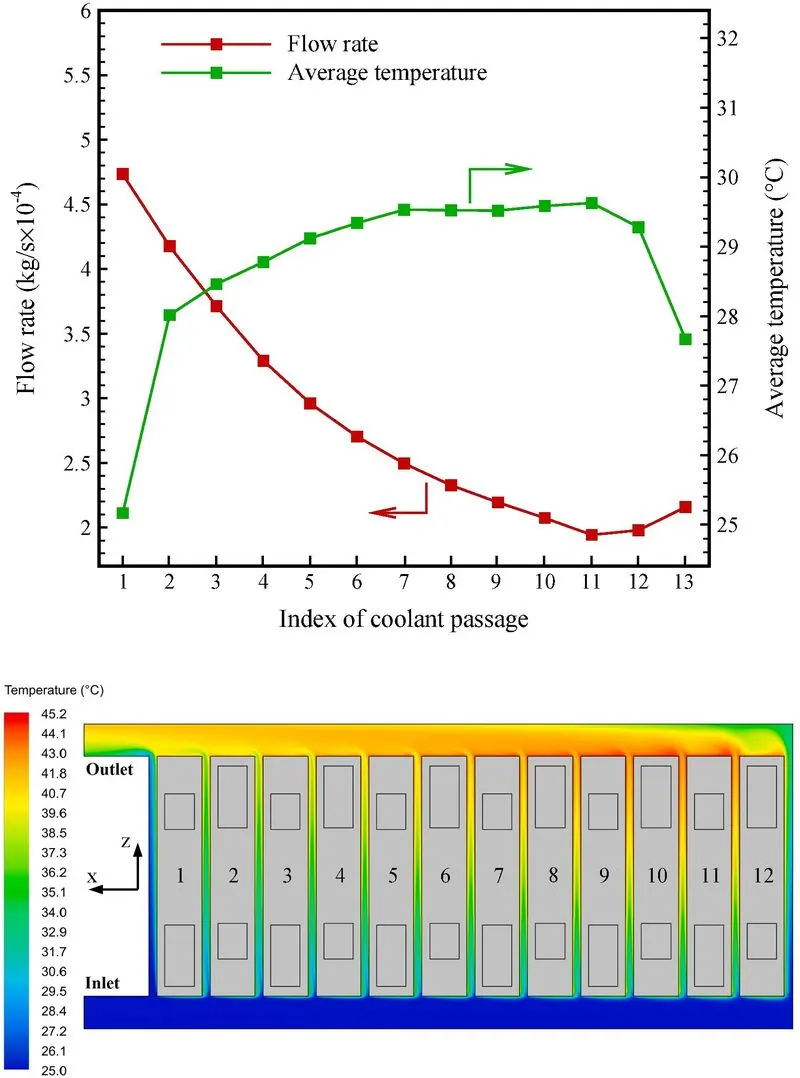
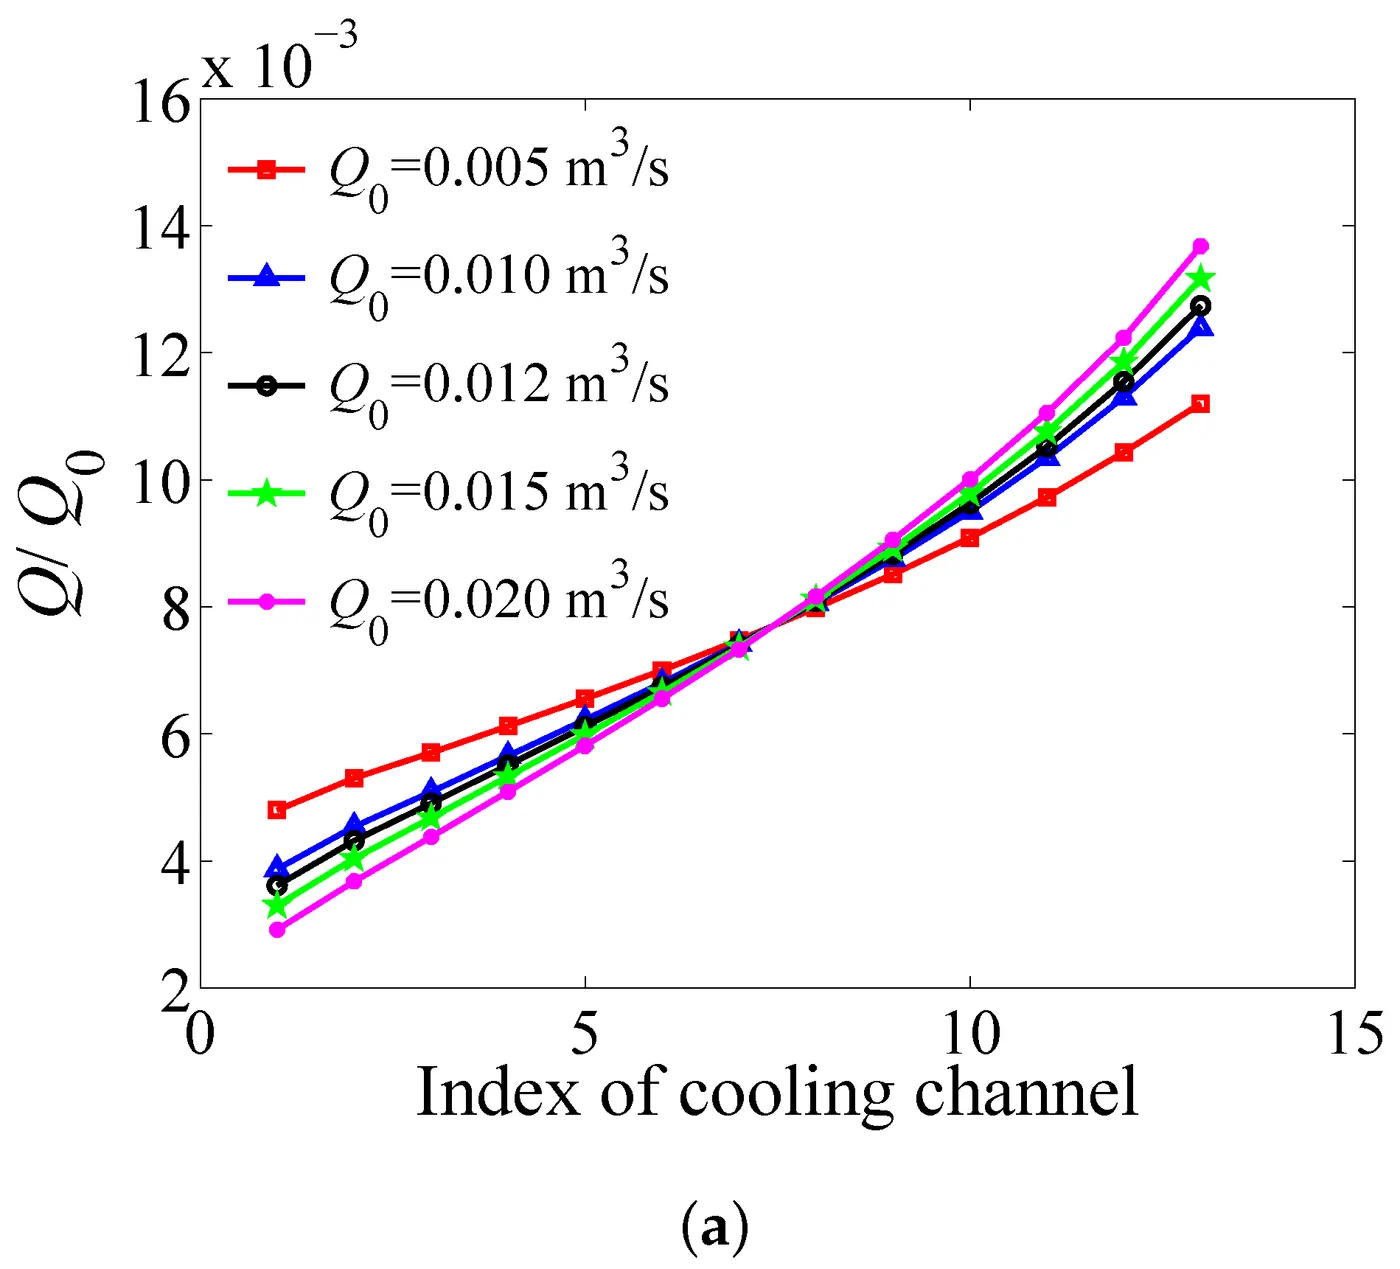
The thermal behaviour of the air-cooled module is strongly dependent on the airflow characteristics in the cooling channels between the cells. In this regard, the flow rate, and the average temperature of the air at the inlet of the cooling channels between the cells. Moreover, the temperature distribution of the air within the cooling system is depicted. These results are related to the end of the discharge process, and the flow rate and temperature of the air at the inlet of the cooling system are 3 L/s and 25 °C. The horizontal axis displays the index of cooling channels. There are 13 cooling channels between the cells, and the cooling channels are numbered the same as battery cells, from the front side of the module (where the inlet and outlet are located) toward the rear side. It is seen that the flow rate inside the cooling channels continually decreases as the channel index number increases from 1 to 11, and after that, it slightly increases. The average temperature of the air at the inlet of the cooling channels rises from channel 1 to channel 7. After that, a small variation in air temperature is observed from channel 7 to channel 11, and then it reduces. The air temperature increases as it passes through the cooling channels. Hence, the air temperature in the outlet manifold is much higher than the inlet manifold. These hydrodynamic and thermal characteristics of the air flow confirm the local and average temperature distribution of the cells within the module. Since the heat transfer from the cells to the air is proportional to the temperature and the flow rate of the air inside the cooling channels, the reduction of air flow and increment of air temperature in the cooling channels from the front side toward the rear side, causes the hottest area of the module to be revealed near the rear side. As the flow rate in the cooling channels 11 and 12 are the minimum ones, that is why cell 11 has the highest average temperature in the module. Moreover, the higher temperature of the air in the outlet manifold results in lower heat dissipation from the left side of the module, and consequently, the hottest area of the module is concentrated on the left side.
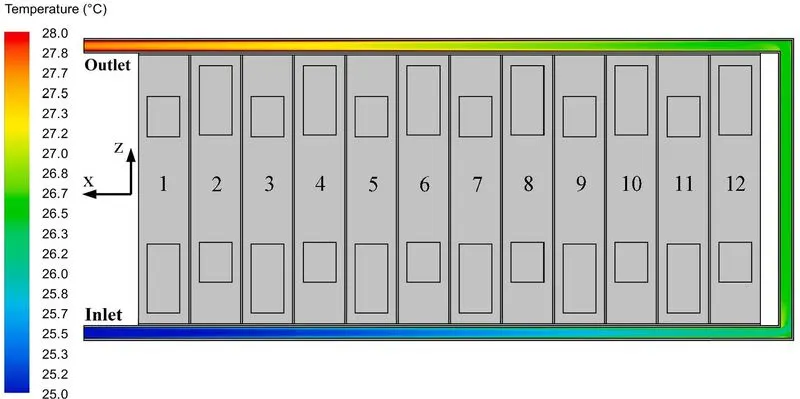
Liquid Cooled Module:-
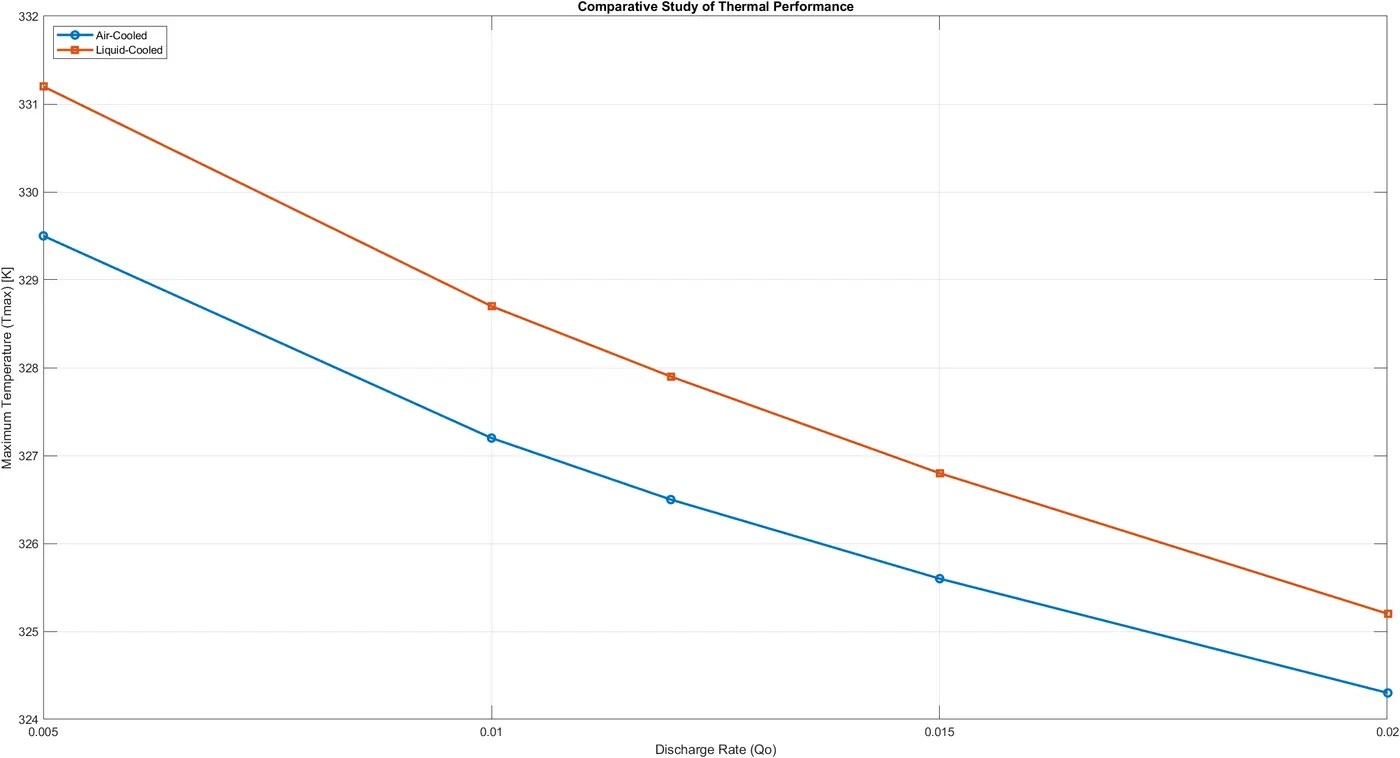
The temperature distribution over the module surface with the liquid cooling system at the end of the discharge process is revealed. The inlet temperature and flow rate of the water are 25 °C and 0.5 L/min. The legend of the contour is the same as one used for the air cooling BTMS. It is observed that both sides of the module with the liquid cooling system are significantly colder than the other areas, and the hottest area is concentrated in the middle of the module. It is worth mentioning that the temperature distribution on each battery cell in the liquid-cooled module is almost the same. Comparing, it is clear that the liquid cooling system leads to a lower temperature of the module than air cooling due to the larger cooling capacity of water.
It depicts the average temperature distribution of the cells within the liquid-cooled module with at different flow rates and the inlet temperature of 25 °C. To remind the readers, the cells are numbered from the front side of the module toward the rear side. It is seen in this figure that for all flow rates, the maximum and minimum average temperatures correspond to cells 6 and 12, respectively. Moreover, a slight variation is observed in the average temperature between the cells.
2.Module consists of 5 prismatic cells enclosed in an aluminum enclosure
3.Worst case scenario- cell soaked at 45⁰C ambient with heat generation corresponding to 0.5 C discharge
4.Inlet temperature of 20 ⁰C for both air and liquid.
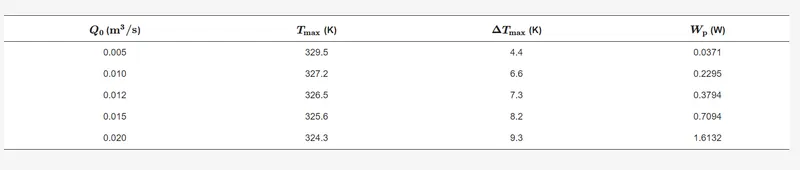
For parallel air-cooled BTMS, the values of Tmax and ΔTmax strongly depend on the operation parameters and the structural parameters of the system. Operation parameters include discharge rate, inlet air temperature (T0) and inlet airflow rate (Q0). The structure parameters include the cell spacing (d0) and the angles of divergence planum and convergence planum (θ1 and θ2). In the following material, the effects of these parameters on the cooling performance of BTMS are explored using the CFD method. Finally, an optimization strategy is presented to obtain optimal parameters.
Effect of discharge rate:-
The heat generation rate of a battery cell depends on the discharge rate. This section considers different discharge rates as 3-current (3C), 4-current (4C), 5-current (5C) and 6-current (6C) and CFD calculations respectively. It can be observed that both Tmax and ΔTmax increase the discharge rate. In BTMS, the air temperature difference is not large, so the air properties can be considered independent of temperature. It means that the calculation of temperature is separated from the calculation of velocity. Therefore, changes in discharge rate do not affect the flow field in BTMS. When the discharge rate increases, the discharge current increases and the heat generation rate increases, which will increase the temperature and temperature difference of the battery pack.
Therefore, reducing the discharge rate can help to reduce
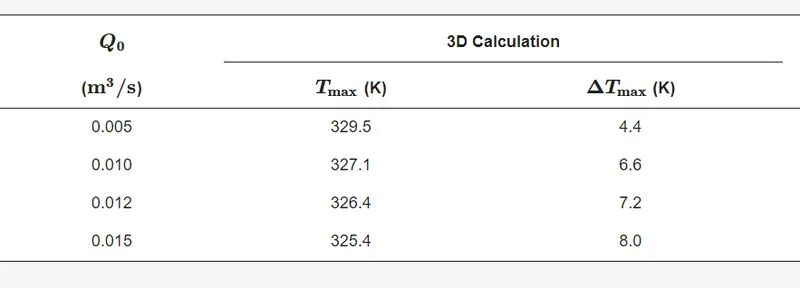
It can be observed that the maximum temperature rise (
meanwhile, the velocities inside the cooling channels boom as d0 decreases, so that you can growth the convective warmth switch coefficient at the surface of the battery cells and reduce the mobile temperatures. in the parallel air-cooled BTMS, the strain drop of the airflow is because of the drag pressure alongside the inlet duct and the outlet duct, the drag pressure along the cooling channels and the local pressure loss due to the swerve of the flow. The reduction of d0 will remarkably increase the drag pressure alongside the cooling channel, making the drag pressure alongside the cooling channel dominate in comparison to different strain losses. therefore, the discrepancy of the airflow prices among the cooling channels is reduced while d0 is decreased. meanwhile, the boom of the drag pressure alongside the cooling channel increases the energy intake to pressure the airflow. T hat as compared to the gadget with d0=3 mm, Tmax and ΔTmax of the system with d0=1 mm are decreased with the aid of 3.eight okay and a couple of.8 okay respectively, however Wp are multiplied with the aid of greater than 10-times. consequently, it isn't always an powerful manner to enhance the cooling performance of the BTMS thru lowering the cell spacing.
Executive Summary
- Provide a concise overview of the entire project.
- Summarize the objectives, methodology, key findings, and conclusions.
- Highlight the significance of the study and its potential implications for battery module thermal management.
2. Introduction
- Introduce the importance of efficient thermal management for battery modules in various applications.
- Clearly state the research problem and the specific goals of the study.
- Explain the relevance of comparing air-cooled and liquid-cooled solutions.
- Briefly outline the structure of the report.
3. Literature Review
- Provide an in-depth review of the existing literature related to battery module thermal management.
- Discuss various cooling techniques, including air-cooled and liquid-cooled systems.
- Highlight previous comparative studies and their findings.
- Identify gaps in the literature that your study aims to address.
4. Methodology
- Describe the research design, including the experimental approach and computational simulations.
- Detail the battery module and enclosure design, including dimensions, materials, and construction.
- Explain the choice of software tools for computational fluid dynamics (CFD) simulations.
- Outline the assumptions made and the reasoning behind them.
5. Model and Simulation
- Provide a comprehensive explanation of the CFD model used for simulations.
- Describe the mesh generation process, boundary conditions, and solver settings.
- Present equations or mathematical models used for heat transfer calculations.
- Include relevant diagrams or schematics illustrating the simulation setup.
6. Results and Analysis
- Present the simulation results for both air-cooled and liquid-cooled battery modules.
- Include temperature distribution plots, heat flux profiles, and other relevant visuals.
- Discuss key observations, such as temperature gradients, hotspot locations, and heat dissipation patterns.
- Analyze the influence of parameters such as discharge rate, inlet temperature, and airflow rate on thermal performance.
7. Optimization Strategy
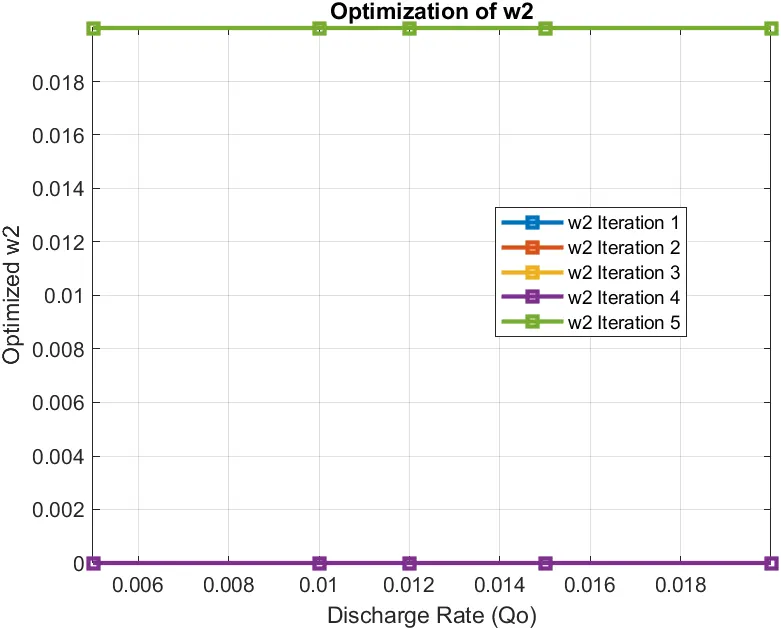
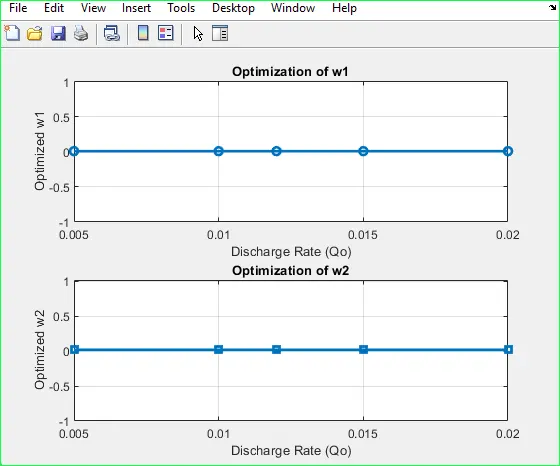
- Detail the optimization approach used for plenum widths (w1 and w2).
- Provide a step-by-step explanation of the iterative optimization process.
- Include tables or graphs showing how optimized parameters change with different discharge rates.
- Discuss the significance of optimization in enhancing thermal performance.
8. Discussion
- Interpret the results and relate them back to the research objectives.
- Discuss the implications of findings on battery module thermal management and safety.
- Compare the thermal performance of air-cooled and liquid-cooled systems based on the simulation data.
- Address the practical feasibility and challenges of implementing optimized plenum widths in real-world applications.
9. Conclusion
- Summarize the main findings of the study.
- Emphasize the contribution of the research to the field of battery module thermal management.
- Restate the significance of comparing air-cooled and liquid-cooled solutions.
- Highlight the potential benefits of optimized plenum widths for enhanced thermal performance.
10. Recommendations
- Provide practical recommendations for engineers and designers working on battery module cooling systems.
- Suggest strategies for implementing optimized plenum widths in various battery module configurations.
- Identify areas for further research and exploration, such as alternative cooling techniques or advanced materials.
11. References
- List all the sources cited throughout the report using a consistent citation style.
12. Appendices
- Include detailed technical specifications, equations, and formulas used in the analysis.
- Provide additional simulation results, graphs, or tables that supplement the main findings.
Ensure that each section provides comprehensive information, analysis, and insights related to the problem and its solution. Use appropriate headings and subheadings to organize the content and make the report easily navigable. Use clear and concise language, avoid jargon where possible, and provide thorough explanations of concepts and methodologies.
Code:
<![endif]-->
<![endif]-->
<![endif]-->
<![endif]-->
<![endif]-->
<![endif]-->
<![endif]-->
<![endif]-->
<![endif]-->
As the discharge rate increases, the temperature rise and temperature difference of the battery pack increases, but the discharge rate cannot be effectively controlled.
- Lowering the inlet air temperature can reduce the absolute temperature of the battery pack, but the temperature rise and temperature difference of the system cannot be effectively reduced.
- As the inlet airflow rate increases, the maximum temperature of the battery pack decreases, but both the temperature difference of the battery pack and the power consumption to maintain the flow rate increase.
- As the cell spacing decreases, both the battery pack temperature and the temperature difference effectively decrease. However, the reduction in cell spacing significantly increases the power consumption of the system.
- Plenum angles significantly influence the performance of BTMS. Without increasing the total volume and power consumption of the BTMS, the maximum temperature of the battery pack and the maximum temperature difference can be effectively reduced by optimizing the angles of the plenums.
<![endif]-->