Week 7 State of charge estimation
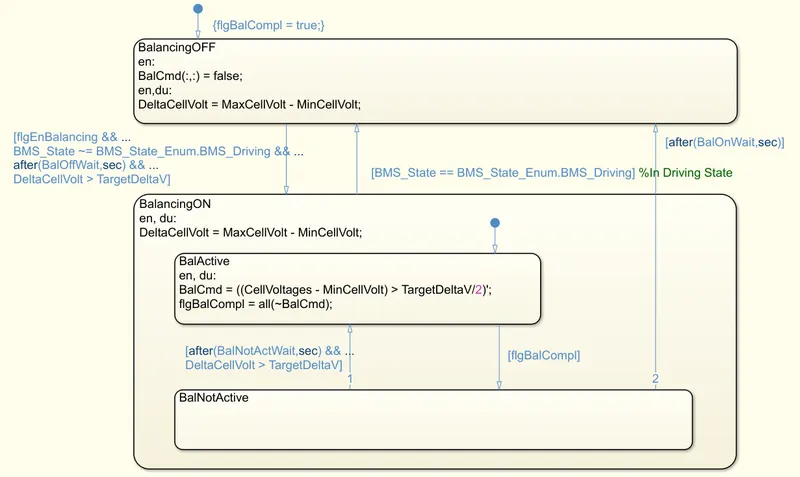
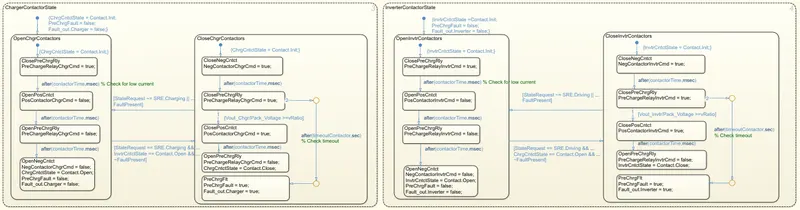
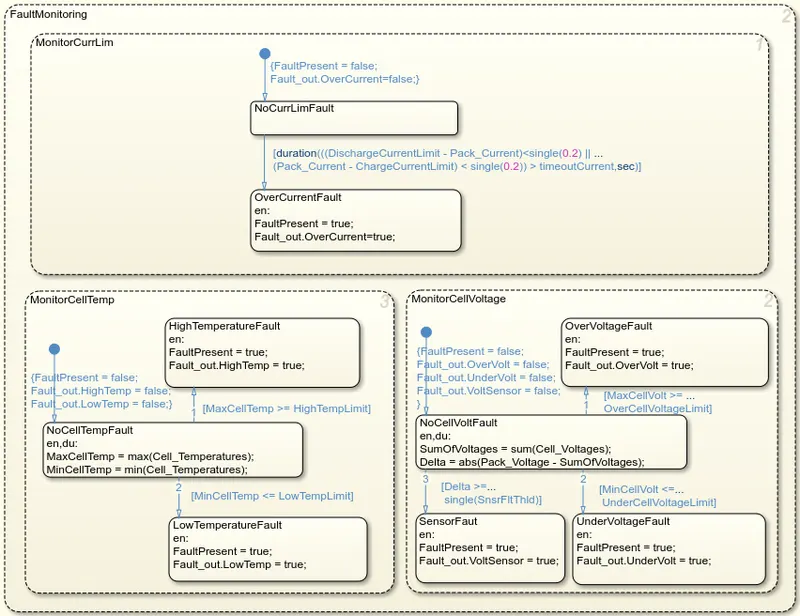
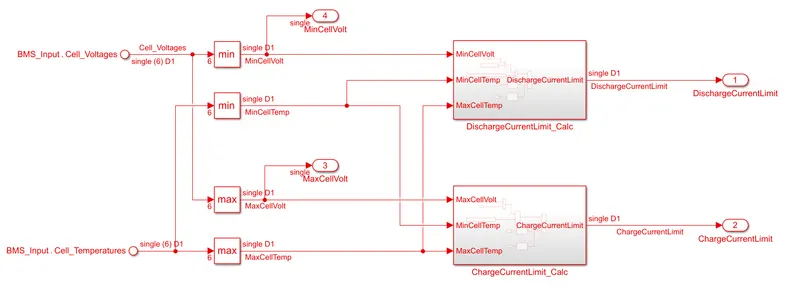
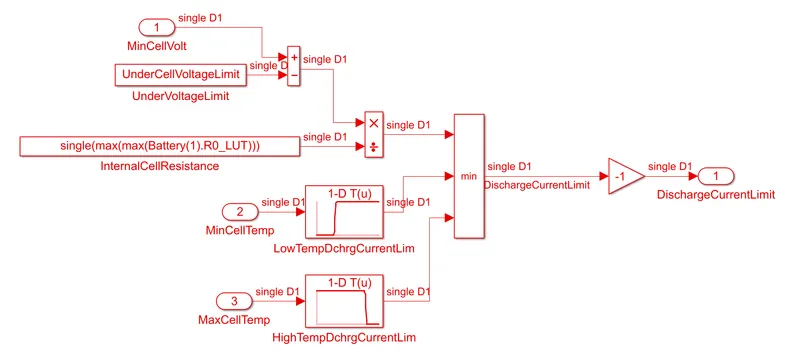
Charge current limit subsystem:
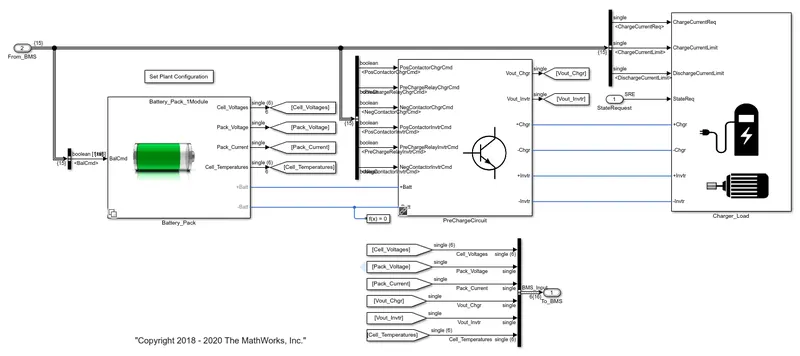
Plant Module:
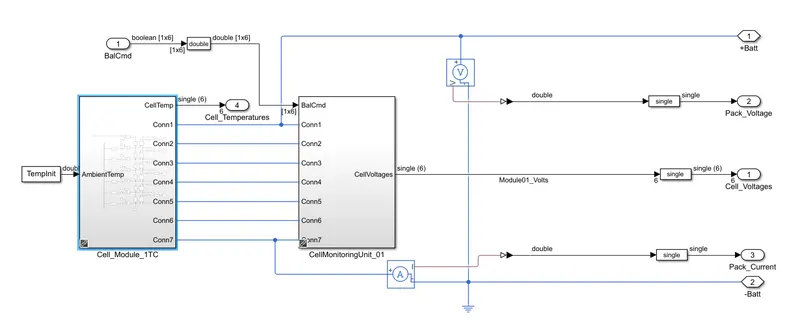
Battery pack Module:
The battery pack consists of modules with 6 cells connected in series with a cell balancing circuit.
A voltmeter is connected in parallel to the battery pack and an ammeter is connected in series to the negative terminal of the battery.
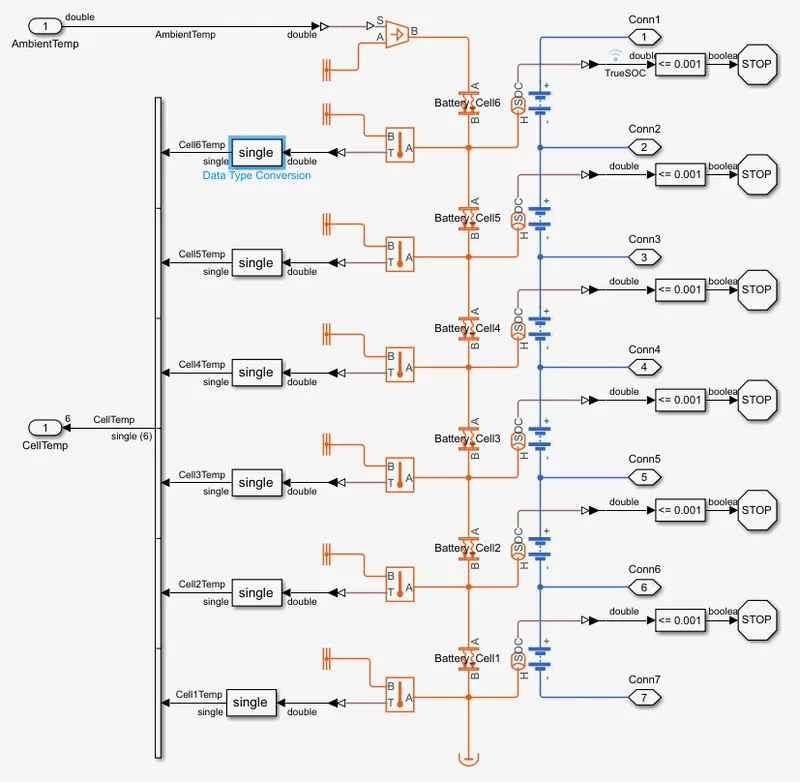
Cell Module:-
- It shows 6 cells connected in series along with the temperature sensor. The simulation is stopped when the SOC of the cell drops below 0.00
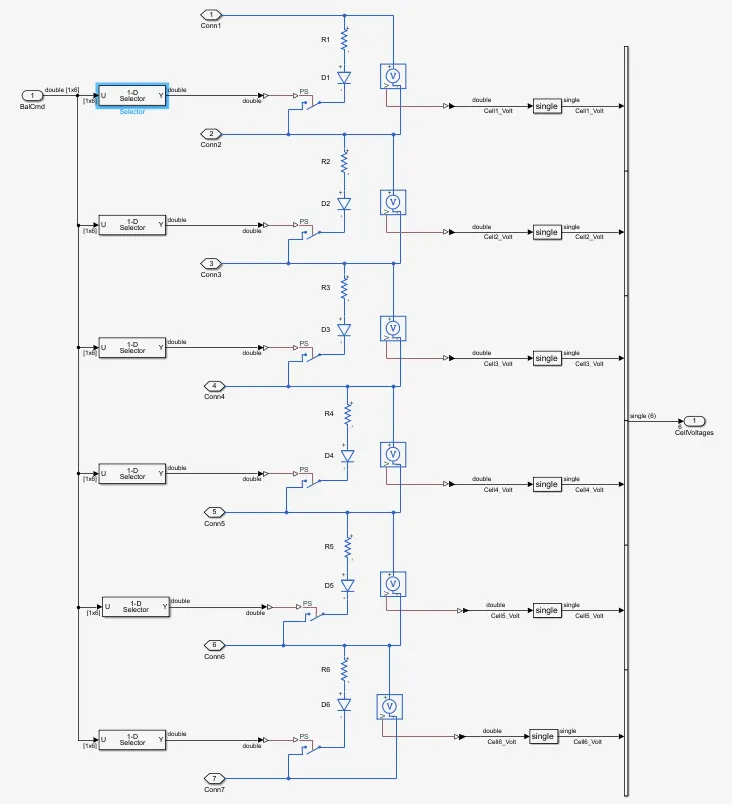
Cell balancing Circuit:
- Here we only passive cell balancing technique as it is comparatively cheaper and less complex than the active cell balancing technique.
- In the cell balancing circuit, we use only a resistor in parallel to dissipate the charge stored in the form of heat. This is controlled using a voltage sensor which checks when to stop balancing to stop over-discharge.
Pre Chrging Circuit:
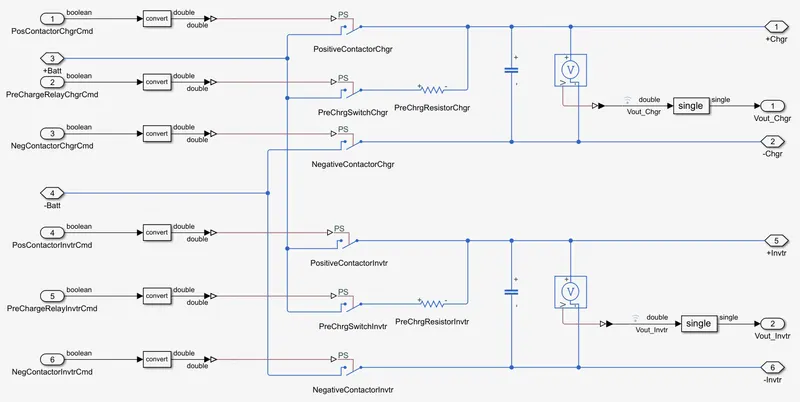
The pre-charge circuit is used to prevent surge current when charging and discharging the battery and to prevent sparking, wiring and components from sudden high current flow.
A resistor is connected in series to limit current flow and a capacitor is connected to prevent voltage ripple. First the negative pole of the battery is connected and then the capacitor is charged through the resistor and finally the positive pole is connected.
3. Charging/Discharging Load:-
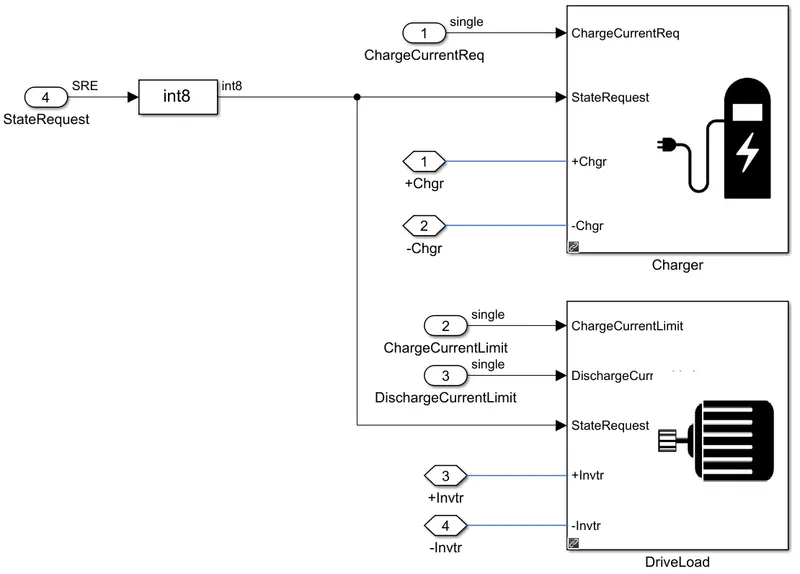
- The charging or the load is applied using based on the user input given is state request given as input in the subsystem.
Discharging:-
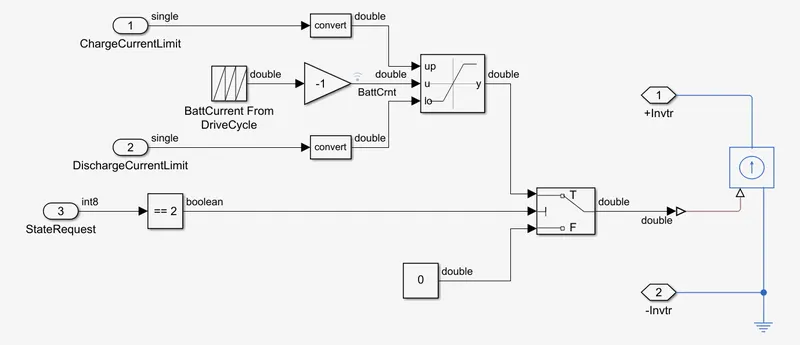
- Here the charge given by the battery is considered as positive and the charge given to the battery is considered as negative.
- The state requirement is checked and the current profile for discharge is made as a repeating sequence from a remapped data in the variable "BattCrnt'. The battery is discharged using a controlled current source.
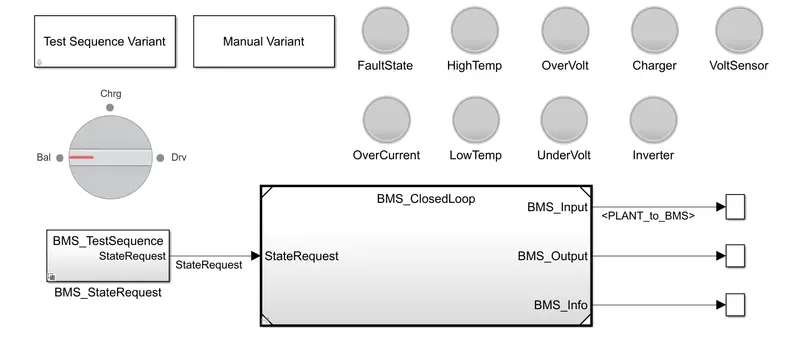
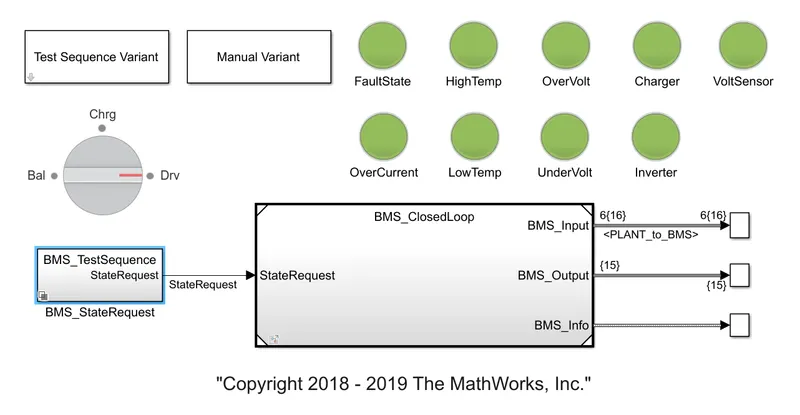
Test Case1:
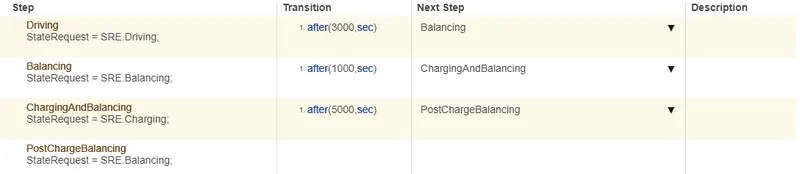
The simulation is run for 20000 seconds in which the first 3000 seconds is the discharge or the driving mode then the next 1000 seconds are in balancing or standby mode then for 5000 seconds in charging and balancing mode and afterwards the in standby or balancing mode.
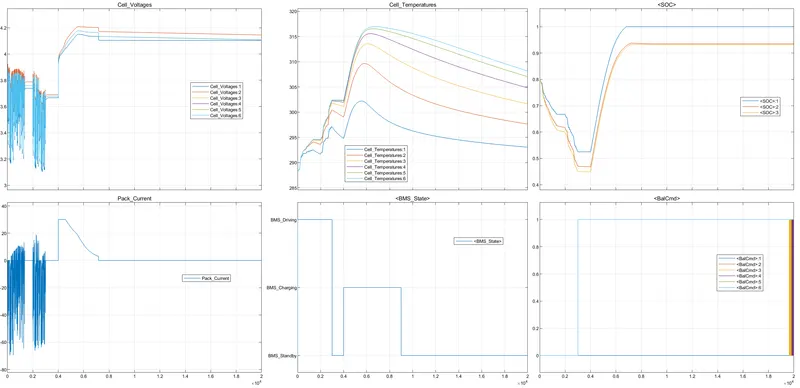
- The first cell voltage graph shows the voltage of all six cells connected in series. During the first 3000 seconds, the cell voltage decreases as the battery discharges, and during the standby period the cell balance is activated and the cell delivery stabilizes the voltage. The cell voltage then increases during charging and stabilizes while the cell is balanced.
- The second diagram containing Pack Current shows the current delivered to the battery during charging and discharging. We can also see that during charging, the current first remains constant and then the charging decreases in the constant voltage mode.
- The third graph shows the cell temperature for each cell and shows that the cell temperature increases during charging and discharging.
- The fourth diagram shows the input states with specified state inputs.
- The fifth diagram shows the charging status of the whole pack with three different calculations. The soc curve decreases as the battery discharges and increases during charging.
- The sixth diagram shows the cell balance commands for all six cells. All other cells have a signal magnitude of 1 while the first cell has a signal magnitude of 0 because it has the lowest voltage and does not need to be balanced.
Scope Output:
Test Case2:
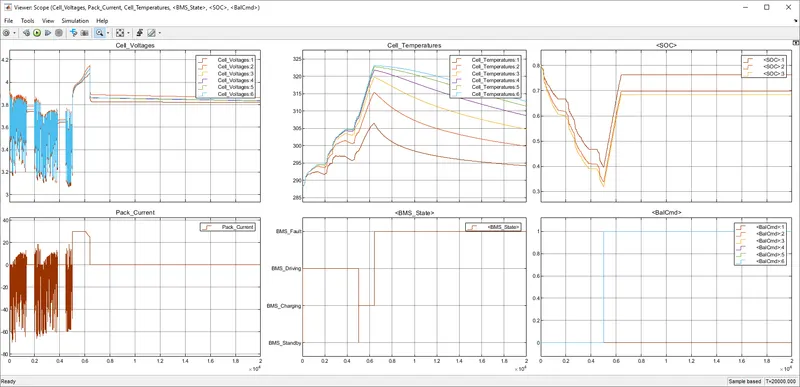
The simulation is to run for 20000 seconds in which the first 5000 seconds is the discharge or the driving mode then the rest of the time is set to charge the battery.

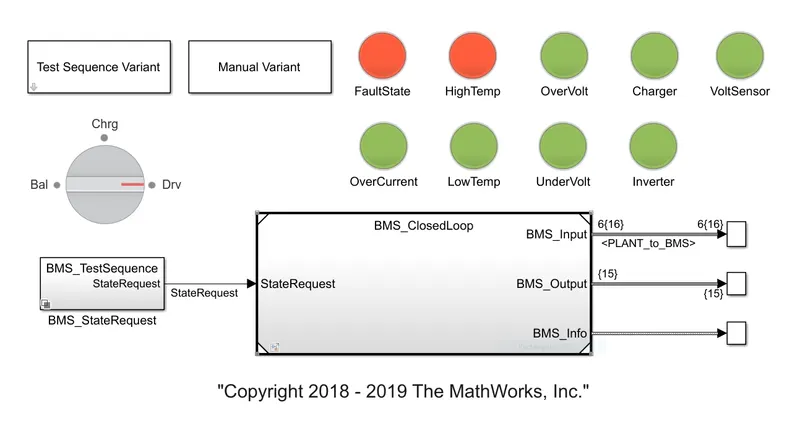
Comment for scope output:
- The first cell voltage graph shows the voltage of all six cells connected in series. During the first 5000 seconds, the cell voltage decreases as the battery discharges, the cell voltage increases during charging, and the voltage stabilizes while the cell is in equilibrium.
- The second diagram containing Pack Current shows the current delivered to the battery during charging and discharging. We can also see that during charging, the current first remains constant and then the charging decreases in the constant voltage mode.
- The third graph shows the cell temperature of all cells, the cell temperature increases during charging and discharging, and at about 6000 seconds, the temperature of the sixth cell increases to about 323.15 K and the battery fails.
- The fourth diagram shows the input states with specified state inputs until failure occurs at about 6000 seconds.
- The fifth diagram shows the charging status of the whole pack with three different calculations. The soc curve decreases as the battery discharges and increases during charging. The battery is charged up to 70-75% and stops charging if an error occurs.
- The sixth diagram shows the cell balance commands for all six cells. All other cells have a signal magnitude of 1 while the first cell has a signal magnitude of 0 because it has the lowest voltage and does not need to be balanced. Cell balancing starts when the battery starts charging, and when a fault occurs, battery charging stops, but balancing still occurs.
Scope Output:
Test Case3:
The simulation is run for 20000 seconds in which the first 10000 seconds is the discharge or the driving mode then the rest of the time is set to charge the battery.

Output:-
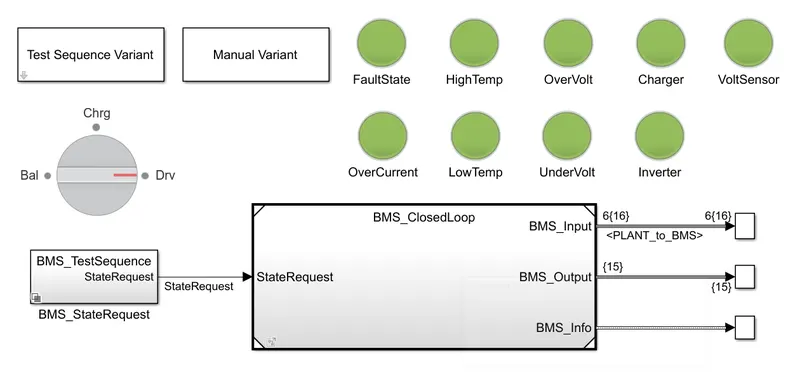
Comments for the Scope Output:-
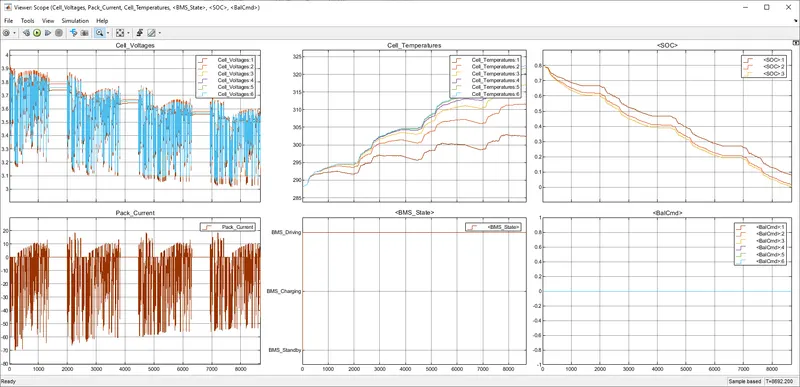
- The first graph with Cell Voltages shows the voltage of all 6 cells connected in series. The cell voltage continues to drop as the battery continues to discharge until it reaches a zero state of charge and the simulation is stopped.
- The second graph with Pack Current represents the current drawn and supplied to the battery during charging and discharging. Here we can see that the battery repeats the charge and discharge pattern as explained above in the charge and discharge load.
- The third plots the cell temperature of all the individual cells and we see how the cell temperature increases as it charges and discharges.
- The fourth plot shows the state of the input according to the given state input, the simulation runs only in discharge mode and when the SOC reaches zero, the simulation stops at about 8692 seconds.
- The fifth chart shows the charge status of the entire pack using 3 different calculation methods. The Soc curve decreases as the battery discharges and increases as it charges. Here the battery continues to discharge because the regenerative charging is very less.
- The sixth chart shows the cell alignment command for all six cells. Cell balancing does not take place because the simulation only runs in the driving state.
Scope Output:
conclusion:
Here,All the test conditions are Checked and Commented for the Scope Result.