Project - Data Handling and Interpolation
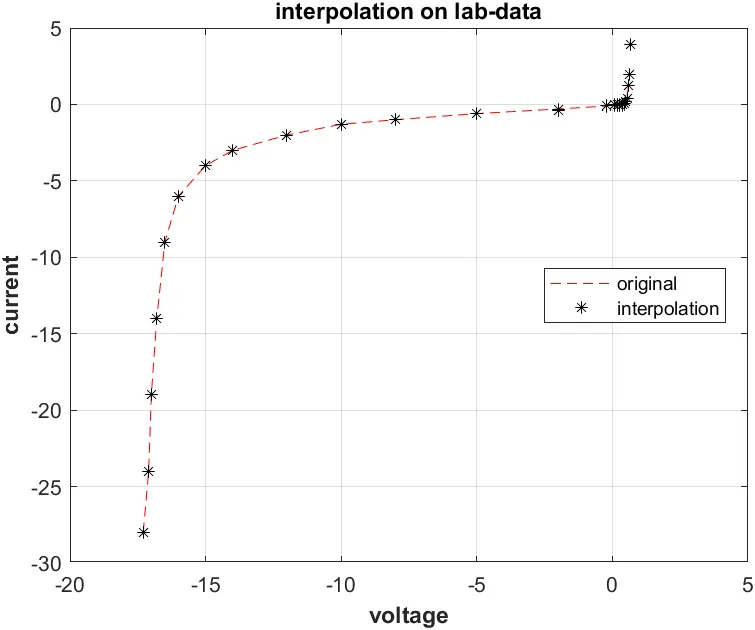
In a laboratory experiment, data of voltage and current has been recorded and the same is attached in an excel file ( Click on this link VI.xlsx ). Read the excel file in the Matlab program and perform the interpolation in the range of -17.3:0.1:0.9. Generate the interactive plot for the interpolated data and store them in a text file.
answer:
code:
% % interpolate data from laboratory data % %

a=xlsread("VI.xlsx");          % read and import the data from 'VI.xlsx' using 'xlsread' command
v=a(:,1);                      % voltage column data refered as 'v','(:,1)'--> entire row and 1st column data
i=a(:,2);                      % current column data refered as 'i','(:,2)'--> entire row and 2nd column data
x=-17.3:0.1:0.9;               % x value range
y=interp1(v,i,x);              % taken y as a interpolated value
plot(x,y,'r--',v,i,'k*');grid;  %plot the original and interpolated values on the graph
title('interpolation on lab-data');          % give title to the graph
xlabel('voltage','FontWeight','bold');       % paste x label
ylabel('current','FontWeight','bold');       % paste y label
legend('original','interpolation','Location','best');      % add legend for the graph

%% saving interpolated data on lab_data.txt file
fileID = fopen('lab_data.txt','W');  %saving file in text file
fprintf(fileID,'%8s %10s\n','V(volt)','I(mAmp)'); % print the value in text file
fprintf(fileID,'%f  %f\n',y);
fclose(fileID);                       % close the file
Result:
Graph: