Project 1 - Parsing NASA thermodynamic data
Aim:
The aim of this challenge is to develop a comprehensive MATLAB code to parse NASA's thermodynamic data from the provided "THERMO.dat" file, extract relevant coefficients for each species, and subsequently calculate their thermodynamic properties. The properties to be calculated include specific heat (Cp), enthalpy (H), and entropy (S) for the given temperature range specific to each species. The code should also determine the molecular weight of each species and save the calculated values in separate text files. Additionally, the code should generate and store plots of specific heat, enthalpy, and entropy against temperature for each species in individual folders.
Objective:
The main objective of this project is to automate the extraction and analysis of thermodynamic data for a wide range of species provided in the NASA "THERMO.dat" file. By developing a robust MATLAB code, we aim to calculate the thermodynamic properties accurately and visualize the results through graphical plots. The organized approach will enable researchers and engineers to quickly access essential thermodynamic information for different species, facilitating further analysis and research.
COMMANDS USED:
fopen - this command is used to open the data file from the folder
fgetl - used to read the required data and also to skip the data
strsplit - string splitting, used to split the string in to number of words
str2num - string to number, used to convert the string in to numbers
strfind / findstr - used to find the letter or a number in the data
mkdir - used to create a folder
saveas - used to save the plots as images
Procedure:
-
Data Parsing and Reading: The code begins by opening and reading the "THERMO.dat" file. The first few lines contain header information and global temperature ranges, which are extracted and stored in variables.
-
Parsing Species Information: For each of the 53 species listed in the data file, the code reads the relevant data, including local temperature ranges and coefficient values.
-
Thermodynamic Property Calculation: The code uses the extracted coefficient data and temperature ranges to calculate specific heat (Cp), enthalpy (H), and entropy (S) for each species. The high-temperature and low-temperature coefficients are used based on the specified temperature ranges.
-
Molecular Weight Calculation: The code calculates the molecular weight for each species using the provided information on the constituent atoms and their weights.
-
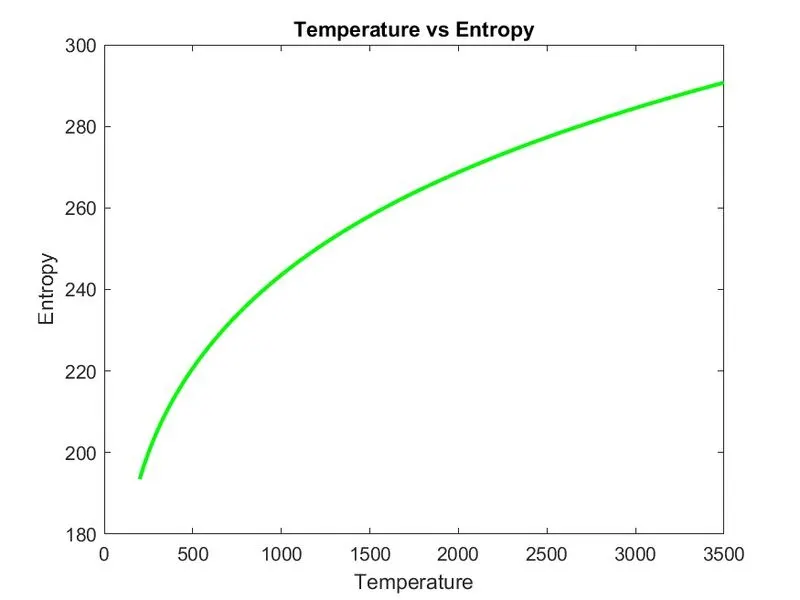
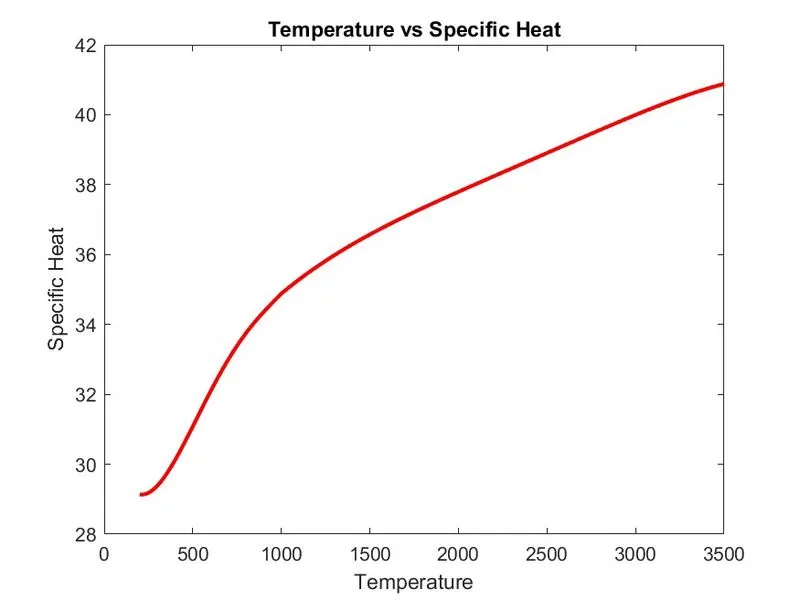
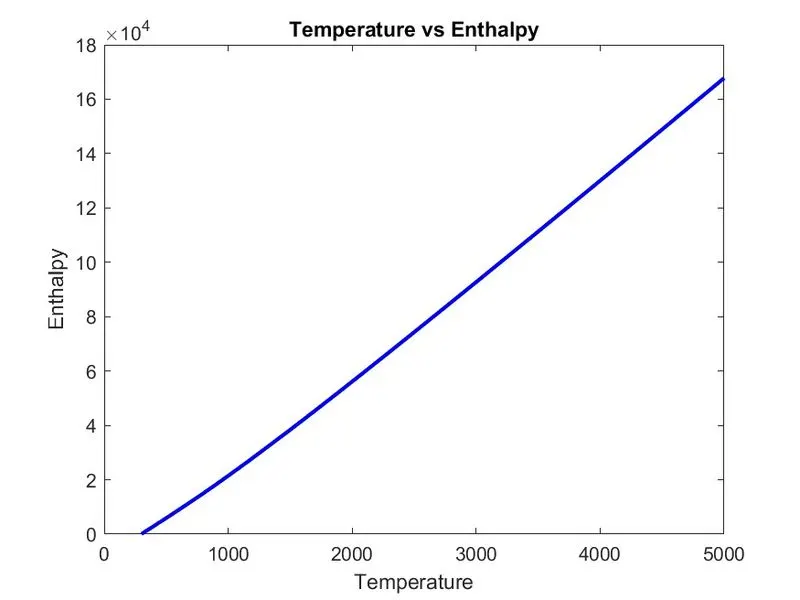
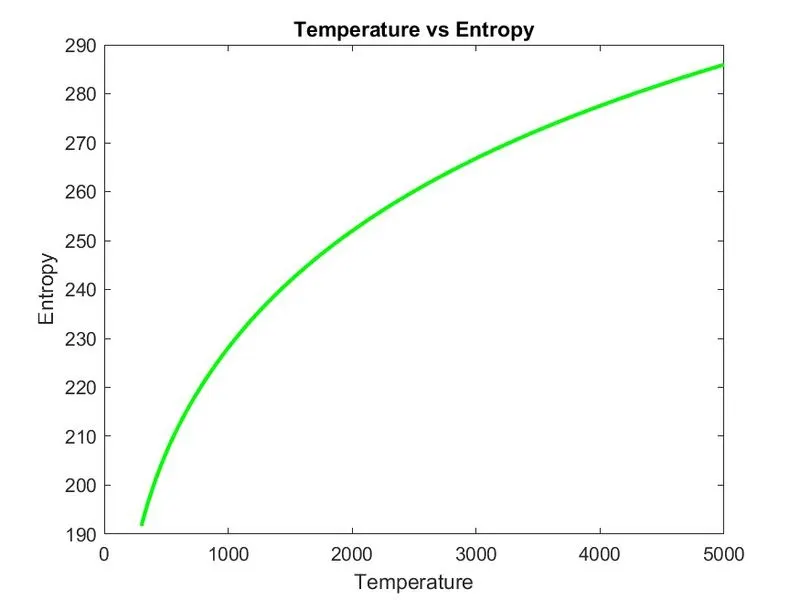
Data Visualization and Storage: Individual folders are created for each species to store the plots of specific heat, enthalpy, and entropy against temperature. The plots are generated and saved as images in their respective folders.
-
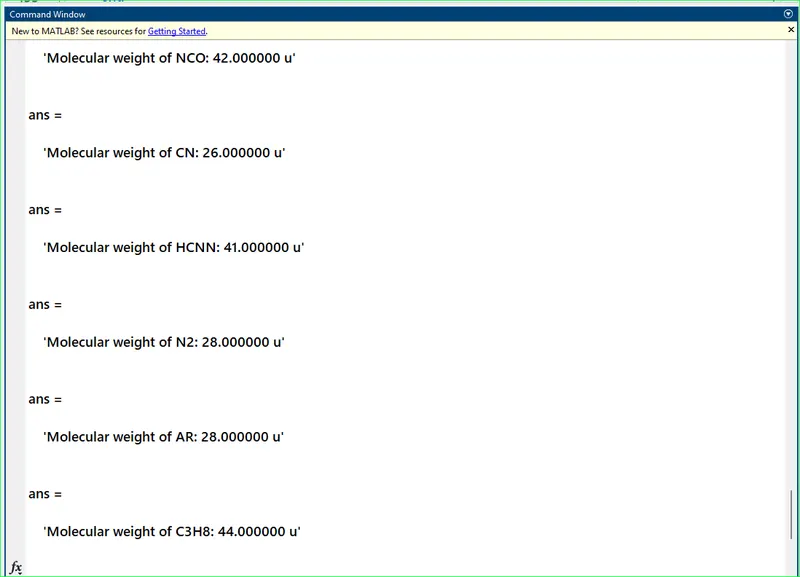
Results Storage: The calculated molecular weight values for each species are saved in a separate text file named "Molecular_Weight_Output.txt".
Code:
clc
clear all
close all

% Reading NASA Thermodynamic Data and Calculating Properties


    R = 8.314; % Universal Gas Constant

    % Open and read the data file
    dataFile = fopen('THERMO.dat', 'r');

    % Read header and temperature range data
    header_line = fgetl(dataFile);
    temp_line = fgetl(dataFile);
    A = split(temp_line);
    G_low_temp = str2double(A{2});
    G_mid_temp = str2double(A{3});
    G_high_temp = str2double(A{4});
    global_temp = [G_low_temp, G_mid_temp, G_high_temp];
    fgetl(dataFile);
    fgetl(dataFile);
    fgetl(dataFile);

    % Initialize arrays to store molecular weight and properties
    speciesNames = cell(53, 1);
    molecularWeights = zeros(53, 1);
    Cp_values = cell(53, 1);
    H_values = cell(53, 1);
    S_values = cell(53, 1);

    % Loop through each species
    for i = 1:53
        species_name = fgetl(dataFile); % Read species name
        speciesNames{i} = species_name;

        F = strsplit(species_name, ' ');
        B = length(F);
        molecule = F{1};
        L_lowtemp = str2double(F{B - 3});
        L_hightemp = str2double(F{B - 2});
        L_midtemp = str2double(F{B - 1});
        Local_temp = [L_lowtemp, L_midtemp, L_hightemp];
        T = linspace(L_lowtemp, L_hightemp, 1500);

        Coeff_line1 = fgetl(dataFile);
        C = strfind(Coeff_line1, 'E');
        a1 = str2double(Coeff_line1(1:C(1) + 3));
        a2 = str2double(Coeff_line1(C(1) + 4:C(2) + 3));
        a3 = str2double(Coeff_line1(C(2) + 4:C(3) + 3));
        a4 = str2double(Coeff_line1(C(3) + 4:C(4) + 3));
        a5 = str2double(Coeff_line1(C(4) + 4:C(5) + 3));

        Coeff_line2 = fgetl(dataFile);
        D = strfind(Coeff_line2, 'E');
        a6 = str2double(Coeff_line2(1:D(1) + 3));
        a7 = str2double(Coeff_line2(D(1) + 4:D(2) + 3));
        a8 = str2double(Coeff_line2(D(2) + 4:D(3) + 3));
        a9 = str2double(Coeff_line2(D(3) + 4:D(4) + 3));
        a10 = str2double(Coeff_line2(D(4) + 4:D(5) + 3));

        Coeff_line3 = fgetl(dataFile);
        K = strfind(Coeff_line3, 'E');
        a11 = str2double(Coeff_line3(1:K(1) + 3));
        a12 = str2double(Coeff_line3(K(1) + 4:K(2) + 3));
        a13 = str2double(Coeff_line3(K(2) + 4:K(3) + 3));
        a14 = str2double(Coeff_line3(K(3) + 4:K(4) + 3));

        % Calculation of specific heat, enthalpy, and entropy
        Cp = zeros(1, length(T));
        H = zeros(1, length(T));
        S = zeros(1, length(T));

        for j = 1:length(T)
            if T(j) > L_midtemp
                Cp(j) = (a1 + a2 * T(j) + a3 * (T(j)^2) + a4 * (T(j)^3) + a5 * (T(j)^4)) * R;
                H(j) = (a1 + a2 * (T(j) / 2) + a3 * ((T(j)^2) / 3) + a4 * ((T(j)^3) / 4) + a5 * ((T(j)^4) / 5) + a6 / T(j)) * R * T(j);
                S(j) = (a1 * log(T(j)) + a2 * T(j) + a3 * ((T(j)^2) / 2) + a4 * ((T(j)^3) / 3) + a5 * ((T(j)^4) / 4) + a7) * R;
            else
                Cp(j) = (a8 + a9 * T(j) + a10 * (T(j)^2) + a11 * (T(j)^3) + a12 * (T(j)^4)) * R;
                H(j) = (a8 + a9 * (T(j) / 2) + a10 * ((T(j)^2) / 3) + a11 * ((T(j)^3) / 4) + a12 * ((T(j)^4) / 5) + a13 / T(j)) * R * T(j);
                S(j) = (a8 * log(T(j)) + a9 * T(j) + a10 * ((T(j)^2) / 2) + a11 * ((T(j)^3) / 3) + a12 * ((T(j)^4) / 4) + a14) * R;
            end
        end

        % Save properties to arrays
        Cp_values{i} = Cp;
        H_values{i} = H;
        S_values{i} = S;

        % Calculate Molecular Weight
        MW = molecular_weight(molecule);
        molecularWeights(i) = MW;

        % Create a folder for each species
        mkdir(['C:\Users\seeni\Matlab for mechanical Engg\Thermo data\', molecule]);
        cd(['C:\Users\seeni\Matlab for mechanical Engg\Thermo data\', molecule]);

        % Plotting the graphs for specific heat, enthalpy, entropy against temperature
        figure(1)
        plot(T, Cp, 'color', 'r','LineWidth',2);
        xlabel('Temperature');
        ylabel('Specific Heat');
        title('Temperature vs Specific Heat');

        figure(2)
        plot(T, H, 'color', 'b','LineWidth',2);
        xlabel('Temperature');
        ylabel('Enthalpy');
        title('Temperature vs Enthalpy');

        figure(3)
        plot(T, S, 'color', 'g','LineWidth',2);
        xlabel('Temperature');
        ylabel('Entropy');
        title('Temperature vs Entropy');

        % Save the plots as images
        saveas(1, 'Specific Heat.jpg');
        saveas(2, 'Enthalpy.jpg');
        saveas(3, 'Entropy.jpg');

        % Return to the main directory
        cd ..

    end

    % Close the data file
    fclose(dataFile);

    % Save the molecular weight values in a text file
    fileID = fopen('Molecular_Weight_Output.txt', 'w');
    for i = 1:length(speciesNames)
        fprintf(fileID, 'Molecular weight of %s: %f u\n', speciesNames{i}, molecularWeights(i));
    end
    fclose(fileID);

% Function to find Molecular Weight
function MW = molecular_weight(molecule)
    atoms = ['H', 'C', 'N', 'O', 'A'];
    atomic_weight = [1.00794, 12.0107, 14.0067, 15.9994, 39.948];
    MW = 0;

    for i = 1:length(molecule)
        for j = 1:length(atoms)
            if strcmp(molecule(i), atoms(j))
                MW = MW + atomic_weight(j);
                dt = j;
            end
        end
        n = str2num(molecule(i));
        if n > 1
            MW = MW + (atomic_weight(dt) * (n - 1));
        end
    end
end
Command Window Output:
Steps taken to Solve:
- Now we will find the Enthalpy by creating Enthalpy function and assigning its related formula coefficient from 14 coefficients , Gas constant , Temperature and mid temperature .
- Now we will create an condition using if loop and make the temperature less than and equal to mid temperature to specify lower temperature coefficient in the formula .
- Then we will use else condition to specify coefficient of Higher temperature coefficient in the formula .
- Then end the loop and function to calculate Enthalpy.
Sure, here's a stepwise explanation of the code:
1. **File Reading and Data Extraction:**
- The code starts by opening the "THERMO.dat" file and reads the first line containing the header information.
- The second line contains global temperature ranges, which are extracted and stored in variables `templow`, `tempmid`, and `temphigh`.
- The code then skips the next three lines, which are comments.
2. **Processing Data for Each Species:**
- The code enters a loop to process data for each of the 53 species in the file.
- For each species, it reads the line containing species information, including the name and local temperature ranges (low, mid, and high).
- The following three lines contain coefficients for high-temperature and low-temperature regions. These lines are read and their coefficients are stored accordingly.
3. **Thermodynamic Property Calculation:**
- After extracting all necessary data for a species, the code proceeds to calculate its thermodynamic properties (specific heat, enthalpy, and entropy).
- For each species, the code iterates through a range of temperatures within the local temperature range.
- For temperatures below the `tempmid`, the code uses the coefficients for low-temperature regions to calculate properties using relevant formulas.
- For temperatures above the `tempmid`, the code uses the coefficients for high-temperature regions to calculate properties.
4. **Molecular Weight Calculation:**
- The code defines a function `molecular_weight` to calculate the molecular weight of each species.
- The function takes the species name as input and iterates through the characters in the name.
- It compares each character with the elements in the `atoms` array and accumulates the molecular weight accordingly.
- If there is more than one atom of the same type in the species, the function takes the quantity into account to calculate the total molecular weight.
5. **Data Visualization and Storage:**
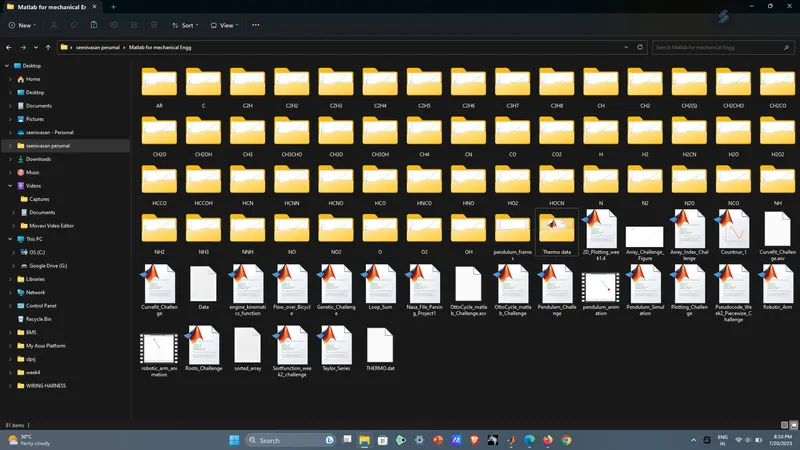
- For each species, the code creates a separate folder named after the species name.
- It then plots specific heat, enthalpy, and entropy against temperature using the calculated values.
- The plots are saved as JPEG images in their respective species folders.
6. **Saving Molecular Weight Values:**
- After processing all species, the calculated molecular weight values are stored in a separate text file named "Molecular_Weight_Output.txt".
- The molecular weight values are listed alongside their corresponding species names for reference.
7. **Output Presentation:**
- The code provides a comprehensive solution to parse NASA's thermodynamic data, calculate thermodynamic properties, and determine molecular weights for each species.
- The results are visualized through plots and stored in an organized manner for further analysis.
- The code's structured approach and automation make it a valuable tool for researchers and engineers working with thermodynamic data.
Output:
Molecular_Weight_Output Text Document
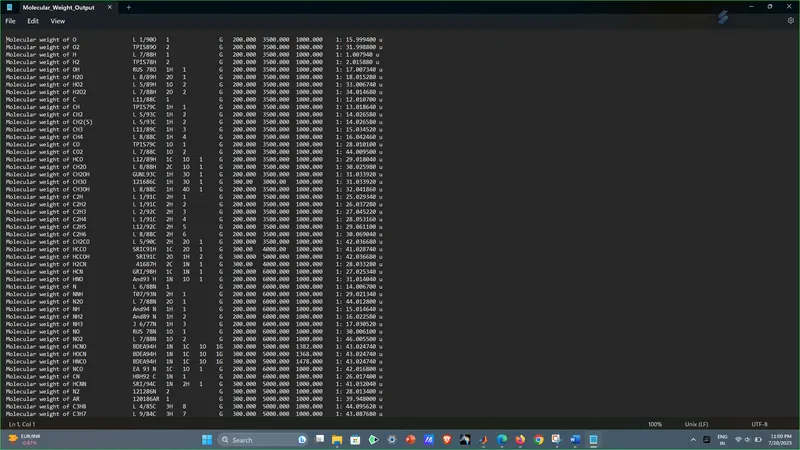
The Output was Directly Store into the Text Document instead of showing in Command Window
File Storage name of Thermo data:
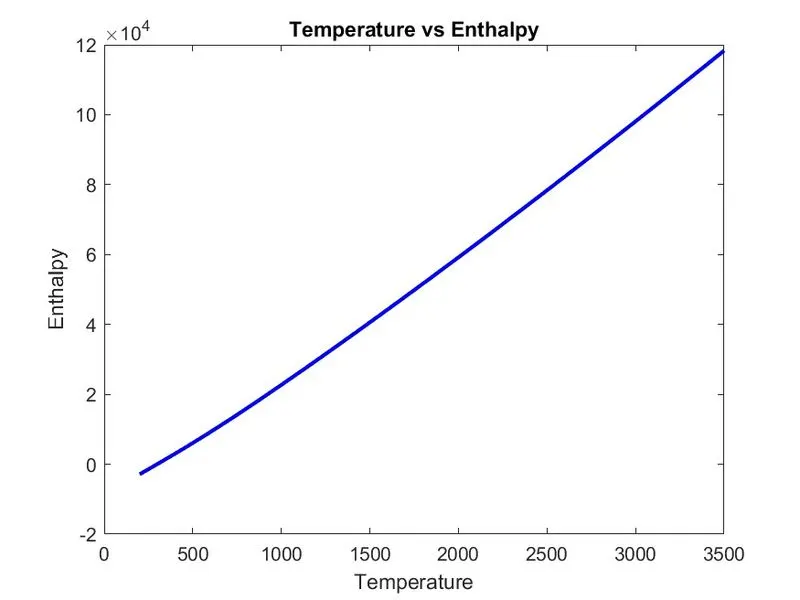
Output Figures:
Plots Of O2:Temperature vs Entholpy
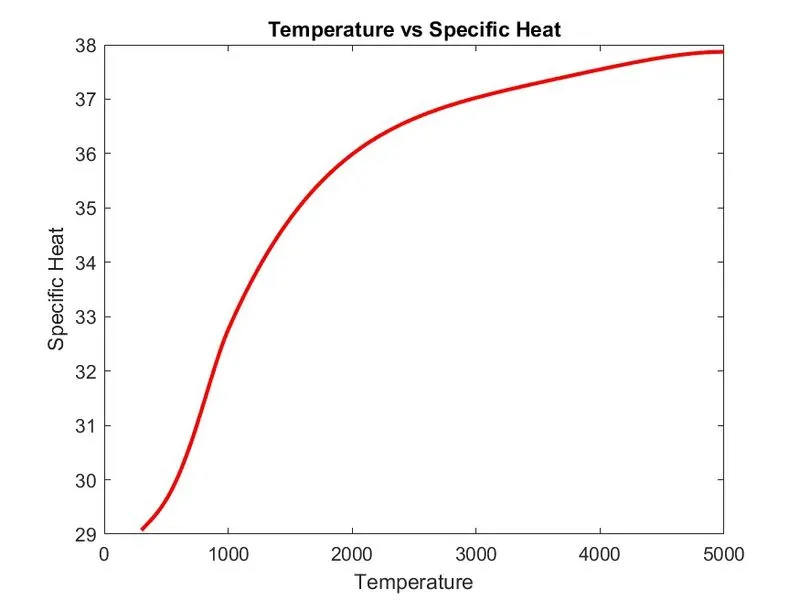
Plots For N2:
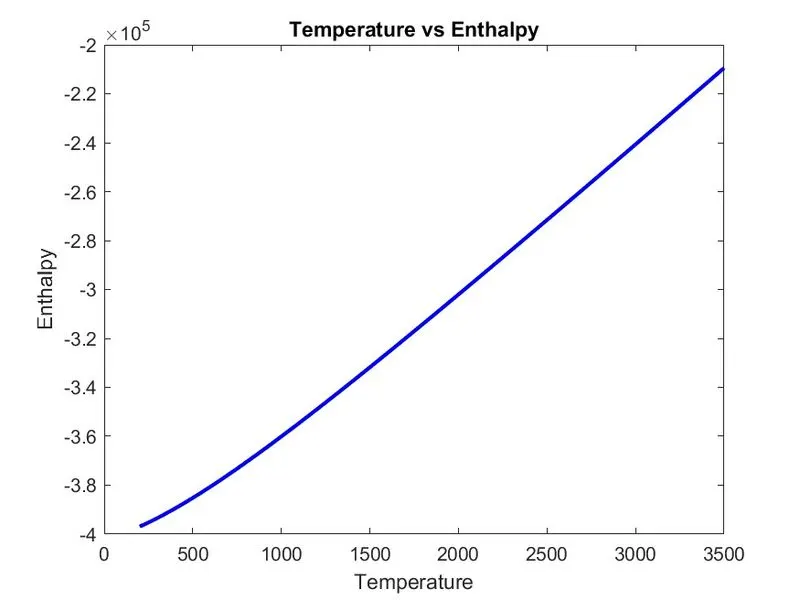
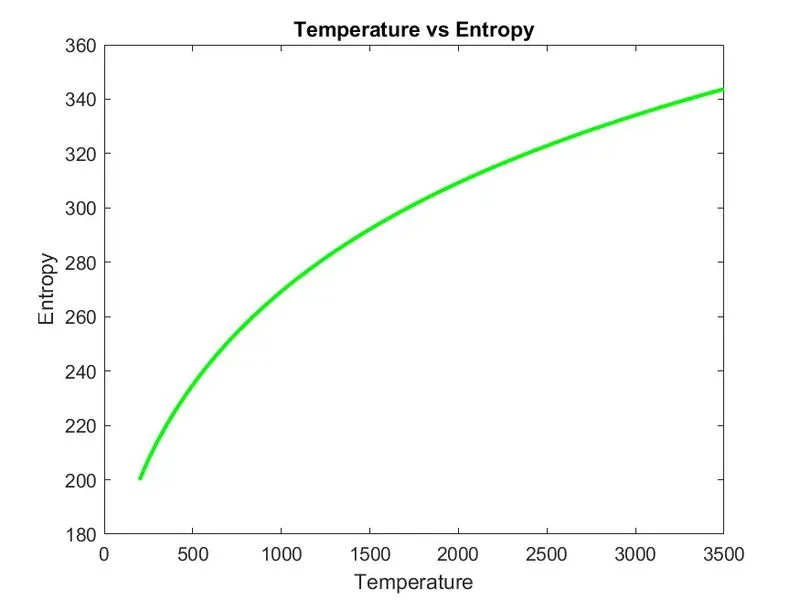
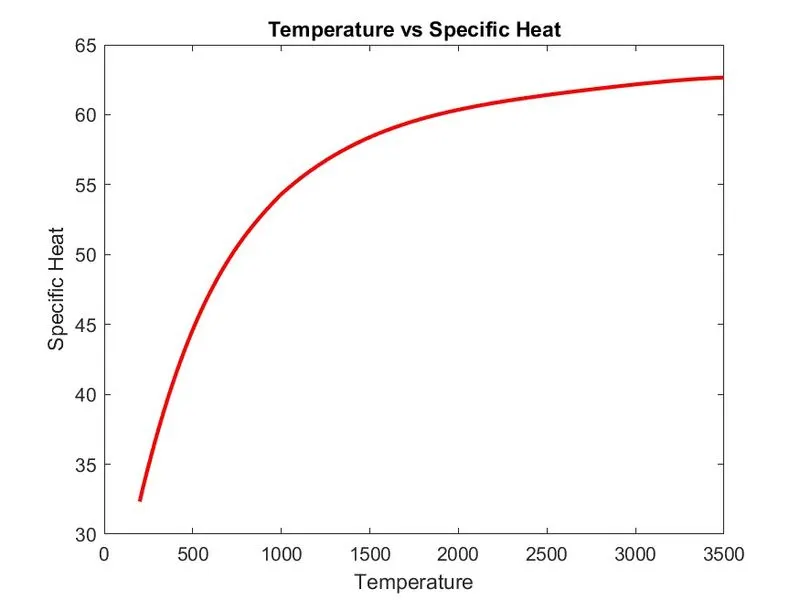
Plots For CO2:
Conclusion:
This comprehensive MATLAB code effectively achieves the aim and objectives of the challenge. It provides a robust and automated solution for parsing and analyzing NASA's thermodynamic data for a variety of species. By calculating specific heat, enthalpy, and entropy for each temperature value and determining the molecular weight of each species, the code provides essential thermodynamic information. The generated plots and organized data storage enhance the usability of the code for researchers and engineers working with thermodynamic data. This code serves as a valuable tool for data analysis, research, and further investigation into the thermodynamic properties of different species.
Reference:
https://drive.google.com/file/d/1rOyBVoA65XqmBtfkVbL9AjkP2KEIQhXN/view?usp=sharing
https://drive.google.com/file/d/14eJHq8L2dRzNtzcoaPALEV6_gDsSEHrT/view?usp=sharing
https://drive.google.com/file/d/1OehfxrUr2Z8HtCvMZ5CmkHoELbkrz5cr/view?usp=sharing