Week 6 - Data analysis
Target:
Be able to write a program to read the data, check the data, calculate the work done by the engine along with the specific fuel consumption of the engine and plot the graphs that are needed for analysis.
Theory:
Data analysis is the process of inspecting, cleaning, transforming and modeling data to discover useful information, generate conclusions and support decision making. Data analysis has many aspects and approaches, includes different techniques under different names, and is used in different business, scientific and social domains. In today's business world, data analysis plays a role in making decisions that are more scientific and help businesses operate more efficiently.
Python is an increasingly popular tool for data analysis. In recent years, a number of libraries have matured, allowing users of R and Stata to enjoy the beauty, flexibility, and power of Python without sacrificing the functionality these legacy programs have accumulated over the years.
Objectives:
TASK 1 - Create a data visualizer:
The script should take the column numbers as input and render the corresponding columns as separate images. Each file should be saved under a column name
The chart labels should be extracted from the file.
TASK 2 - Compatibility check:
If an incompatible file is provided as input, the code should exit gracefully. It should say something like "File not recognized. Please provide a valid CONVERGE output file"
TASK3 - Basic power calculation:
Calculate the area under the P-V diagram. P is in column 2 and V is in column 8.
Calculate the power output of this motor. Assume RPM is 1500
This engine consumed 20 micrograms of fuel (per 1 stroke cycle). Calculate its specific fuel consumption.
Solution Flow:
1. First we need to check the compatibility of the file and then whether the file is present or not. Once that's done, we need to take the column number inputs from the user.
2. Then we use a for loop to iterate row by row and get the labels for the graphs and data. Then we store the data in empty fields.
3. Using matplotlib, we can then plot the graphs and label them accordingly.
Using the governing equations, we can calculate all the required parameters.
Code:
import matplotlib.pyplot as plt
import numpy as np
from numpy import trapz


filename = input("Input_File_Name : ")

if filename == 'engine_data.out':
    print('valid file')

else:
    print('invalid file')
    exit()

def compatibility_check(a):
    if 'CONVERGE' not in a:
        print('please provide converge output file to process')
        exit()
    else:
        print('compatibility check is successful')
        pass

FILE = []
for line in open(filename):
    if '#' in line:
        FILE.append(line.split())

compatibility_check(FILE[0])

noc = len(FILE[1])
head = len(FILE[2])
col_no = []
col_val = []
col_units = []

z = FILE[1].index('column')

for i in range(z,noc-1):
    col_no.append(i)

for j in FILE[2]:
    if j is not'#':
        col_val.append(j)

for k in FILE[3]:
    if k is not'#':
        col_units.append(k)

print('available data are:')

for a in range(0,len(col_no)):
    print(col_no[a],col_val[a],col_units[a])

xaxis = int(input('Enter xaxis column no:'))-1
yaxis = int(input('Enter yaxis column no:'))-1

x = []
y = []

for line in open(filename):
    if '#' not in line:
        x.append(float(line.split()[xaxis]))
        y.append(float(line.split()[yaxis]))

plt.plot(x,y,linewidth=1.5)
plt.xlabel(col_val[xaxis])
plt.ylabel(col_val[yaxis])
plt.show()

pressure = []
volume = []

for line in open(filename):
    if '#' not in line:
        pressure.append(float(line.split()[1]))
        volume.append(float(line.split()[7]))

Pressure = 1e6*np.array(pressure)
Volume = np.array(volume)
area = np.trapz(Pressure,Volume)
print('workdone =',area, 'joules')
cyclepersec = 750/60
power = area*(cyclepersec/1000)
print('power=',power,'kw')
mass_flow = 20e-6
sfc = mass_flow*3600/power
print('specific fuel consumption =',sfc,'g/kwh')
Code Explanation:
1. The required modules are imported on the first lines. We then define a conditionally recursive function to check the file format. If the file is not in the CONVERGE output format, we prompt the user to re-enter the file name.
2. If the file is not found, the code exits with an error message to the terminal.
If all is well, the user will be prompted to enter two columns of numbers to plot the graph. After the user enters column numbers, we use a for loop to get the names and values of those columns and store them.
3. Then we calculate the base performance as stated in the question. Governing equations are used to calculate the required parameters. We then plot the graph between the user-specified columns and the PV area curve.
FILE PARAZING:
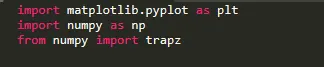
>Import the Plotting module:
We need to import a plotter as shown in the figure above to plot different types of graphs to show the variation with respect to two parameters such as volume, pressure and temperature etc.
>Import the numpy module:
To give a power to each element of an array or perform any mathematical operations (such as addition or subtraction) either on each element of an array or between arrays, we need to import the numpy library as shown above.
>Import tarpz from numpa
To import tarpz from the numpy library as above to find the area using the trapezoidal numerical method.
> Checking the input file and compactibility:
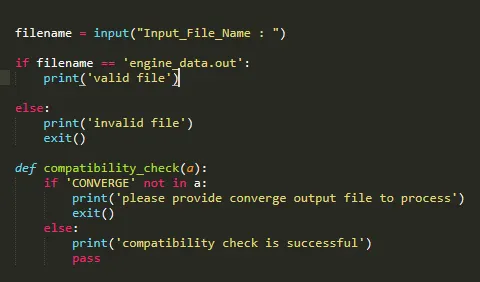
As per data analysis we need to import the correct file into the software and we need to read the entire file to analyze thedata. So, we can input the correct file and checking the compactability through converge thus it will be pass as shown in abovepic.
>Appending the converge data:
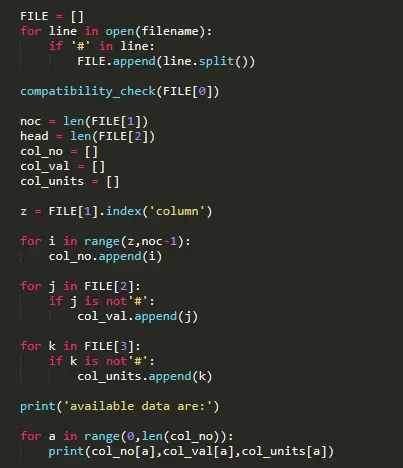
In beginning we need to check the converge is starting with the # key. Splitting the line by line using the split function.Assignning the splitted lines to the loop with variables i, j and k as shown in the above screenshot. Then finally append the datato the program. The program is about the method of indexing the specified value for analysis.
>>Program for asking the parameters for x-axis and y-axis for plotting the graphs:
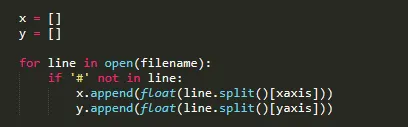
This about to create the input variables which we need to plotting for x-axis and y-axis. This is user friendly by the inputvariables it will recognize the data and giving the results which are required.
>>Calculating the required output:
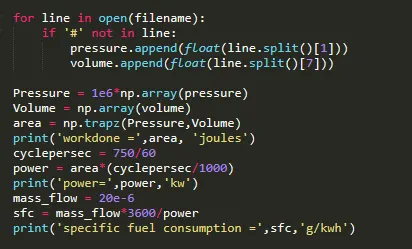
The above program is basic one in which the input the formulaes to find out the workdone, power and specific fuel consumption.
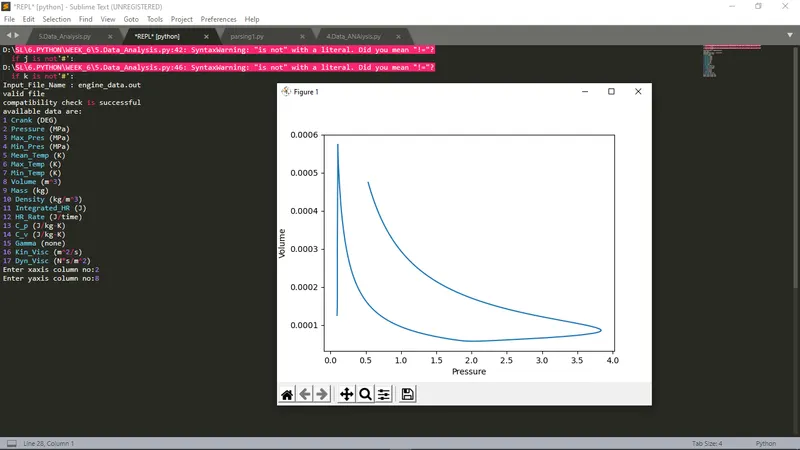
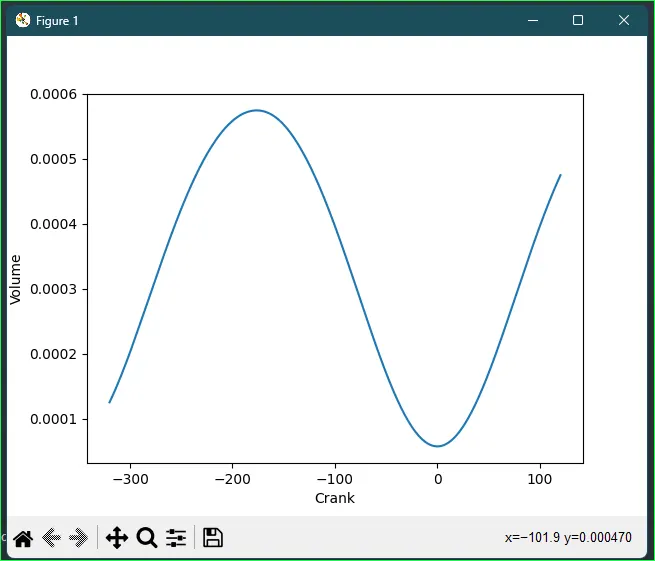
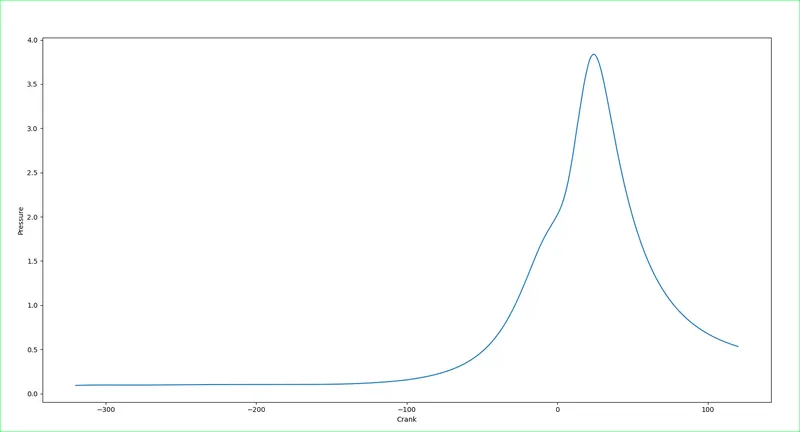
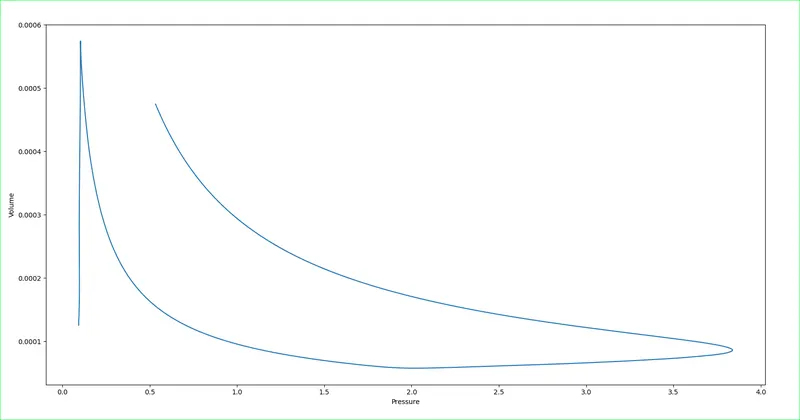
PV Diagram:
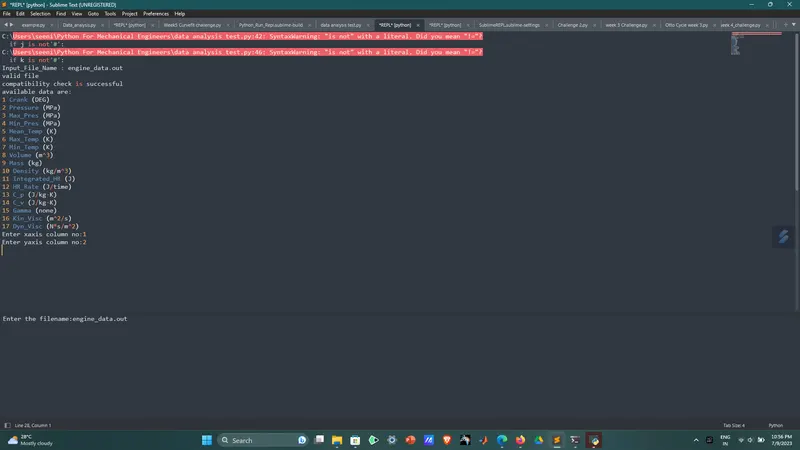
Results:
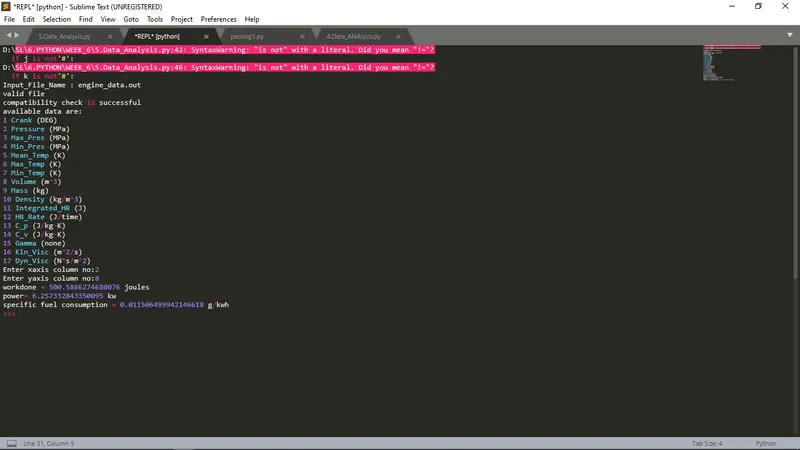
We obtained the required graphs and the compatibility check was successful. From the output code, we can see that,
The area under the PV curve is 0.500050058 m
The engine power output is 0.0125 KiloWatts
Specific Fuel Consumption is 0.001598 g/KWhr
Conclusion:
The necessary plots are obtained, and the parameters are calculated.
Drive link:
https://drive.google.com/drive/folders/1-OMDOCk_23t29YwE7L9MRrCPXIeijgCr?usp=drive_link