Project 2 - Development of TFT Cluster Speedometer Software Component
Requirement:
Development of TFT Cluster Speedometer Software Component
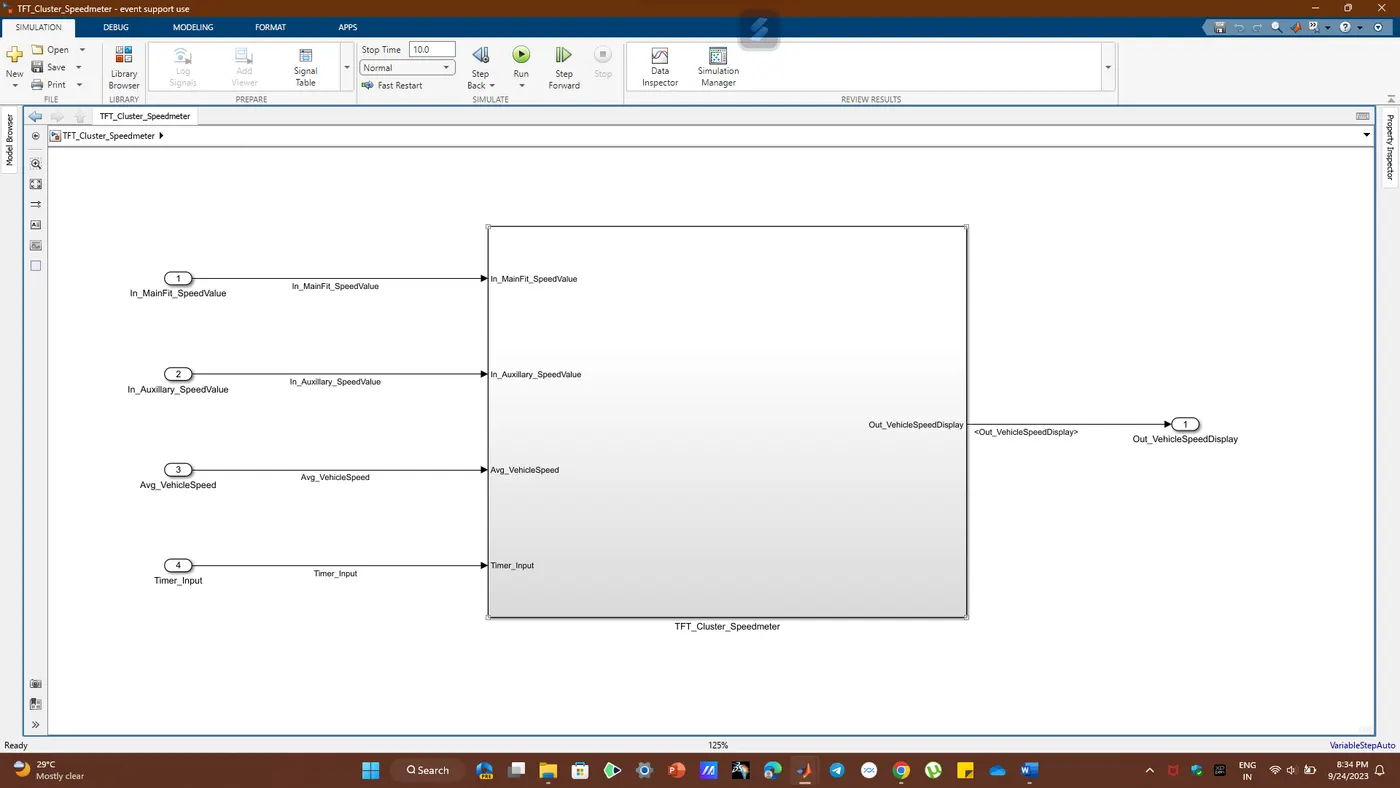
Cluster Instrument receives the signals from other ECU via CAN bus interface. It also receives commands from the driver via steering wheel buttons. The signals are then processed by the Cluster ECU, after which the Cluster ECU may send the vehicle information to the LCD or light the LEDs and so forth, according to the results. Therefore, the Cluster ECU can be viewed as a carrier of the information flow.
Simulnik Model;
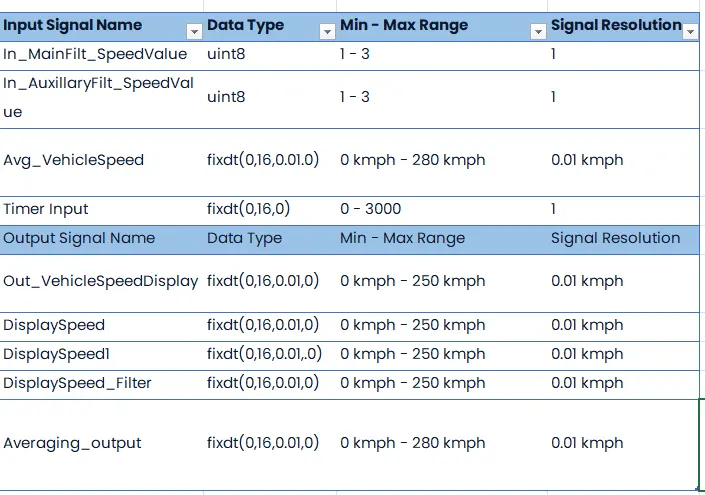
Data Values:
1. Calculating TFT Display Speed :
-
Average Vehicle Speed would be displayed only if its between 2 kmph & 250 kmph. Any value outside this range will be discarded by its lower limit & upper limit.
-
When Average Vehicle Speed is < 2 xss=removed>
-
When Average Vehicle Speed is in between 2 kmph & 250 kmph, Display Speed = Average Vehicle Speed.
-
When Average Vehicle Speed is > 250 kmph, Display Speed = 250 kmph.
This set of requirements is implemented using the saturation block. The signal Average_VehicleSpeed is passed through the saturation block which is configured to have upper limit of 250 and lower limit of 2. The output of the saturation block is the signal Display_Speed.
The block diagram is shown below.
2. Main Data Filtering:
-
Main Data Filtering subsystem will be activated for every 10th millisecond.
-
DisplaySpeed1 (t) = ((DisplaySpeed (t) x 0.65)/ Main Filter Speed Value) – 0.05
This subsystem is constructed as below.
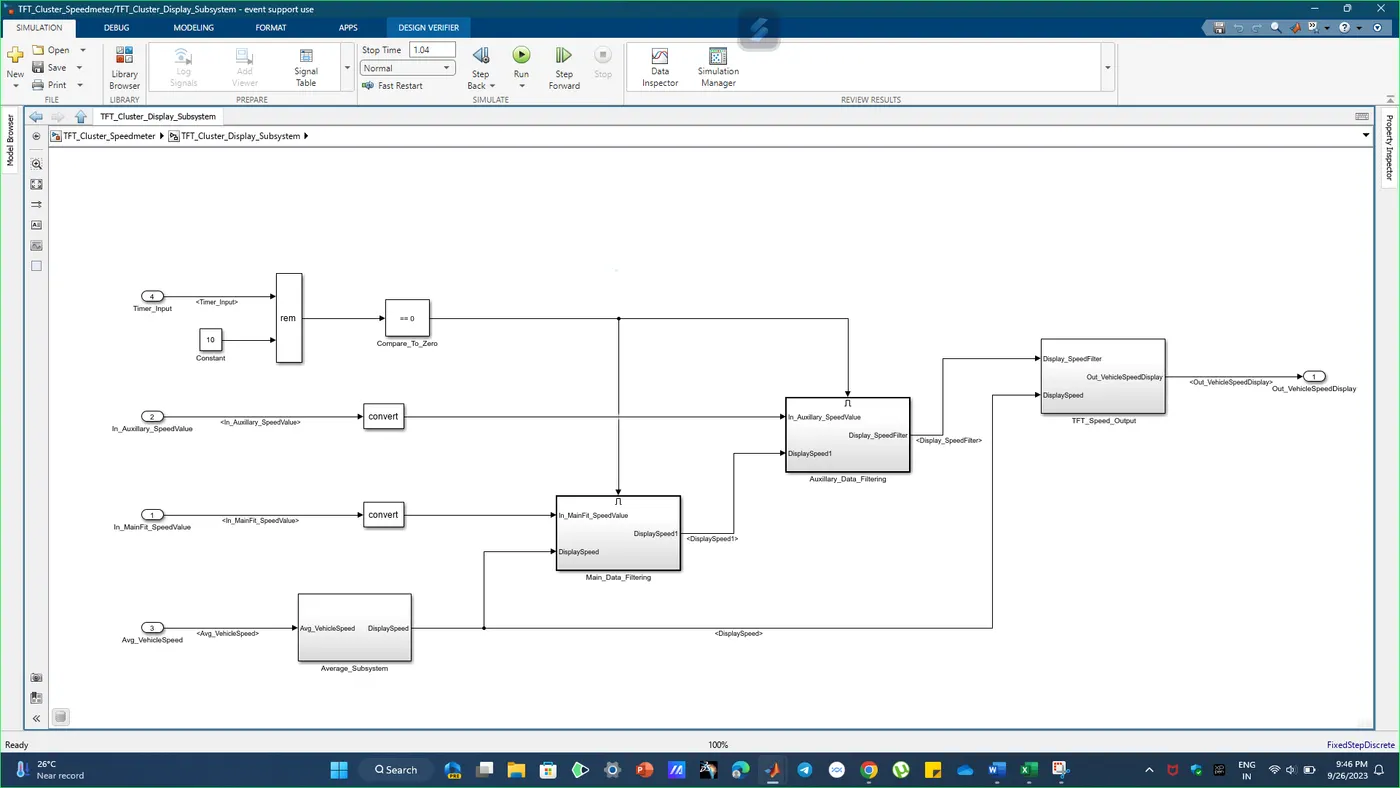
This is a enabled subsystem. The subsystem gets activated only when the control signal at enable port is high.
The control signal is generated by equating the remainder of timer input on dividing by 10, with 0. Meaning that every 10th milisecond , the remainder will equal to 0 and the control signal will be high which will enable the main data filtering subsystem.
3. Auxiliary Data Filtering:
-
Auxiliary Data Filtering subsystem will be activated for every 10th millisecond.
-
DisplaySpeed_Filter (t) = ((DisplaySpeed1 (t) x 0.78)/ Auxillary Filter Speed Value) – 0.03
This subsystem is also modeled as enabled subsystem. The same control input is used for the enable port. The block diagram is shown below-
4. TFT Speed Output:
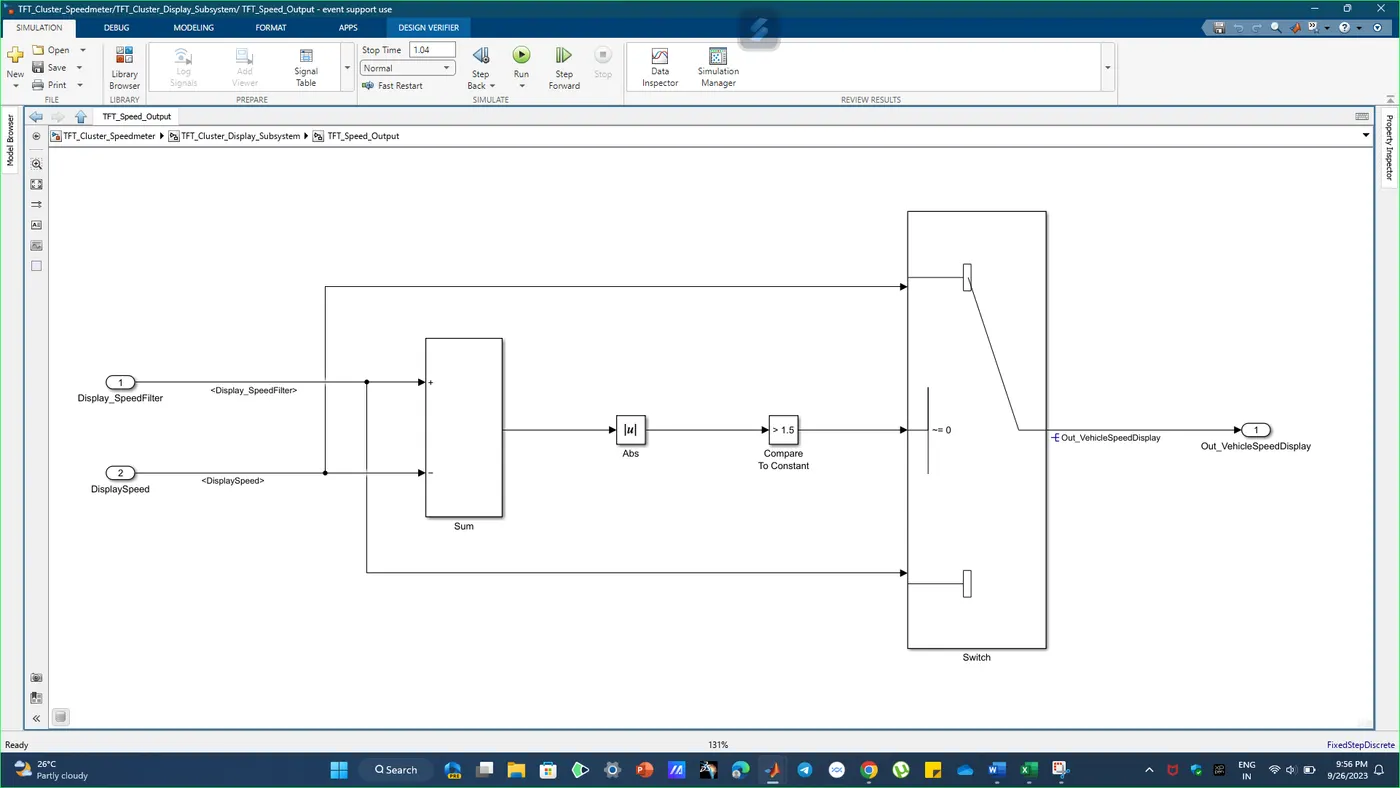
The condition to implement is this subsystem is stated as -
-
If (DisplaySpeedFilter - Displayspeed)l > 1.5
{
Vehicle Speed Display = DisplaySpeed
}
else
{
Vehicle Speed Display = DisplaySpeed Filter
}
The above conditions are implemented using sum, abs, compare to constant and switch block. To ease the signal routing Goto tags are also used. The finished subsystem is shown in the following figure-
Requirement Tagging:
Requirement tagging is done to the subsystem which is as seen below
Requirement 1 Tagging:-
Requirement 2 Tagging:-
Requirement 3 Tagging:-
Requirement 4 Tagging:-
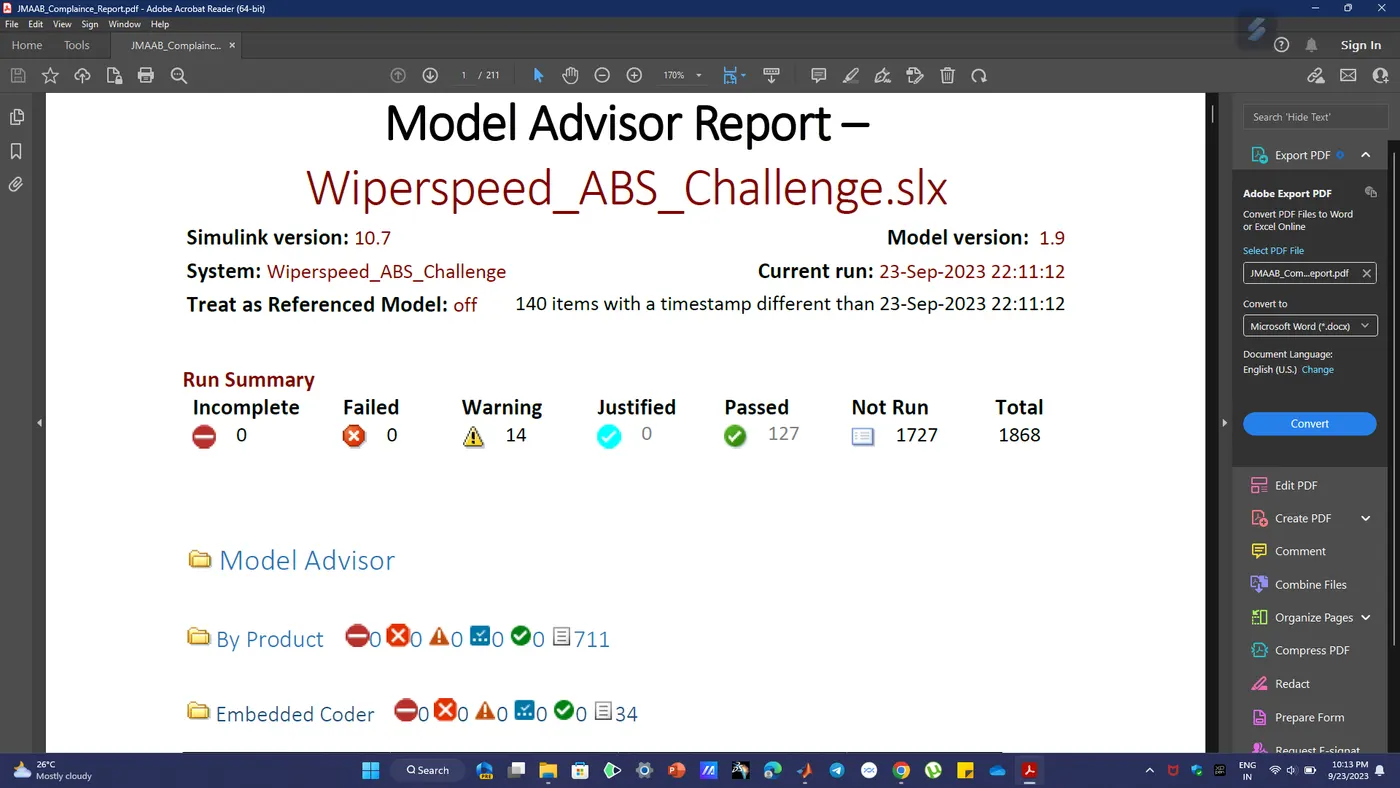
JMAAB Guideline Check:-
The JMAAB Test for the above model is made and the test is successful.
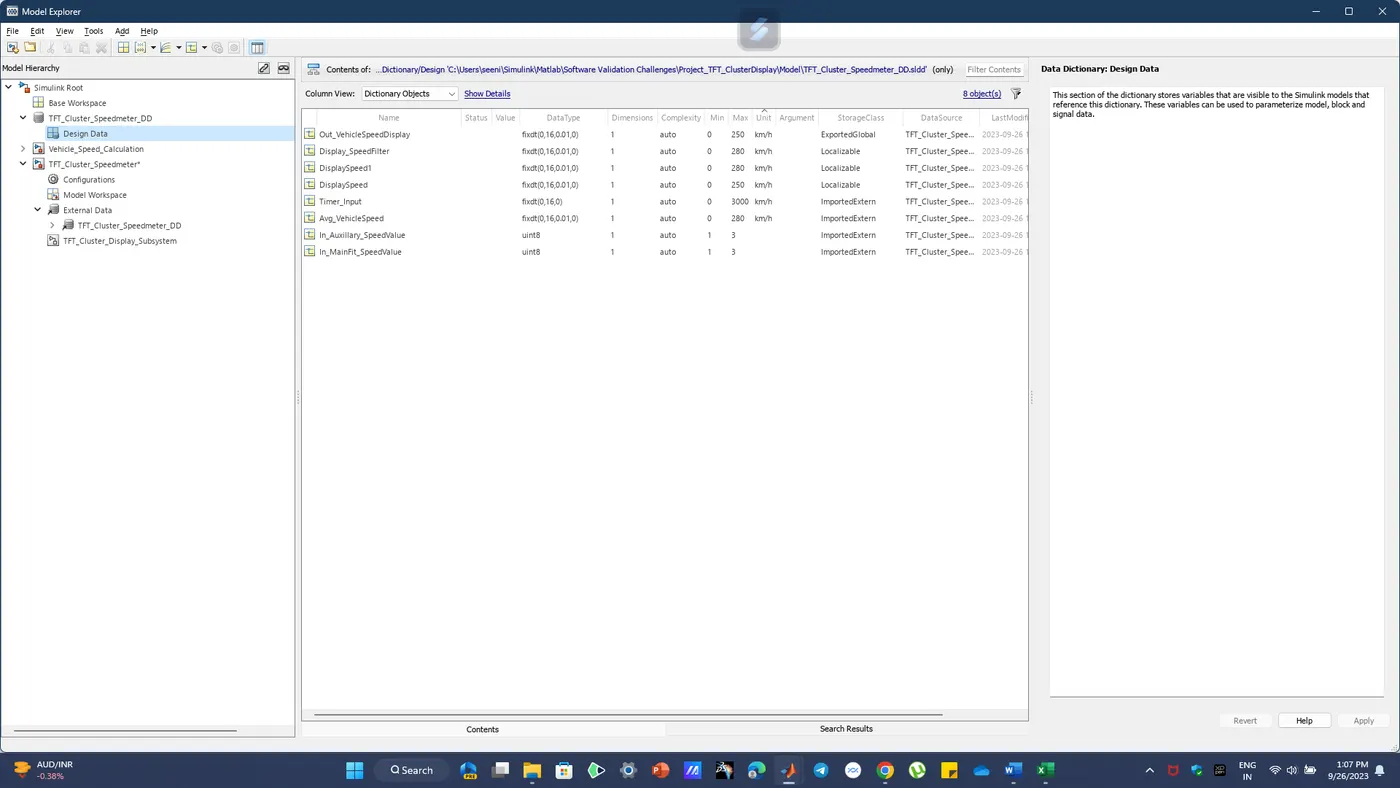
SLDD FILE:
Requirement Tagging:
Requirement tagging is done using the Requirement Manager app. At first the app is launched within the Matlab environment. Then we open the requirement editor and add new requirement set using the plus button in the top ribbon.
Test Case:-
The test case for the above file is created by using excel sheet and fed as input to the signal builder during harness testing.
Here the file created is named as Signal builder.
SIL Harness Creation:
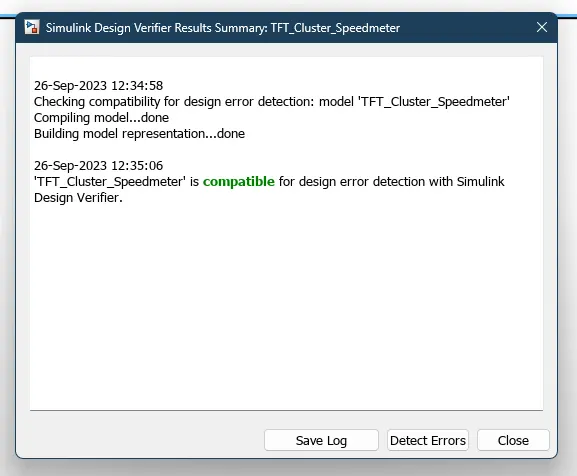
SLDV Compatability Checking:
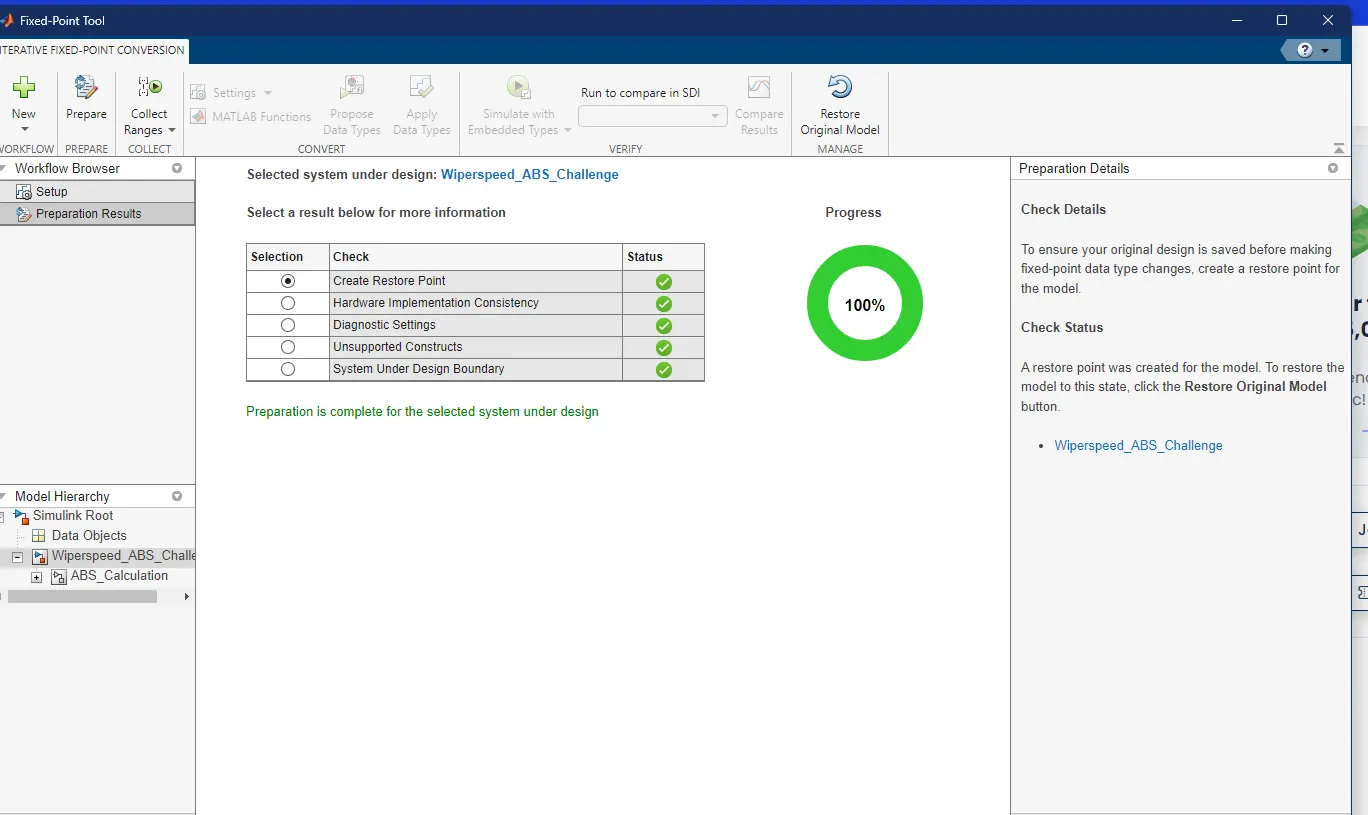
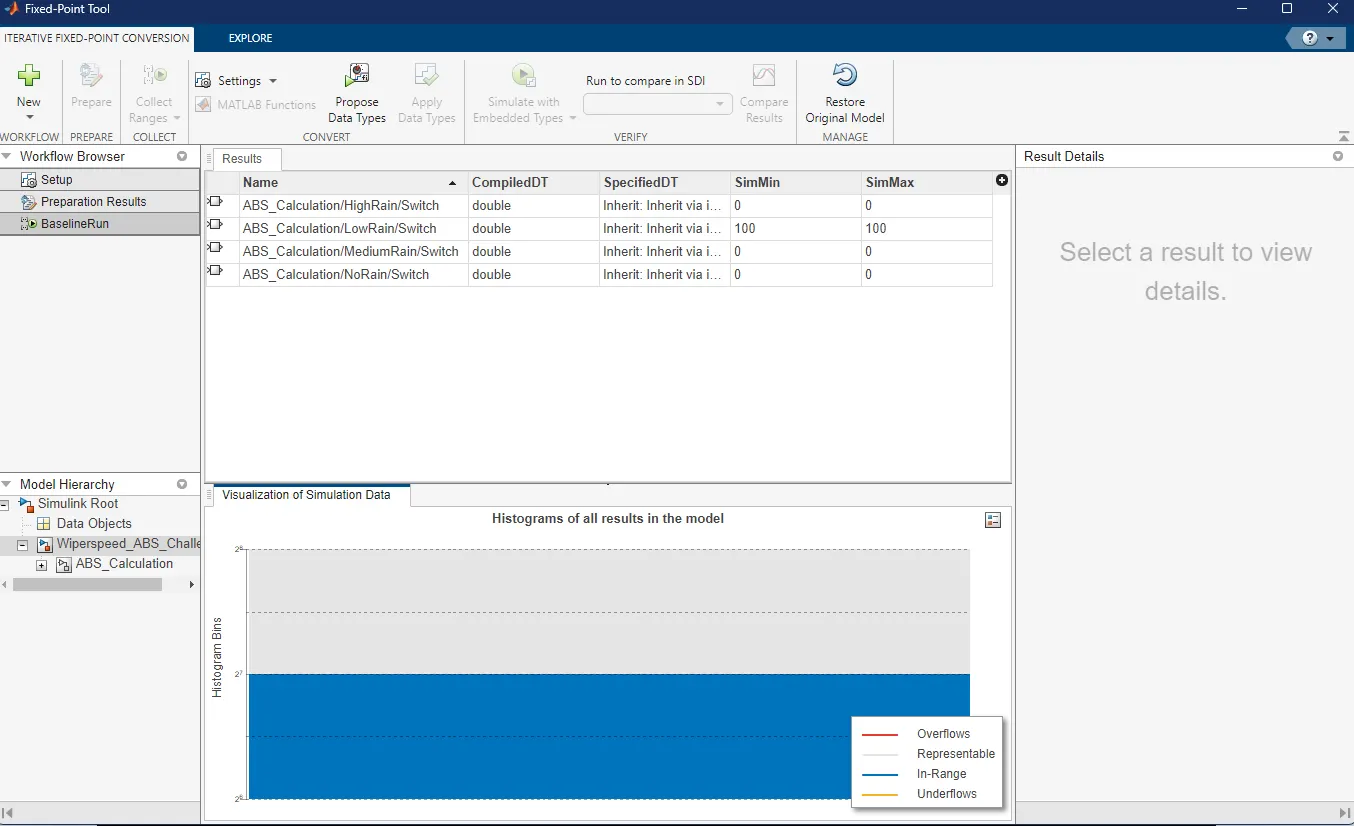
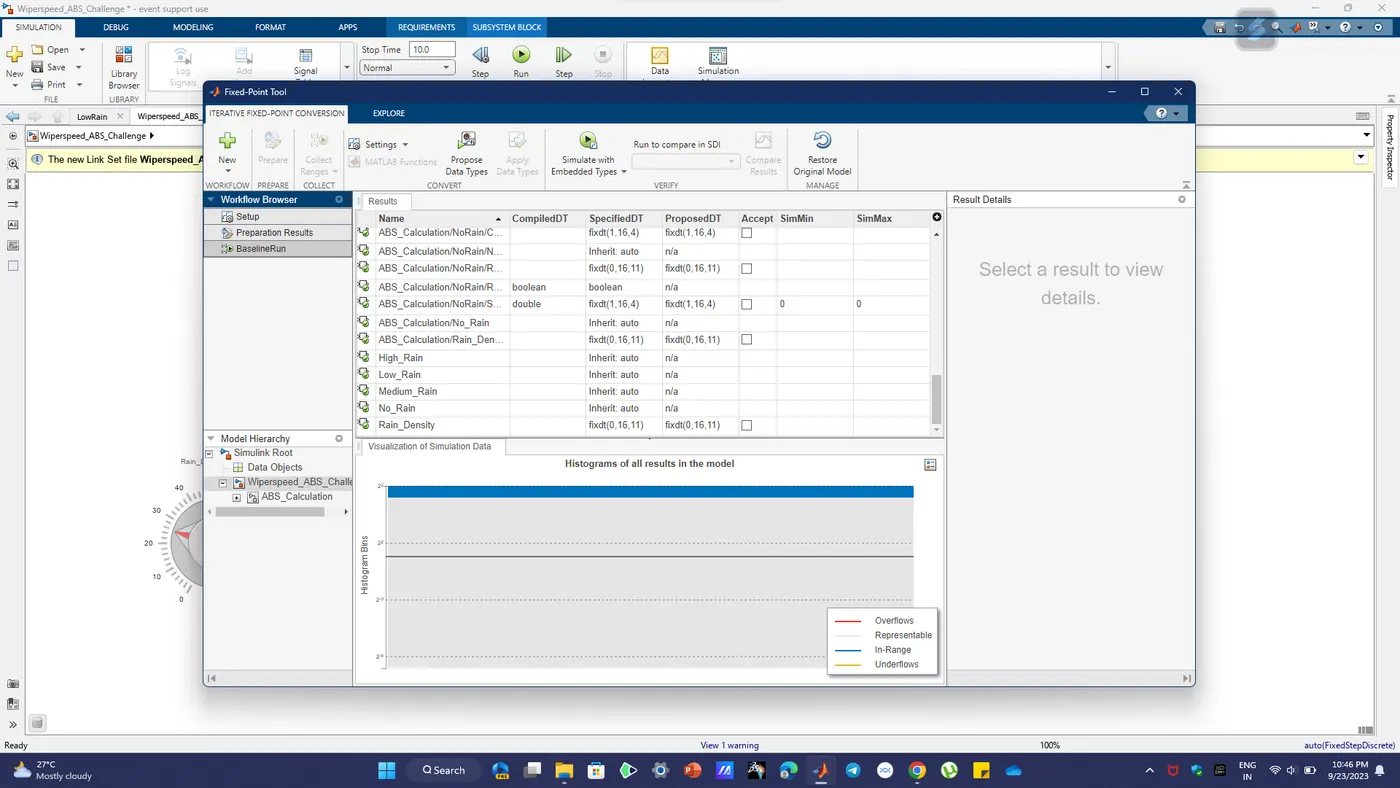
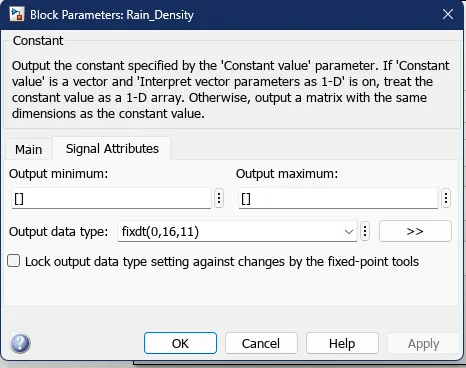
Fixed TOOL Point Images:
SLDV Test Generation report:
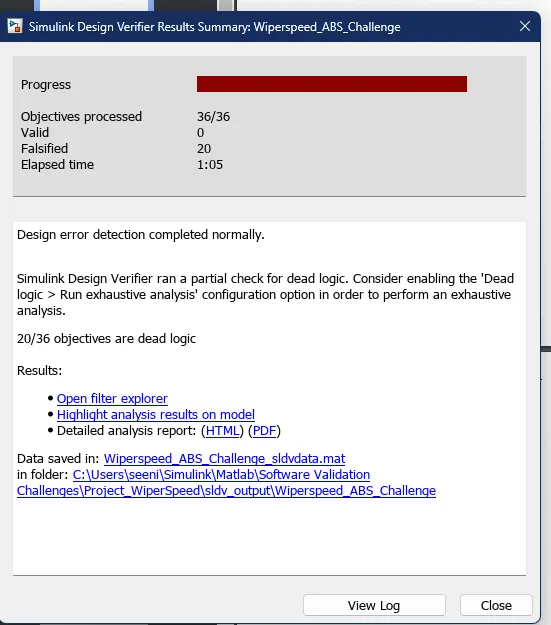
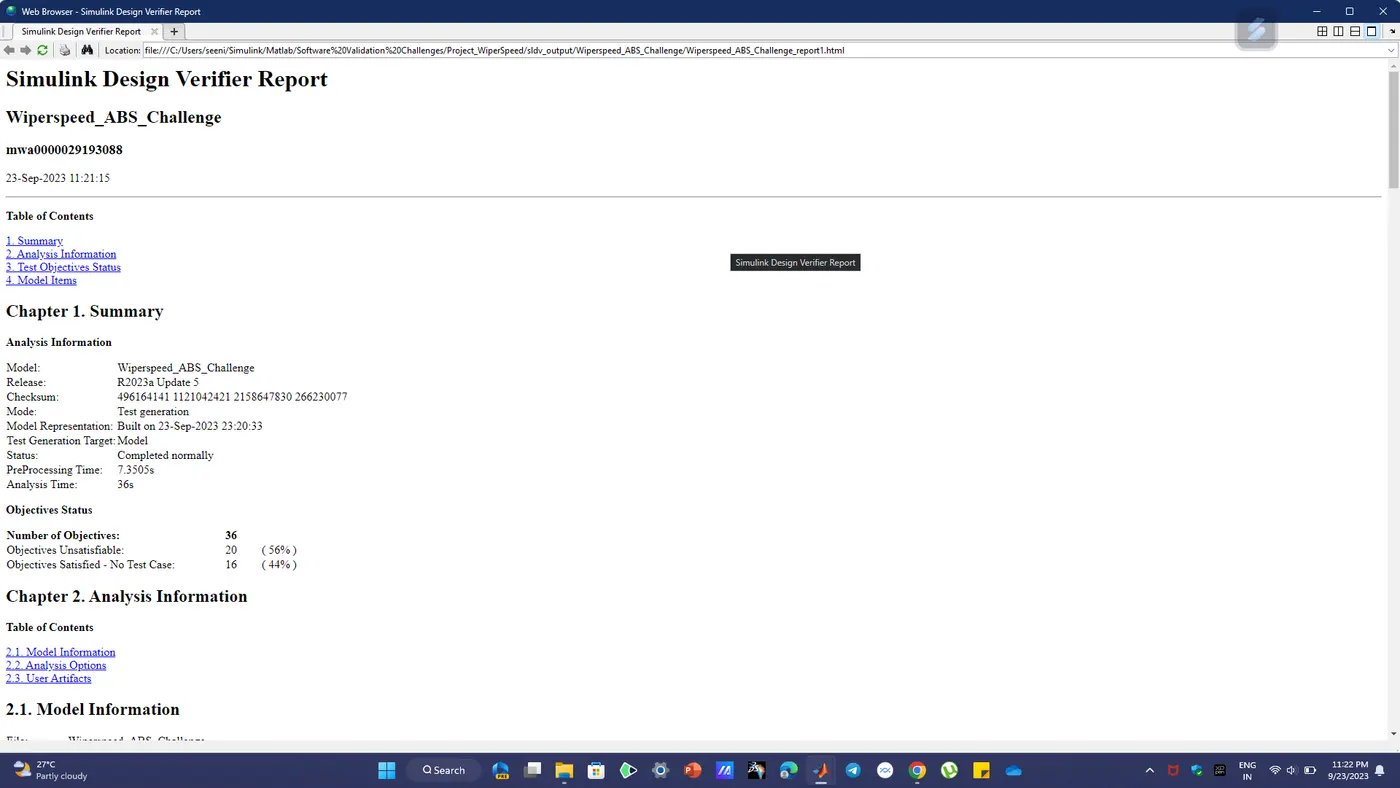
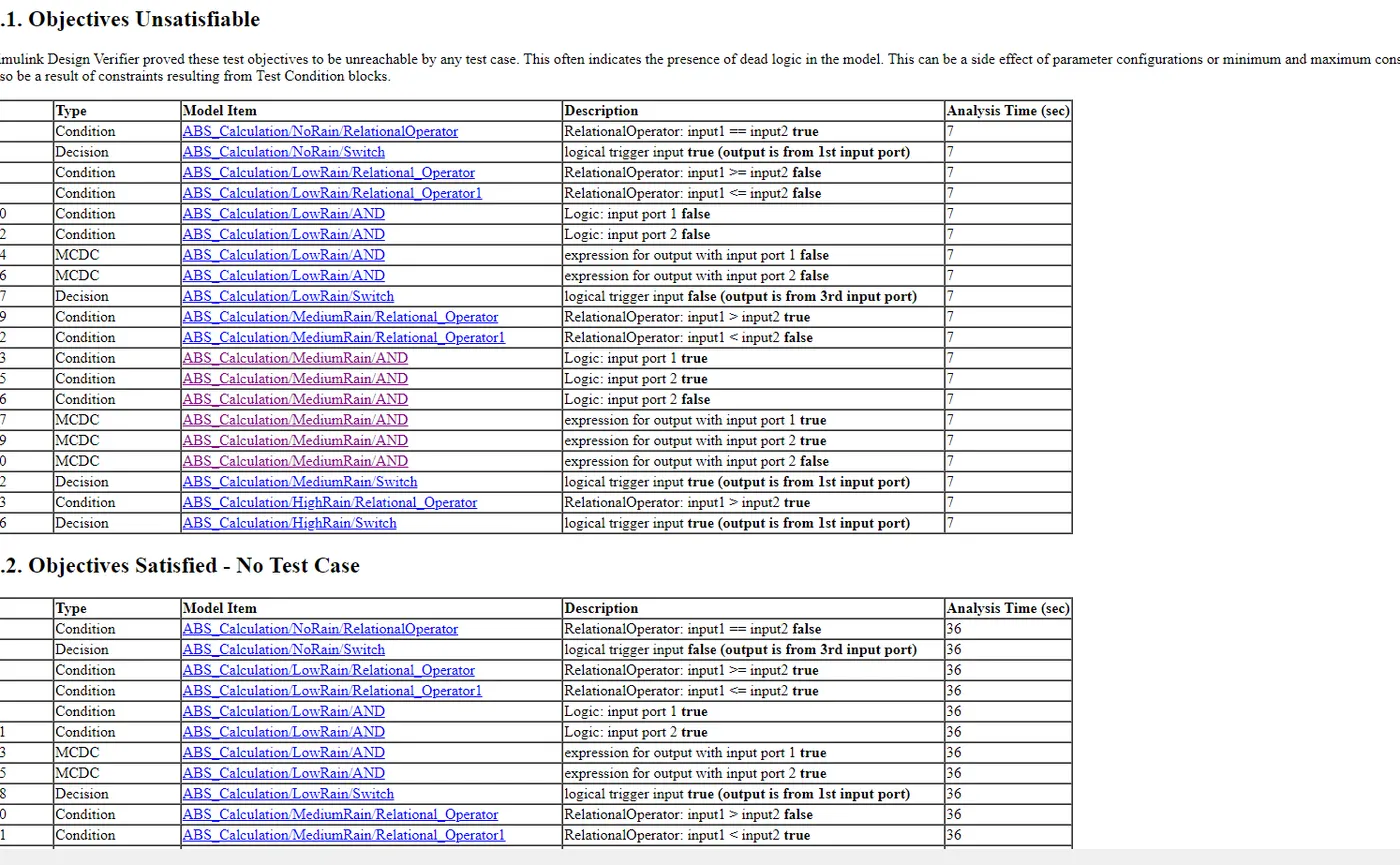
In the next step, test geneartion is done in the Design verifier tool. The test generation coverage is set to MCDC and other settings were left at default value.
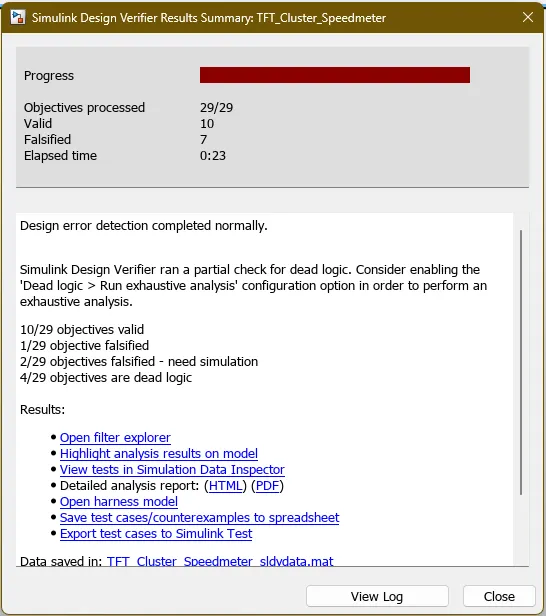
Error Detection Report:
Model Advisor Report:
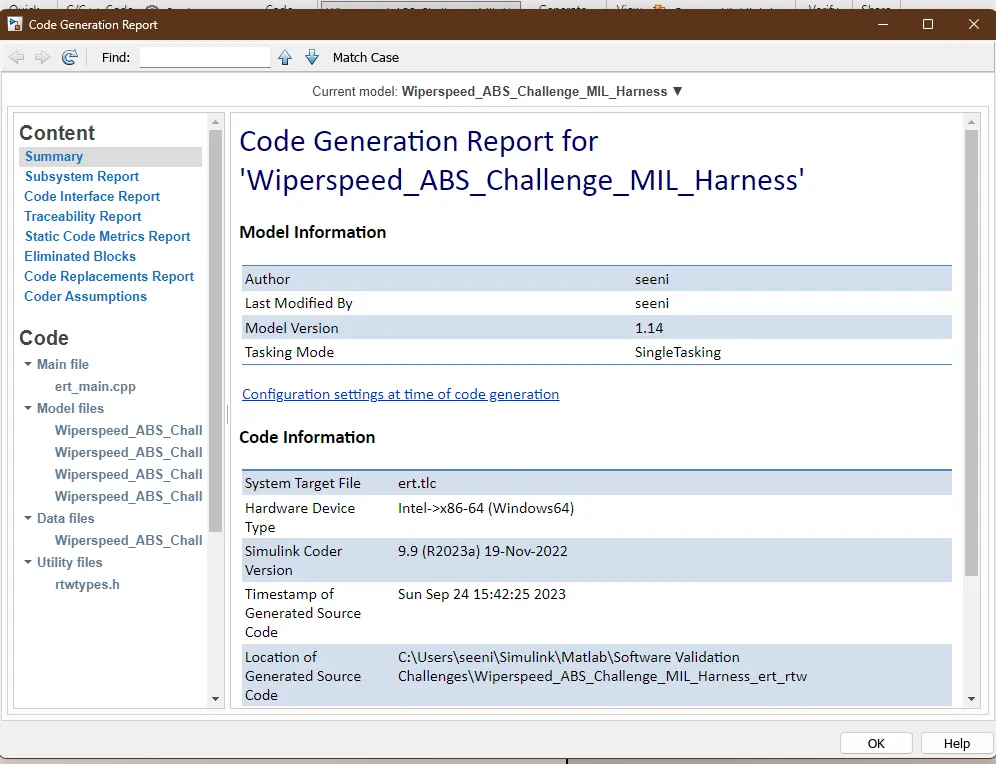
Code Generation:
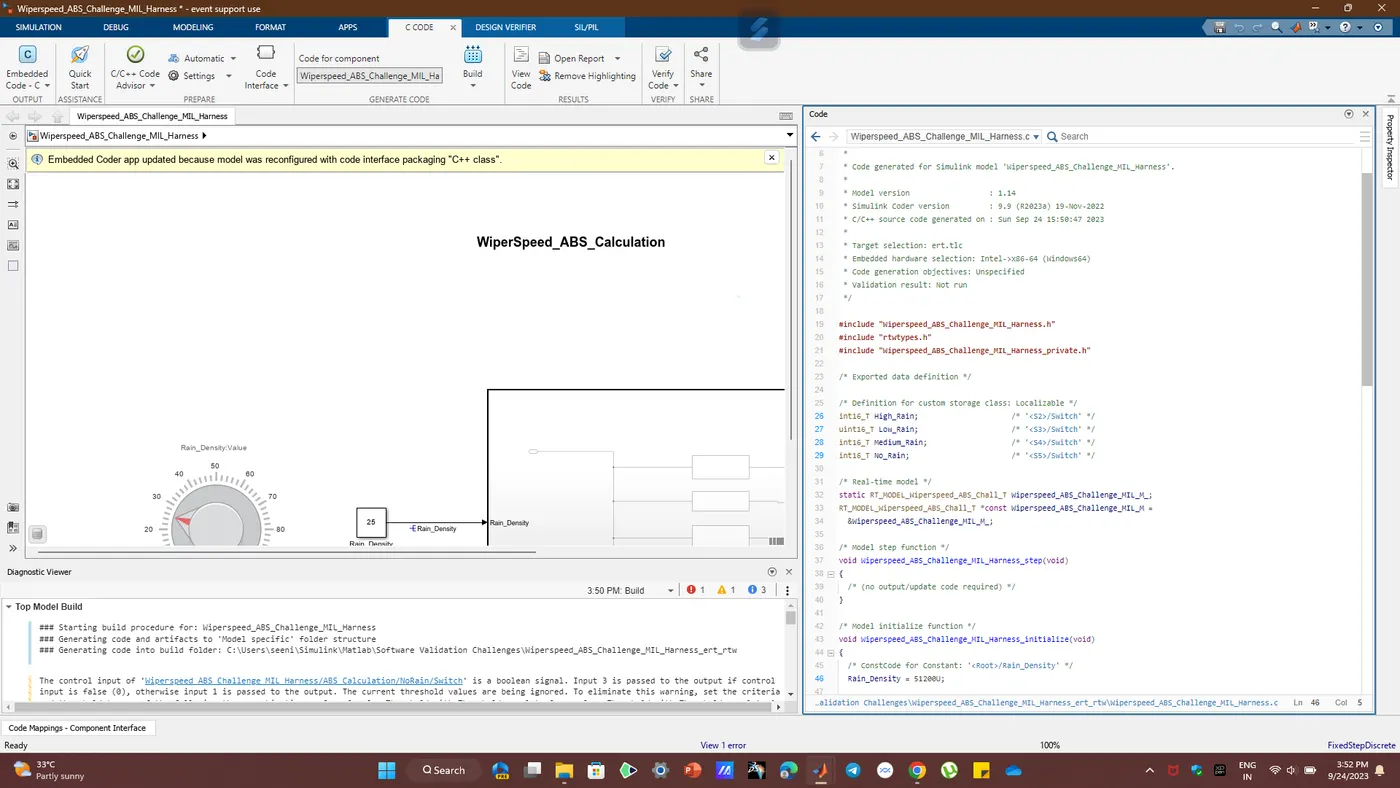
Code Settings:
Model in loop and Software-in-loop:
Model in Loop test + coverage:
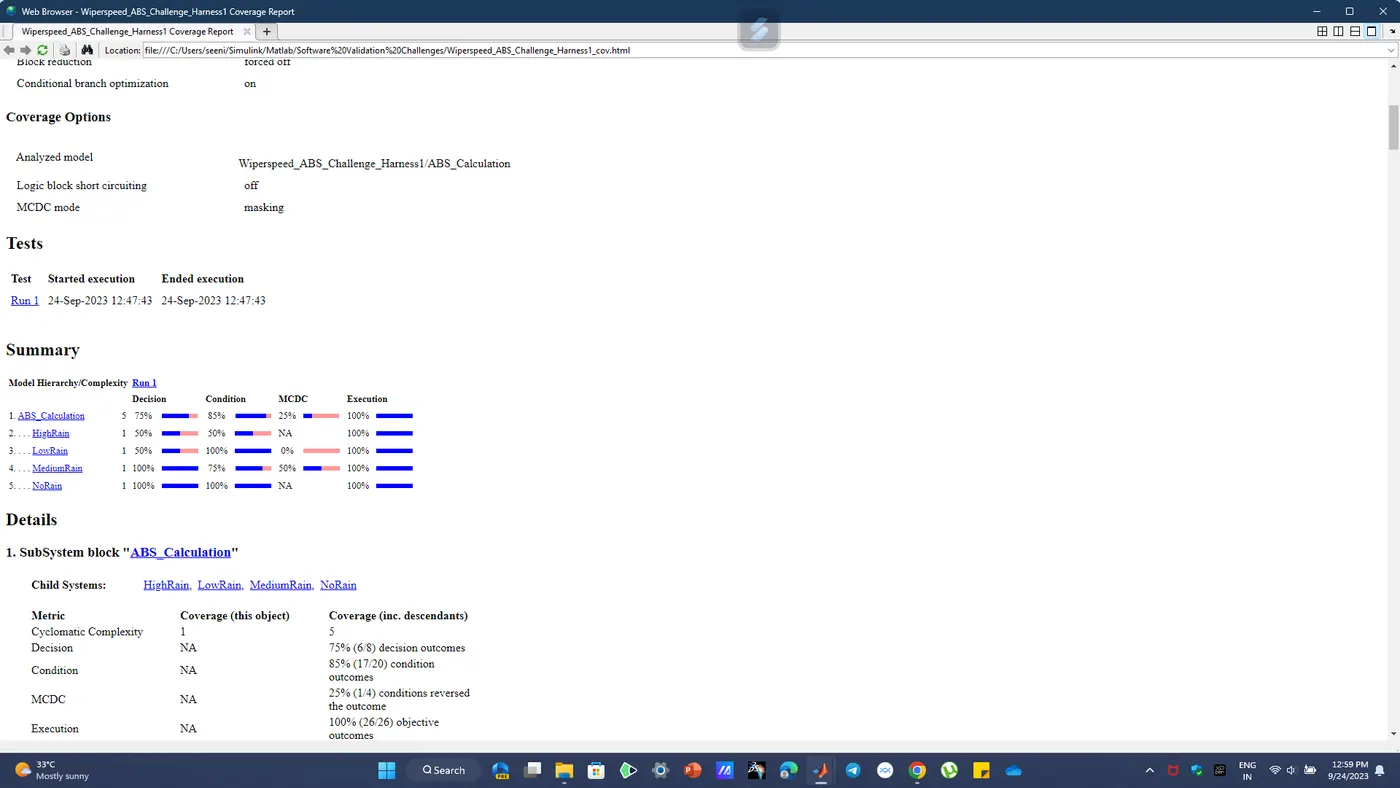
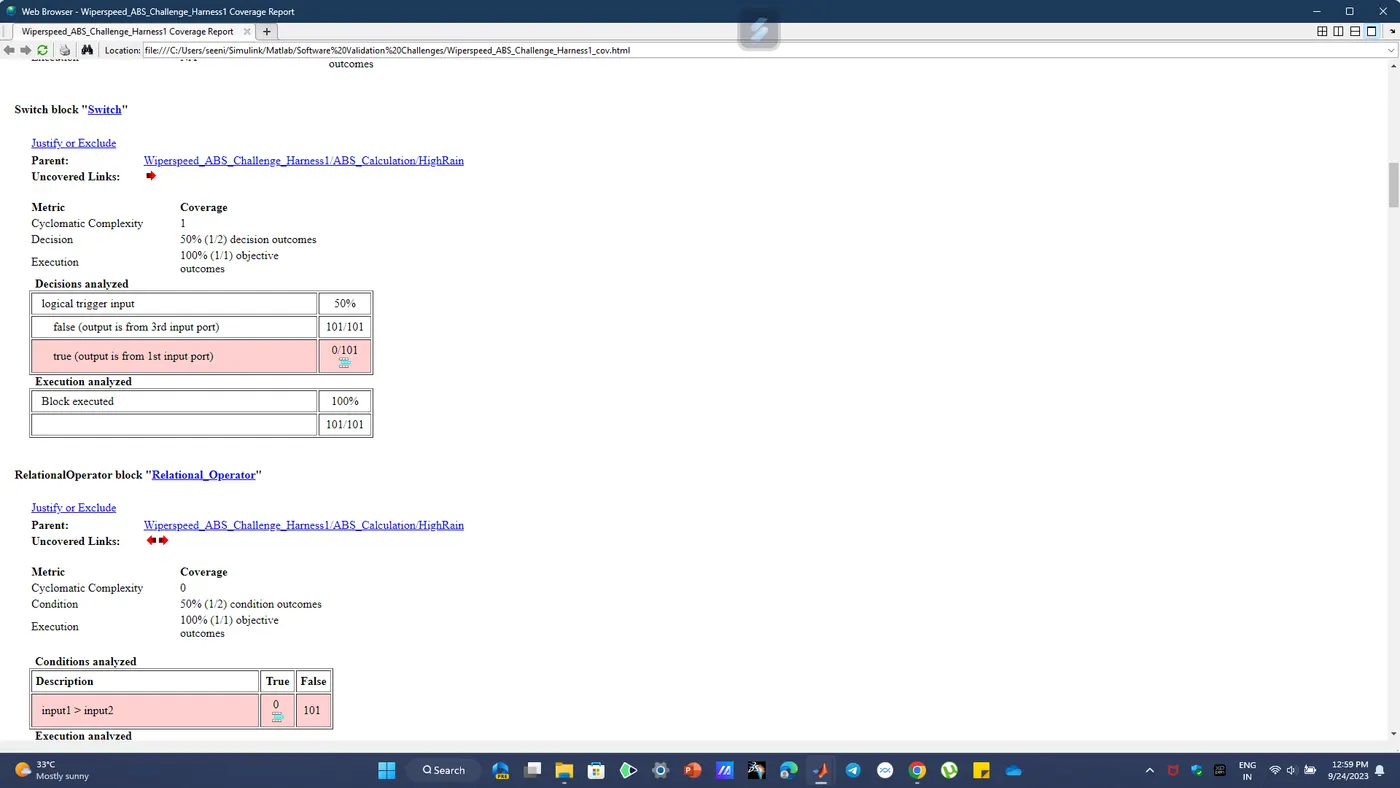
Before going in to Model in loop testing the few configuration setting settings were taken care of such as Enabling coverage and setting Coverage metrics to MCDC.
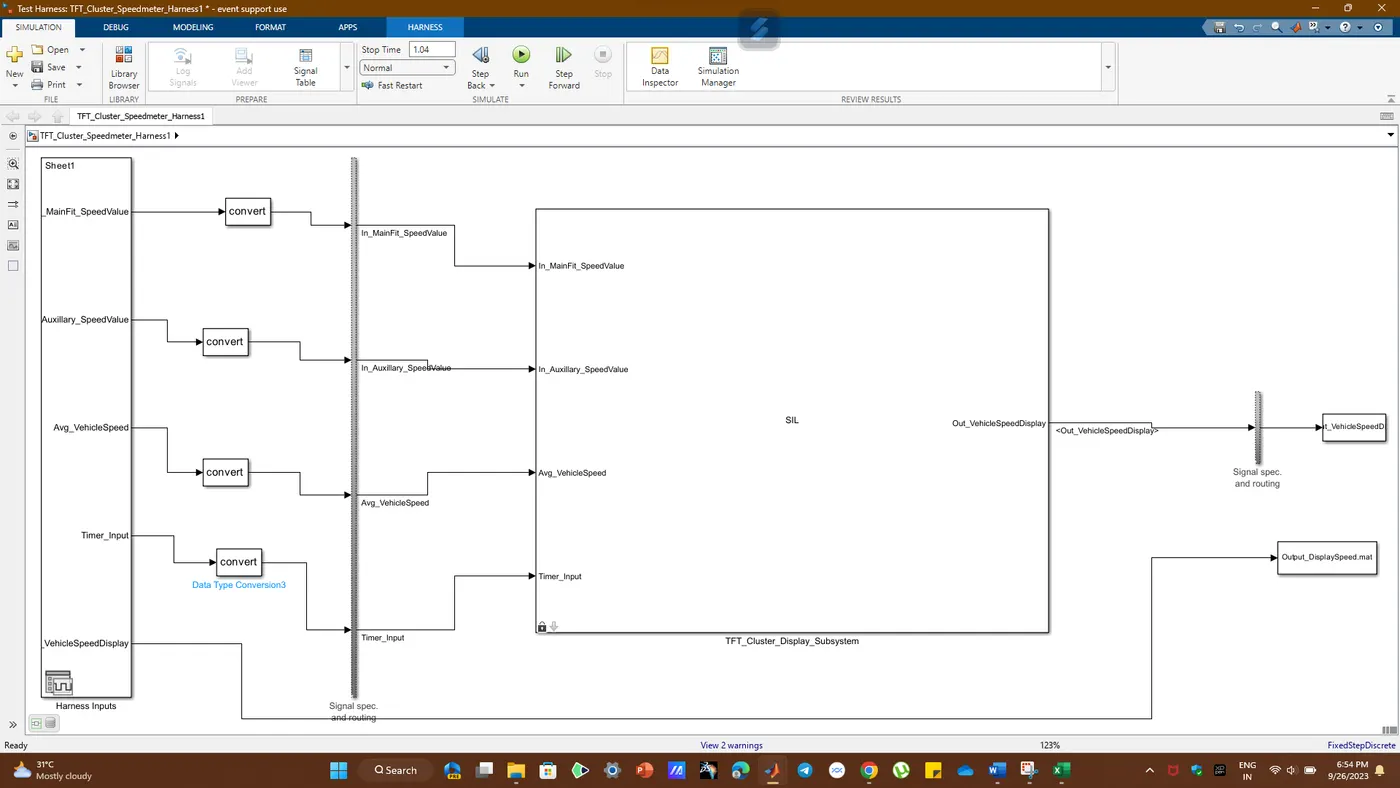
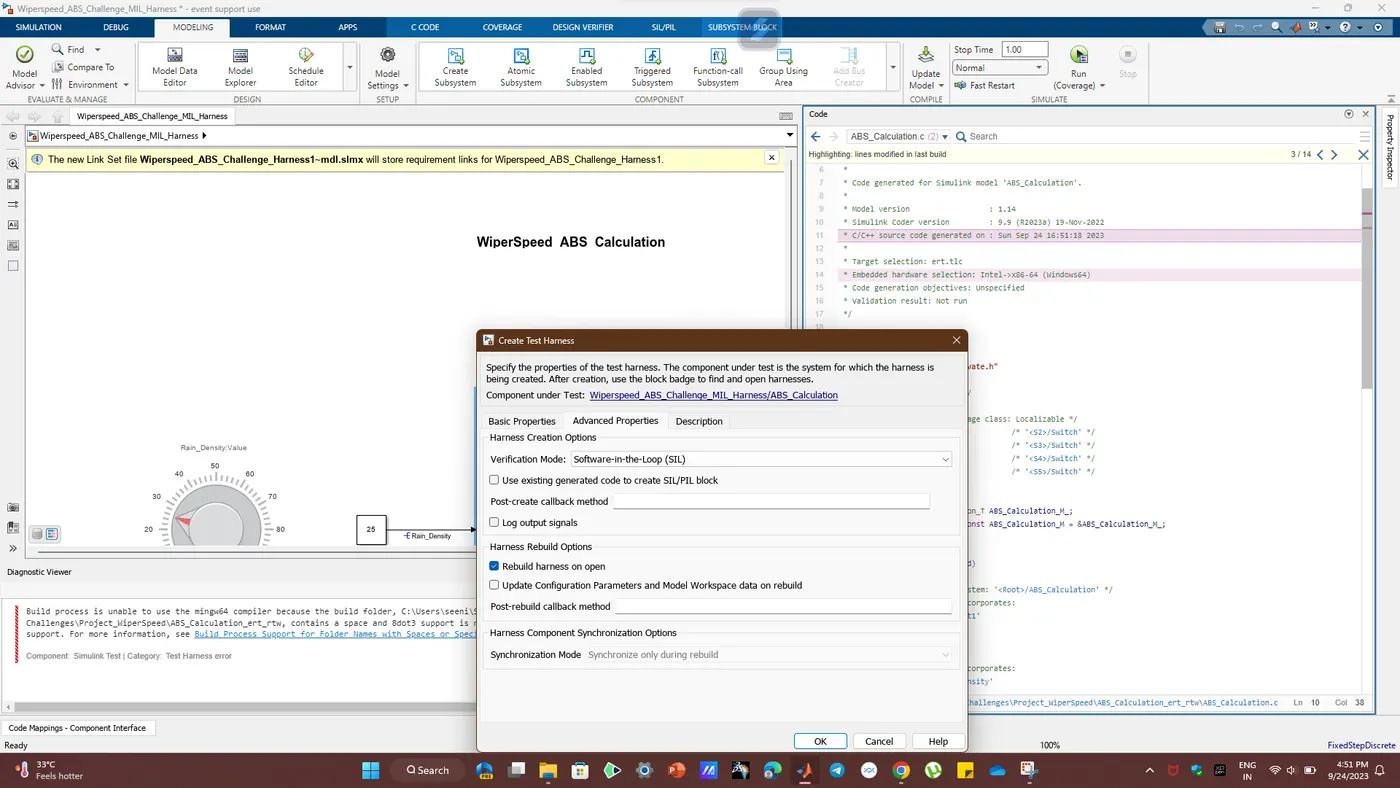
Now to test the model first we need a test harness. The test harness can be created by right clicking on the top level subsystem and selecting ‘Test Harness ’ from the context menu. This opens a dialogue box, where we can select the input and output of the component or model under test. Here we have selected signal builder for input and to workspace block for the output. The figure below shows the dialogue box parameters used-
This data is then imported to the signal builder using the import form file option. Both the calculated output and the model output is send to workspace using ‘To Workspace’ block. These two workspace variables will be compared after the test.
So,the final model of the harness looks like the fig. below-
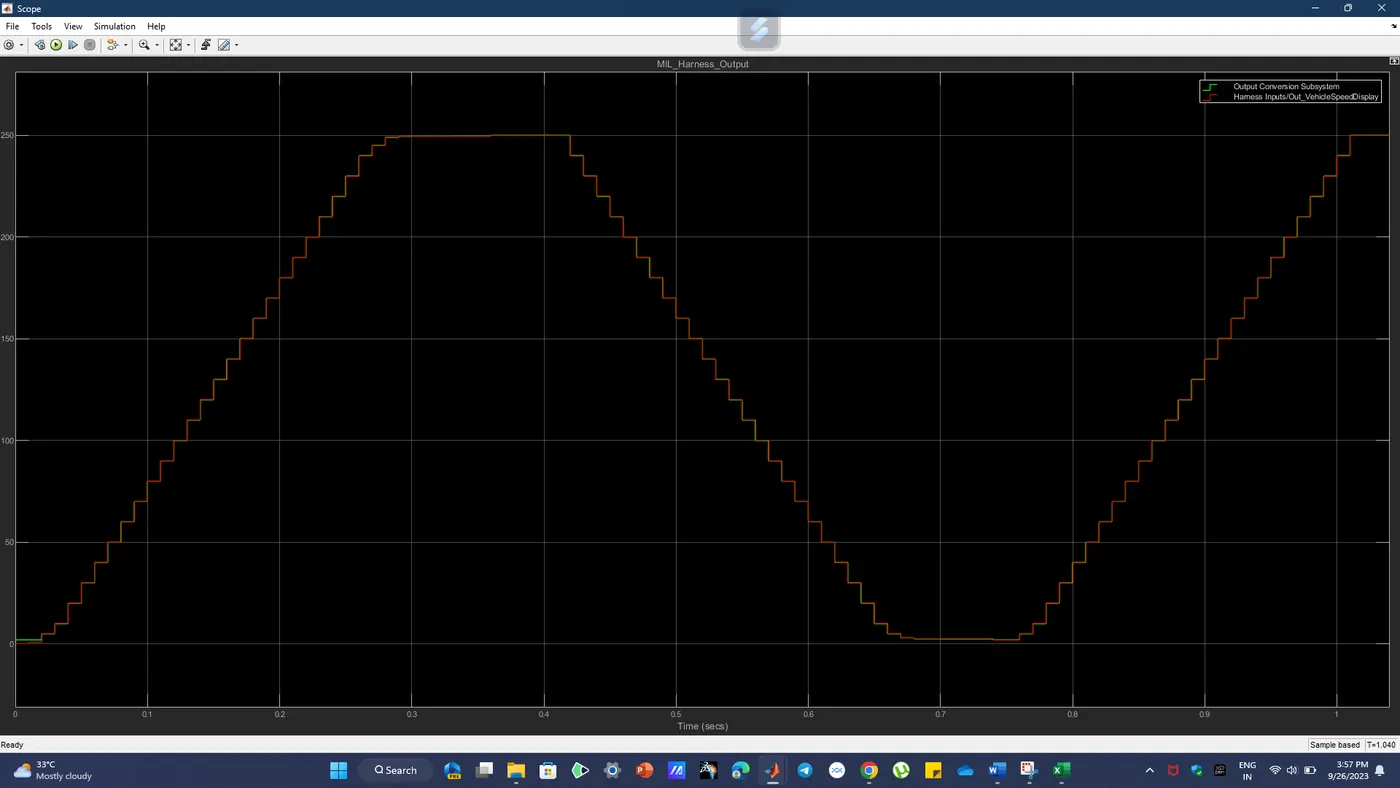
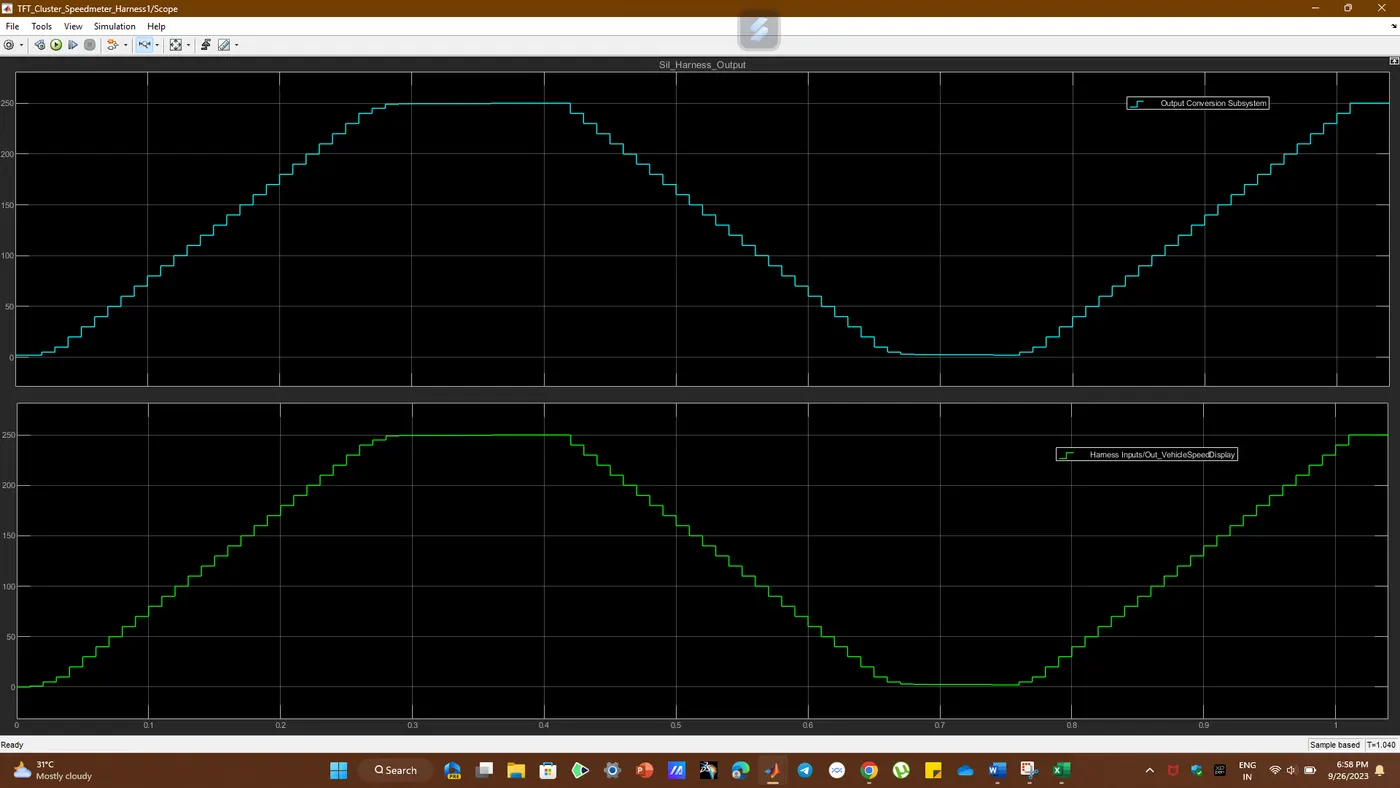
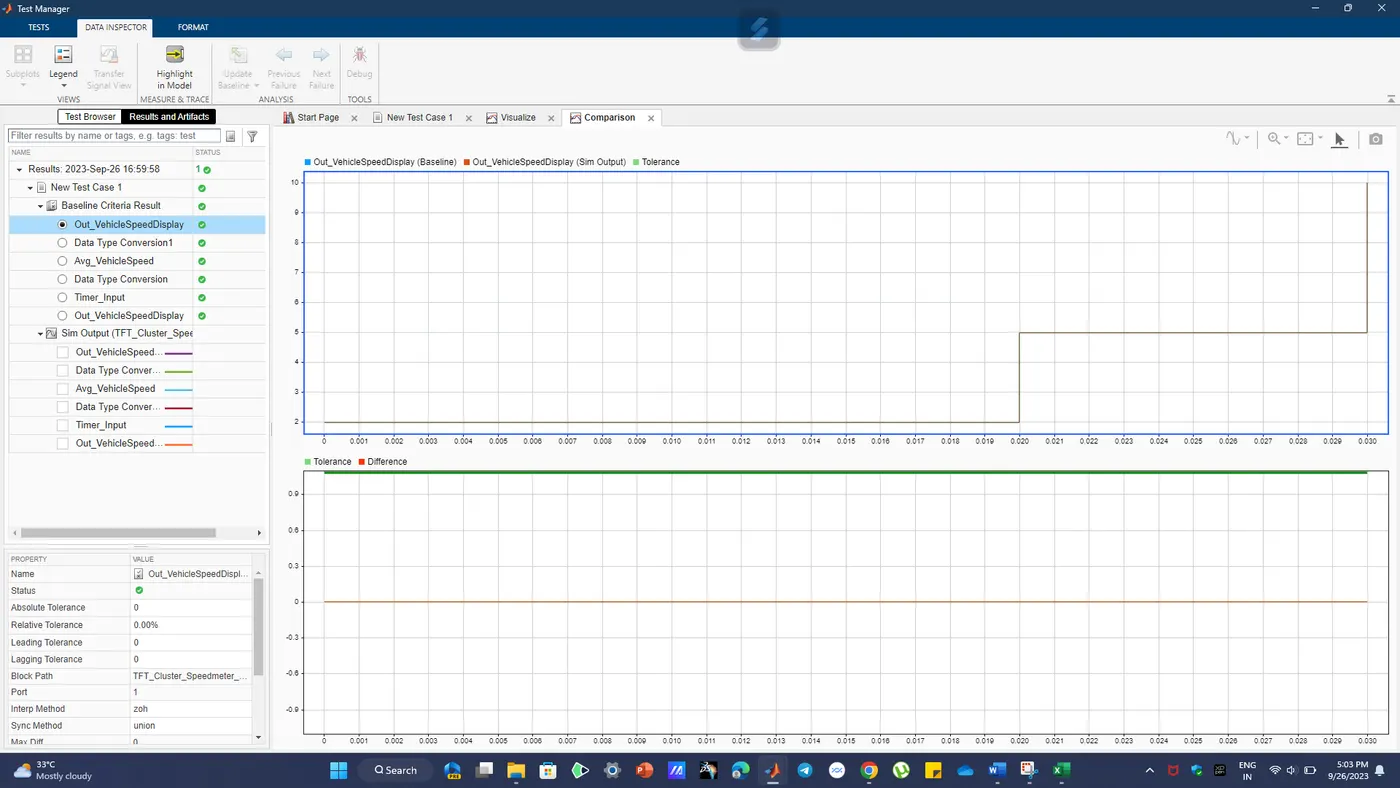
The model is then run for the total time of 1 sec with fixed step(discrete) solver with sample time of 0.01 sec. The output from test is then compared with the calculated value using the data inspector tool.
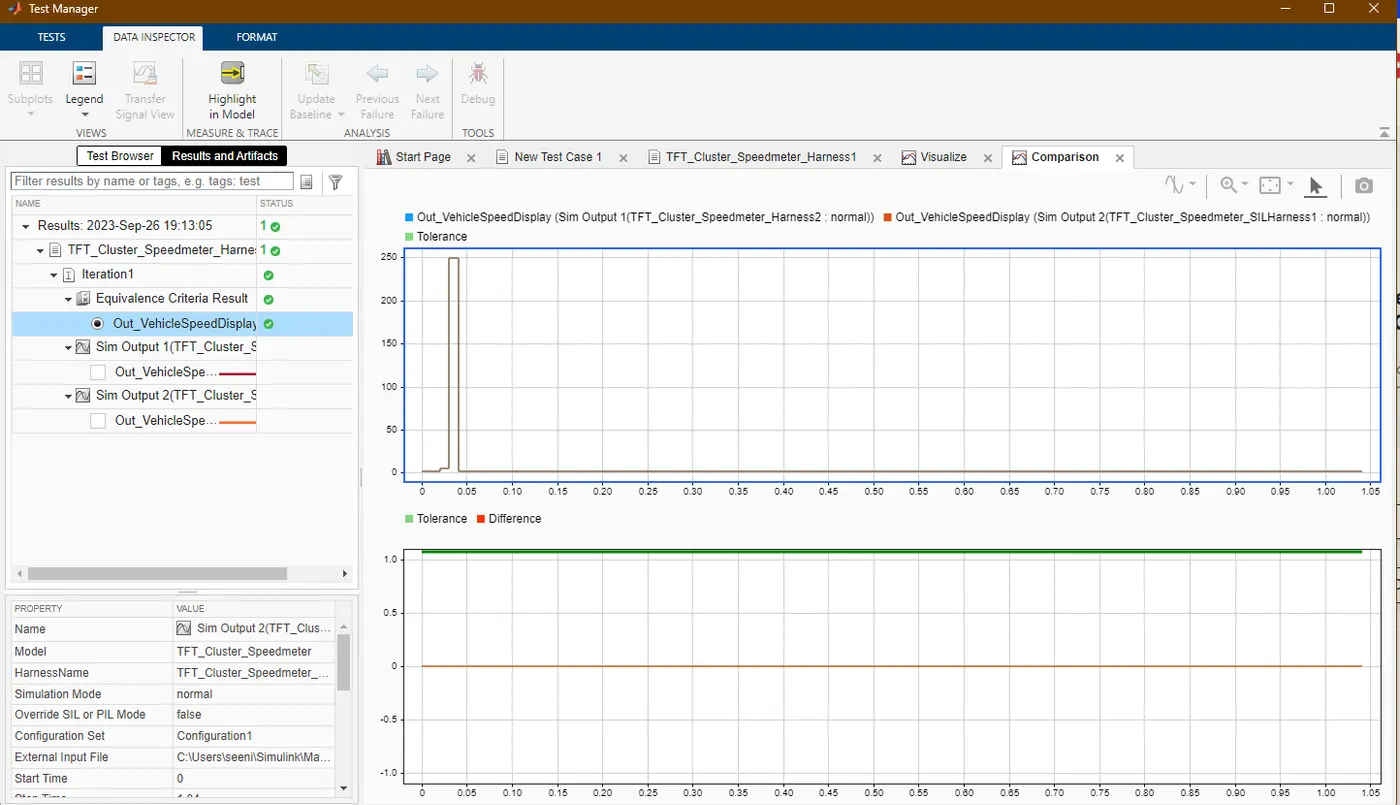
After we have run the model, the here is the comparison graph-
SIL Harnesses and Output:
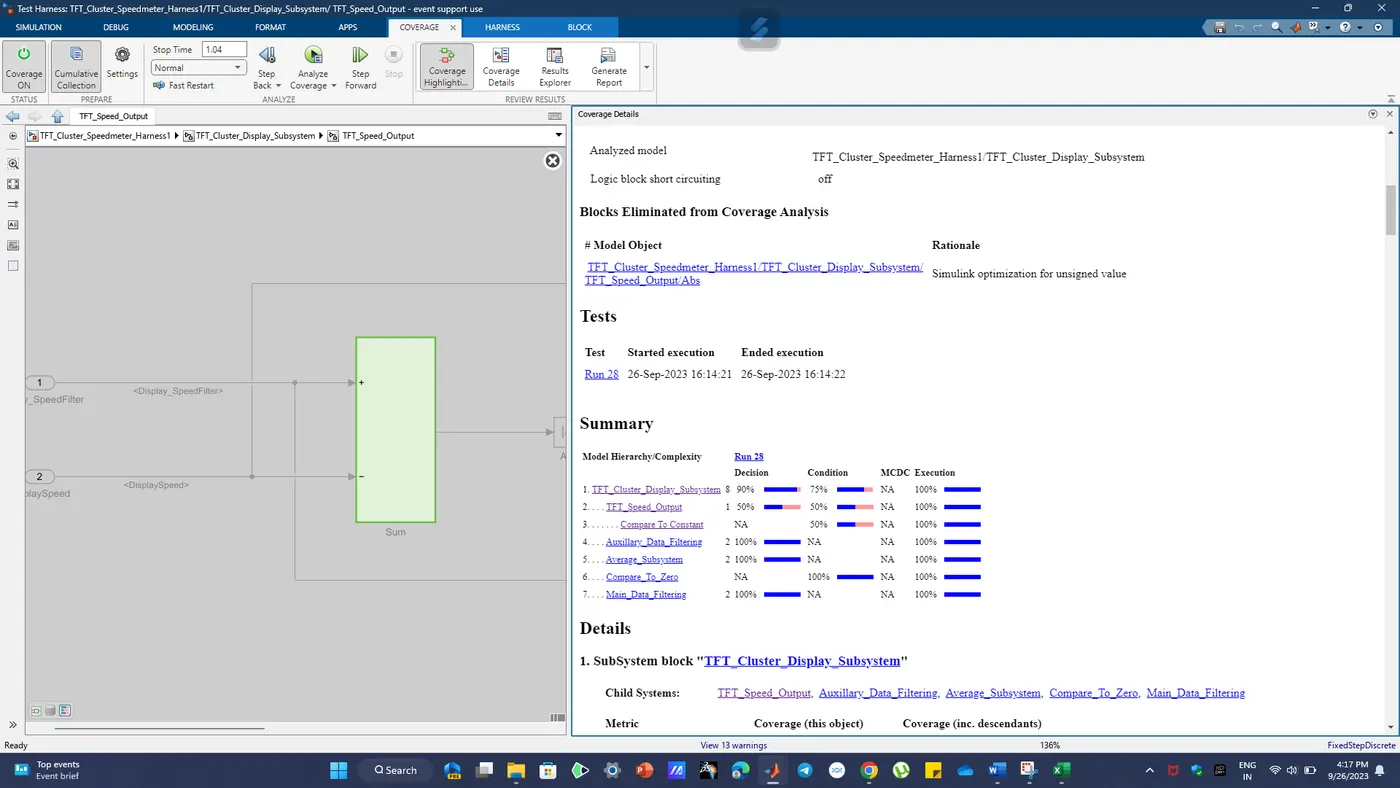
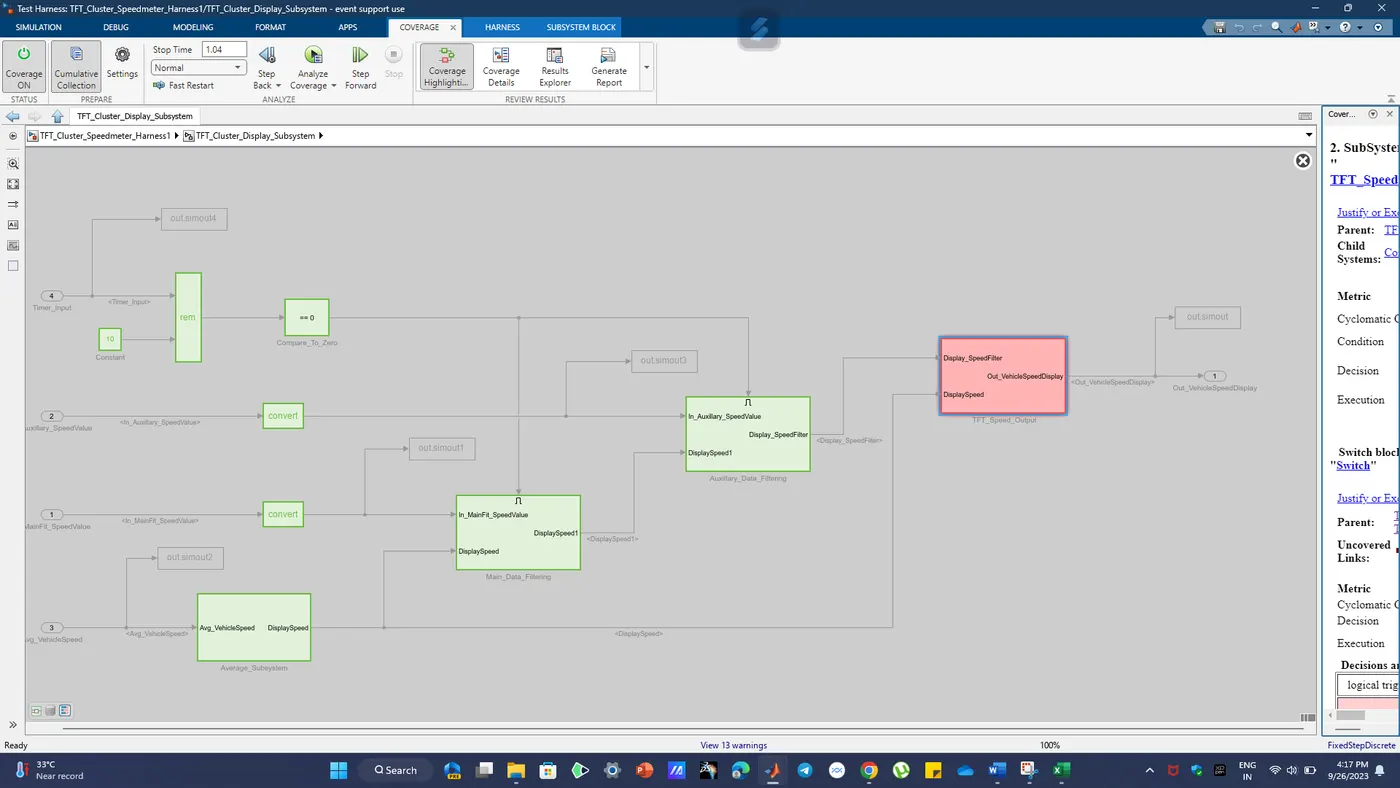
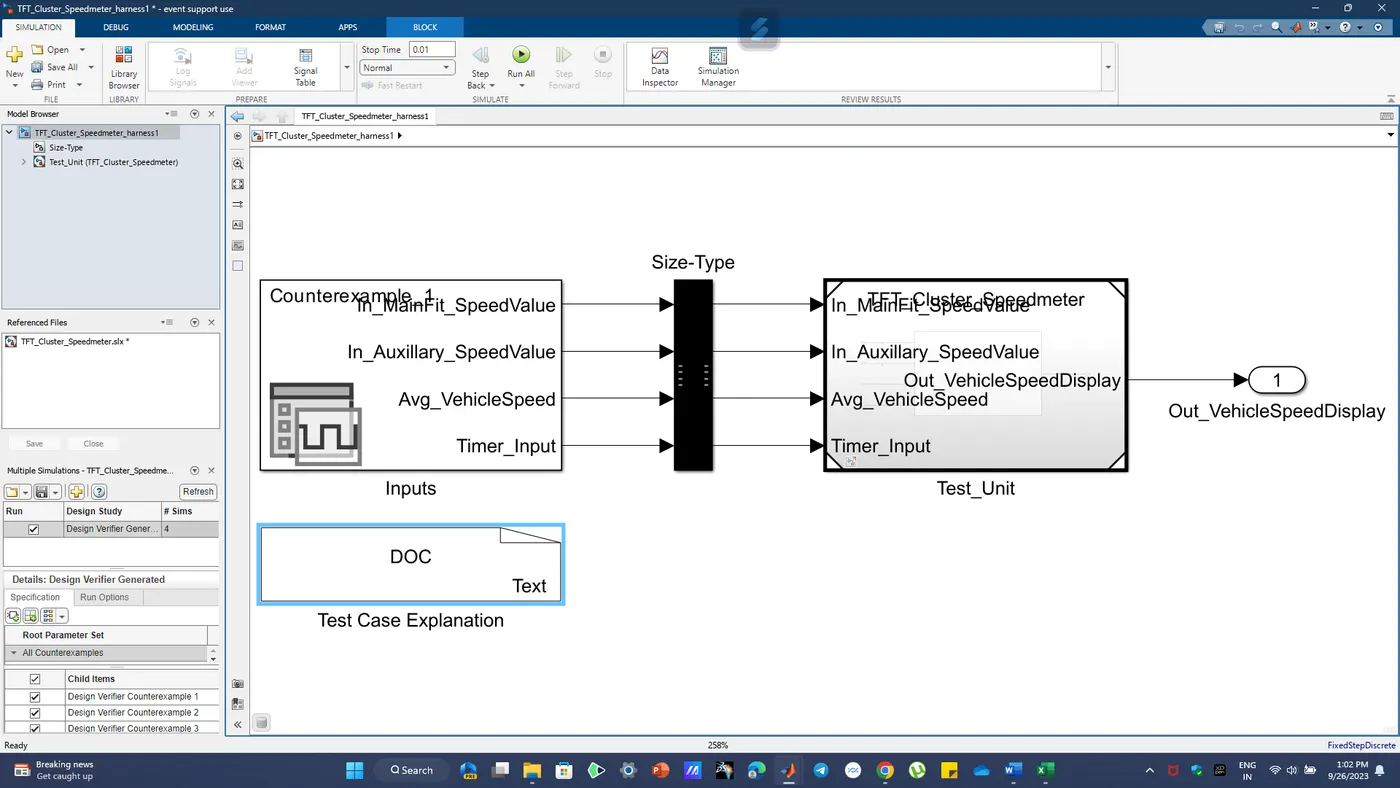
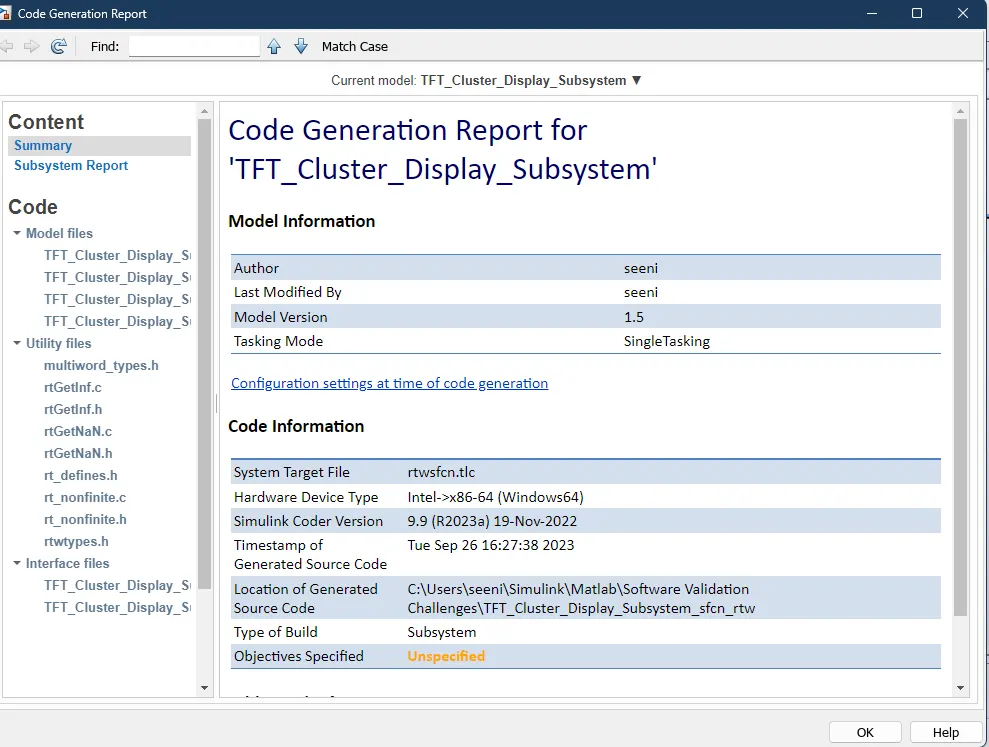
C code:
/*
 * Event Support License -- for demonstration use and event support.  Not
 * for government, research, commercial, or other organizational use.
 *
 * File: ert_main.c
 *
 * Code generated for Simulink model 'TFT_Cluster_Display_Subsystem'.
 *
 * Model version                  : 1.27
 * Simulink Coder version         : 9.9 (R2023a) 19-Nov-2022
 * C/C++ source code generated on : Tue Sep 26 18:48:47 2023
 *
 * Target selection: ert.tlc
 * Embedded hardware selection: Intel->x86-64 (Windows64)
 * Code generation objectives: Unspecified
 * Validation result: Not run
 */

#include
#include             /* This example main program uses printf/fflush */
#include "TFT_Cluster_Display_Subsystem.h" /* Model header file */

/*
 * Associating rt_OneStep with a real-time clock or interrupt service routine
 * is what makes the generated code "real-time".  The function rt_OneStep is
 * always associated with the base rate of the model.  Subrates are managed
 * by the base rate from inside the generated code.  Enabling/disabling
 * interrupts and floating point context switches are target specific.  This
 * example code indicates where these should take place relative to executing
 * the generated code step function.  Overrun behavior should be tailored to
 * your application needs.  This example simply sets an error status in the
 * real-time model and returns from rt_OneStep.
 */
void rt_OneStep(void);
void rt_OneStep(void)
{
  static boolean_T OverrunFlag = false;

  /* Disable interrupts here */

  /* Check for overrun */
  if (OverrunFlag) {
    rtmSetErrorStatus(TFT_Cluster_Display_Subsyste_M, "Overrun");
    return;
  }

  OverrunFlag = true;

  /* Save FPU context here (if necessary) */
  /* Re-enable timer or interrupt here */
  /* Set model inputs here */

  /* Step the model */
  TFT_Cluster_Display_Subsystem_step();

  /* Get model outputs here */

  /* Indicate task complete */
  OverrunFlag = false;

  /* Disable interrupts here */
  /* Restore FPU context here (if necessary) */
  /* Enable interrupts here */
}

/*
 * The example main function illustrates what is required by your
 * application code to initialize, execute, and terminate the generated code.
 * Attaching rt_OneStep to a real-time clock is target specific. This example
 * illustrates how you do this relative to initializing the model.
 */
int_T main(int_T argc, const char *argv[])
{
  /* Unused arguments */
  (void)(argc);
  (void)(argv);

  /* Initialize model */
  TFT_Cluster_Display_Subsystem_initialize();

  /* Attach rt_OneStep to a timer or interrupt service routine with
   * period 0.01 seconds (base rate of the model) here.
   * The call syntax for rt_OneStep is
   *
   *  rt_OneStep();
   */
  printf("Warning: The simulation will run forever. "
has popup
POLYSPACE BUG FINDER:
Creating a detailed report for Polyspace Bug Finder and Polyspace Provision Model involves documenting the static code analysis process and the findings in a structured manner. Below is a comprehensive guide on how to create such a report:
1. Executive Summary:
Provide a concise overview of the analysis and its outcomes. Mention the critical findings and recommendations at a high level.
2. Introduction:
Explain the purpose of the report, the scope of the analysis, and any specific goals or objectives.
3. Static Analysis Configuration:
Detail the settings and configurations used for the static analysis, including the Polyspace version, analysis mode (e.g., bug finder, provision model), analysis options, and any specific rule sets applied.
4. Code Base Information:
Provide information about the codebase under analysis, including the programming language, size, and complexity. Mention any third party libraries or components.
5. Analysis Results:
Bug Finder Analysis:
Describe the findings related to coding errors, vulnerabilities, and potential issues. Include the number of bugs found, their severity levels, and code snippets for each bug. Classify bugs by type (e.g., buffer overflows, null pointer dereferences).
Mention any false positives and false negatives and how they were addressed.
Provision Model Analysis:
Explain the findings related to code coverage and traceability. Include metrics such as statement coverage, decision coverage, and modified code.
Highlight areas of the codebase that are not covered by the analysis.
6. Summary of Findings:
Bugs and Code Violations:
Present a summary table or chart showing the types and distribution of bugs found.
Include statistics on bug severity levels.
Coverage Metrics:
Provide coverage metrics for both Bug Finder and Provision Model analyses.
Include coverage trends if multiple analysis iterations were performed.
7. Recommendations and Action Plan:
- Suggest corrective actions for addressing identified bugs and code violations.
- Recommend strategies for improving code coverage.
- Provide a timeline and responsible parties for implementing the recommendations.
8. Conclusion:
Summarize the key takeaways from the analysis, reiterate the importance of addressing the findings, and emphasize the role of static analysis in software quality assurance.
9. Appendices:
Include any supplementary information such as detailed bug reports, code snippets, configuration files, or additional data used in the analysis.
Throughout the report, use clear and concise language. Include visual elements such as tables, charts, and graphs to enhance understanding. Make sure to document the steps taken during the analysis, including any challenges faced and how they were resolved.
Finally, ensure that the report is reviewed and approved by relevant stakeholders, and that any sensitive information is handled appropriately to maintain security and confidentiality.
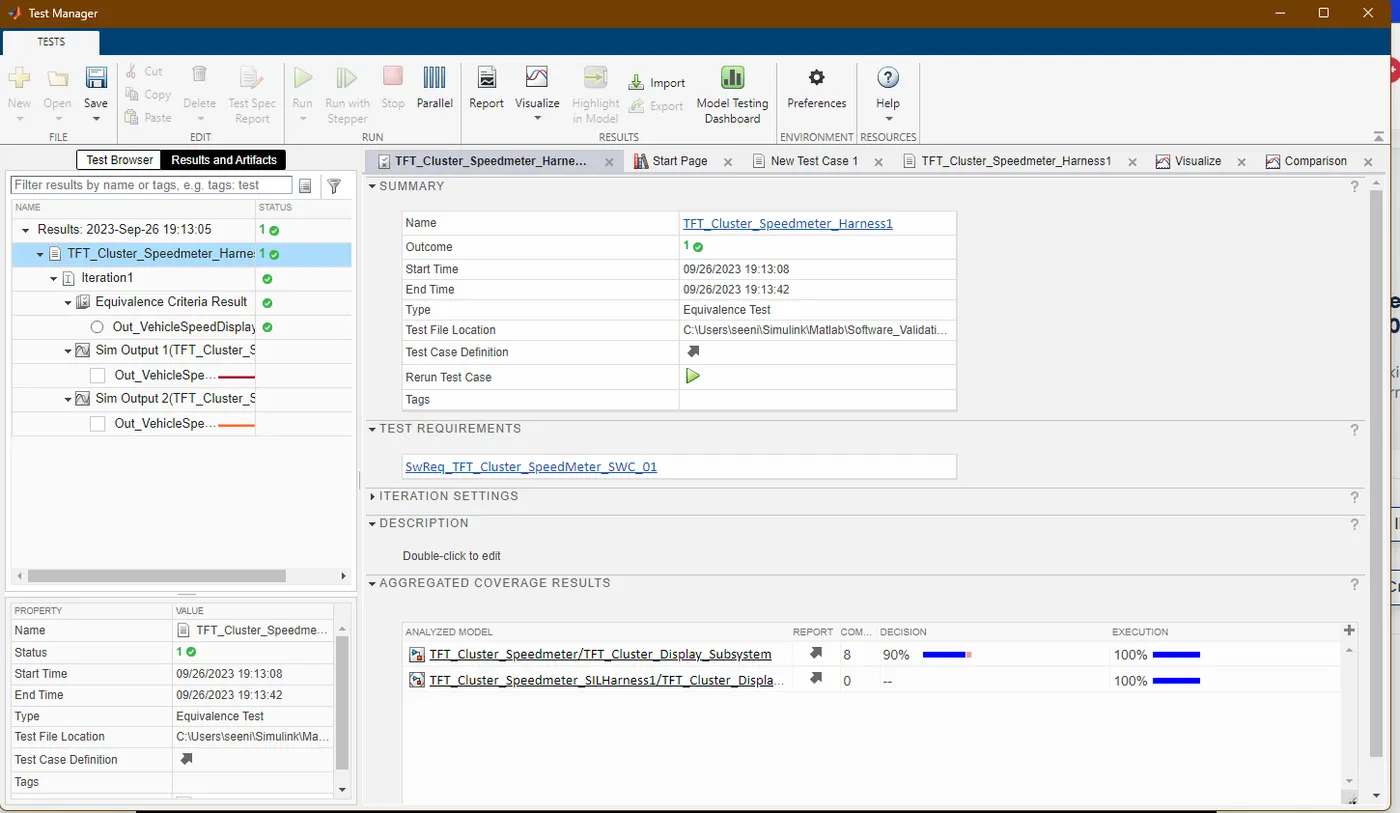
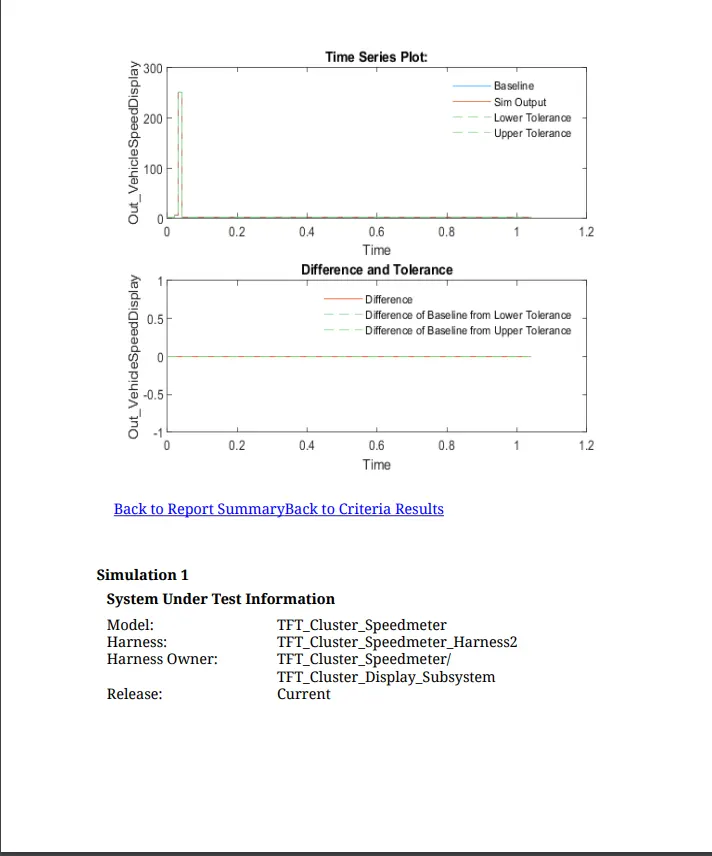
TestManager Report and Back to Back Testing:
Output Image: