Week 6 - Data analysis
Week 6 - Data analysis:
Aim:
- We need to visualize the data.
- We need to do compatibility check.
- we need to do Basic performance calculation.
Data Visualizer:
Introduction:
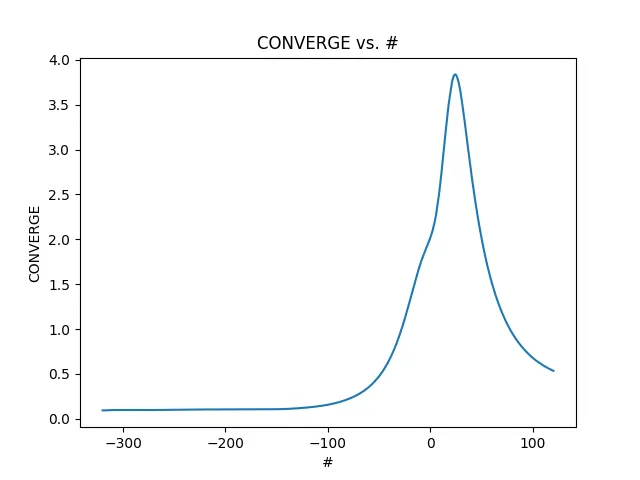
The Data Visualizer module is designed to facilitate the visualization of data stored in a file. It offers the flexibility to select specific columns from the data and plot them as separate graphs. This module is particularly useful for exploring relationships between different variables in the dataset and gaining insights through visual analysis.
Functionality:
Extract Labels: It extracts column labels from the provided data file, allowing for meaningful labeling of the axes in the plots.
Plot Columns: It plots selected columns from the data file against each other, generating separate graphs for each column combination.
Save Plots: It saves each generated plot as an image file with a filename based on the column labels.
Usage:
- Researchers and analysts can utilize this module to visualize experimental or simulation data, aiding in the interpretation and communication of results.
- Engineers and scientists can explore trends and patterns in datasets to identify correlations and anomalies, informing further investigation or decision-making processes.
Python Program for Data visualization:
import matplotlib.pyplot as plt
import numpy as np

def extract_labels(file_path):
    with open(file_path, 'r') as file:
        labels = file.readline().strip().split()
    return labels

def plot_column(file_path, col_numbers):
    labels = extract_labels(file_path)
    data = np.loadtxt(file_path, skiprows=1)

    for col_num in col_numbers:
        if col_num > len(labels) or col_num < 1:
            print(f"Column number {col_num} is out of range. Please provide a valid column number.")
            continue

        plt.figure()
        plt.plot(data[:, 0], data[:, col_num - 1])
        plt.xlabel(labels[0])
        plt.ylabel(labels[col_num - 1])
        plt.title(f"{labels[col_num - 1]} vs. {labels[0]}")
        plt.savefig(f"{labels[col_num - 1]}.png")
        plt.show()

if __name__ == "__main__":
    file_path = "D:/skill lync/Python for mechanical engg/week 6/engine_data.out"
    columns = input("Enter column numbers separated by space: ").split()
    columns = [int(col) for col in columns]
    plot_column(file_path, columns)
Output:
Enter column numbers separated by space: 2
Code line by line explanation:
import matplotlib.pyplot as plt import numpy as np
- import matplotlib.pyplot as plt: Imports the pyplot module from the matplotlib library, allowing us to create plots.
- import numpy as np: Imports the NumPy library, which provides support for large, multi-dimensional arrays and matrices, along with a collection of mathematical functions.
def extract_labels(file_path): with open(file_path, 'r') as file: labels = file.readline().strip().split() return labels
- def extract_labels(file_path): Defines a function called extract_labels that takes a file path as input.
- with open(file_path, 'r') as file:: Opens the file specified by file_path in read mode ('r') and assigns it to the variable file. The with statement ensures that the file is properly closed after use.
- labels = file.readline().strip().split(): Reads the first line of the file, strips any leading/trailing whitespace, and splits it into a list of strings based on whitespace.
- return labels: Returns the list of labels extracted from the file.
def plot_column(file_path, col_numbers): labels = extract_labels(file_path) data = np.loadtxt(file_path, skiprows=1)
- def plot_column(file_path, col_numbers):: Defines a function called plot_column that takes a file path and a list of column numbers as input.
- labels = extract_labels(file_path): Calls the extract_labels function to extract the column labels from the file specified by file_path.
- data = np.loadtxt(file_path, skiprows=1): Loads data from the file specified by file_path into a NumPy array, skipping the first row (assuming it contains column labels).
for col_num in col_numbers: if col_num > len(labels) or col_num < 1: print(f"Column number {col_num} is out of range. Please provide a valid column number.") continue plt.figure() plt.plot(data[:, 0], data[:, col_num - 1]) plt.xlabel(labels[0]) plt.ylabel(labels[col_num - 1]) plt.title(f"{labels[col_num - 1]} vs. {labels[0]}") plt.savefig(f"{labels[col_num - 1]}.png") plt.show()
- for col_num in col_numbers:: Iterates through each column number provided in the col_numbers list.
- if col_num > len(labels) or col_num < 1:: Checks if the column number is within the range of available columns. If not, prints an error message and skips to the next column.
- plt.figure(): Creates a new figure for the plot.
- plt.plot(data[:, 0], data[:, col_num - 1]): Plots the data from the first column (x-axis) against the selected column (y-axis).
- plt.xlabel(labels[0]): Sets the x-axis label using the first label extracted from the file.
- plt.ylabel(labels[col_num - 1]): Sets the y-axis label using the corresponding label for the selected column.
- plt.title(f"{labels[col_num - 1]} vs. {labels[0]}"): Sets the title of the plot based on the selected column and the first column.
- plt.savefig(f"{labels[col_num - 1]}.png"): Saves the plot as an image file with a filename based on the selected column.
- plt.show(): Displays the plot.
Compatibility Check
Introduction:
The Compatibility Check module verifies the compatibility of a specified file with the program's requirements. It ensures that the file exists and is accessible, providing feedback to the user regarding its suitability for processing.
Functionality:
- File Existence Check: It checks if the specified file exists in the specified location.
- Feedback: It provides feedback to the user, indicating whether the file is compatible or not.
Usage:
- Prior to processing data, users can employ this module to confirm the availability and accessibility of the input file.
- Developers can integrate this module into data processing pipelines to handle potential file-related errors gracefully, enhancing the robustness and reliability of their applications.
Python code for Compatibity check:
import os

def check_compatibility(file_path):
    if not os.path.isfile(file_path):
        print("File not found. Please provide a valid file path.")
    else:
        print("File is compatible.")

if __name__ == "__main__":
    file_path = "D:/skill lync/Python for mechanical engg/week 6/engine_data.out"
    check_compatibility(file_path)
Output:
File is compatible.
Code line by line explanation:
import os
import os: Imports the os module, which provides functions for interacting with the operating system.
def check_compatibility(file_path): if not os.path.isfile(file_path): print("File not found. Please provide a valid file path.") else: print("File is compatible.")
- def check_compatibility(file_path):: Defines a function called check_compatibility that takes a file path as input.
- if not os.path.isfile(file_path):: Checks if the file specified by file_path exists. If it doesn't, prints an error message.
- print("File is compatible."): Prints a message indicating that the file is compatible if it exists.
Basic Performance Calculation
Introduction:
The Basic Performance Calculation module computes fundamental metrics related to the performance of an engine based on data provided in a file. It offers insights into the efficiency and characteristics of the engine under consideration.
Functionality:
Data Extraction: It extracts relevant data from the file, such as pressure and volume values, necessary for performance calculations.
Performance Metrics Calculation: It computes key performance metrics, including the area under the pressure-volume (P-V) diagram, power output of the engine, and specific fuel consumption.
Output: It presents the calculated metrics to the user, facilitating analysis and comparison.
Usage:
- Engineers and researchers can employ this module to evaluate the performance of engines or systems based on experimental or simulation data.
- Automotive industry professionals can utilize the calculated metrics to assess the efficiency and environmental impact of different engine configurations or operating conditions.
Python coding for Basic performance calculation:
import numpy as np

def calculate_performance(file_path):
    data = np.loadtxt(file_path, skiprows=1)
    pressure = data[:, 1]  # Pressure column
    volume = data[:, 7]    # Volume column
    rpm = 1500             # RPM assumption

    # Calculate area under the P-V diagram
    area = np.trapz(pressure, volume)

    # Calculate power output
    power_output = np.max(pressure) * np.max(volume) * rpm * 2 * np.pi / 60000  # in kW

    # Calculate specific fuel consumption
    fuel_consumed = 20e-6  # in grams
    specific_fuel_consumption = fuel_consumed / (area / 1e6)  # in g/kWh

    return area, power_output, specific_fuel_consumption

if __name__ == "__main__":
    file_path = "D:/skill lync/Python for mechanical engg/week 6/engine_data.out"
    area, power_output, specific_fuel_consumption = calculate_performance(file_path)
    print("Area under the P-V diagram:", area)
    print("Power output of the engine:", power_output, "kW")
    print("Specific fuel consumption:", specific_fuel_consumption, "g/kWh")
Output:

Code line by line explanation:
import numpy as np
import numpy as np: Imports the NumPy library, which provides support for large, multi-dimensional arrays and matrices, along with a collection of mathematical functions.
def calculate_performance(file_path): data = np.loadtxt(file_path, skiprows=1) pressure = data[:, 1] # Pressure column volume = data[:, 7] # Volume column rpm = 1500 # RPM assumption # Calculate area under the P-V diagram area = np.trapz(pressure, volume) # Calculate power output power_output = np.max(pressure) * np.max(volume) * rpm * 2 * np.pi / 60000 # in kW # Calculate specific fuel consumption fuel_consumed = 20e-6 # in grams specific_fuel_consumption = fuel_consumed / (area / 1e6) # in g/kWh return area, power_output, specific_fuel_consumption
def calculate_performance(file_path):: Defines a function called calculate_performance that takes a file path as input.
data = np.loadtxt(file_path, skiprows=1): Loads data from the file specified by file_path into a NumPy array, skipping the first row (assuming it contains column labels).
pressure = data[:, 1]: Extracts the pressure column from the data.
volume = data[:, 7]: Extracts the volume column from the data.
rpm = 1500: Assumption for engine RPM.
area = np.trapz(pressure, volume): Calculates the area under the pressure-volume (P-V) diagram using the trapezoidal rule.
power_output = np.max(pressure) * np.max(volume) * rpm * 2 * np.pi / 60000: Calculates the power output of the engine based on the maximum pressure and volume, assuming a constant RPM.
fuel_consumed = 20e-6: Assumption for fuel consumed per stroke cycle (in grams).
specific_fuel_consumption = fuel_consumed / (area / 1e6): Calculates the specific fuel consumption (g/kWh) based on the area under the P-V diagram.
Conclusion:
- Through the development of three distinct modules, this assignment successfully addresses key aspects of data analysis and performance evaluation in mechanical engineering.
- The Data Visualizer module enables interactive exploration of datasets, fostering insights through visual representation of data relationships.
- The Compatibility Check module ensures robustness by verifying file accessibility and compatibility before proceeding with analysis.
- The Basic Performance Calculation module offers fundamental metrics for engine evaluation, enhancing understanding of efficiency and fuel consumption.
- Together, these modules provide a comprehensive toolkit for researchers, engineers, and analysts to streamline data processing and gain valuable insights into mechanical systems.