Project 1 - Parsing NASA thermodynamic data
Project 1 - Parsing NASA thermodynamic data:
Aim:
- To Write a function that extracts the 14 co-efficients and calculates the enthalpy, entropy and specific heats for all the species in the data file. We will be reading this file NASA thermodynamic data by using fopen and fgetl.
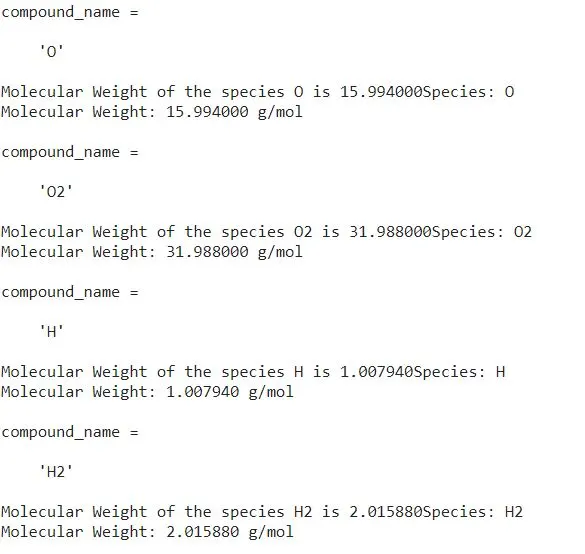
- To Calculate the molecular weight of each species and display it in the command window.
- To Plot the Cp, Enthalpy and Entropy for the local temperature range (low temperature : high temperature) specific for each species.
- To Save the plots as images with appropriate names and dump them in separate folders for each species with suitable name. All these should be generated automatically.
Introduction:
- NASA came up with polynomials that can be used to evaluate thermodynamic properties such as Cp, H, and S. They have also documented the coefficients that are required to evaluate these polynomials for 1000+ species.
- Here R is the universal gas constant, T is the temperature
- We will use these above the Specific Heat, Entropy, Enthalpy as function code in Matlab and used to calculate the above and plot the graph accordingly
- File Parsing is how a piece of file information can be used in a computer program. Read data from external files and databases and include that data into your calculation.
- File Writing - writing data in a particular file
Steps for choosing the logic of code and file parsing :
- Step 1:We open the file and parse the file ,fopen is used to open a file.
- Step 2:To navigate throughout the file and using (fgetl) command to get the line of the file and read the file line by line to get to the desired result.
- Step 3:Reading the text from the header file and read the file line by line
- Step 4:String split command then cell array is generated. A cell array is a special data structure to store data of the different type and perform the desired task
- Step 5:The function for Cp, H, S is created to calculate them by taking the values from the file data
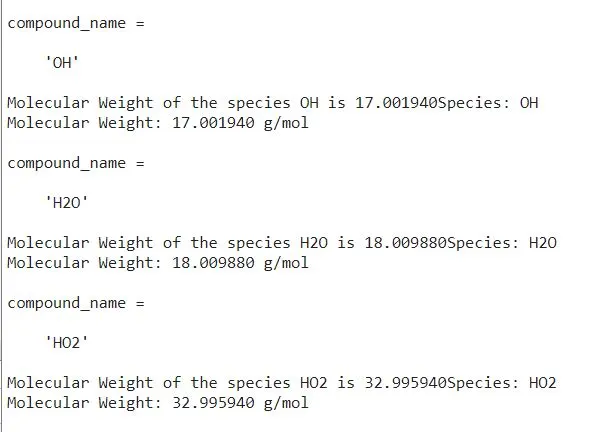
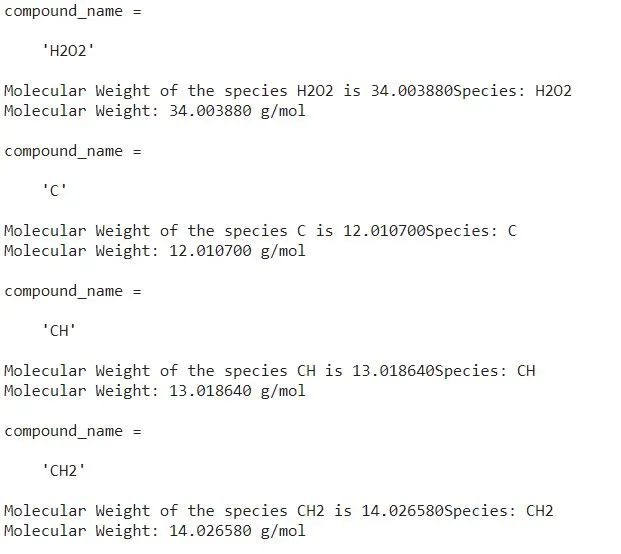
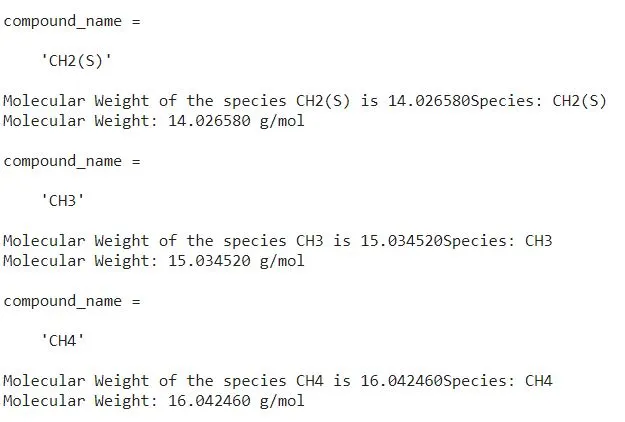
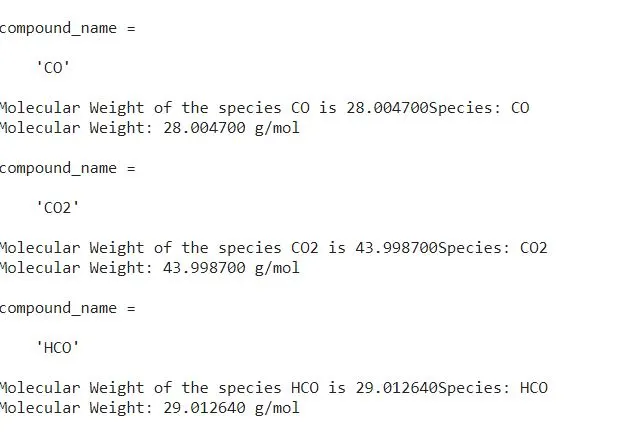
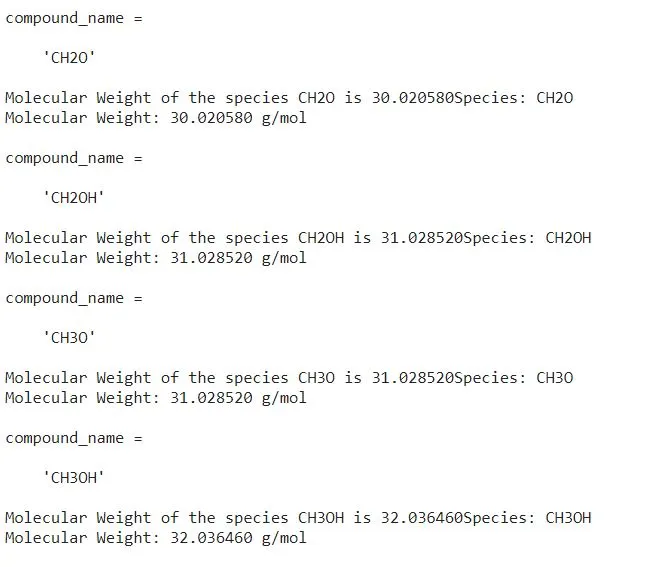
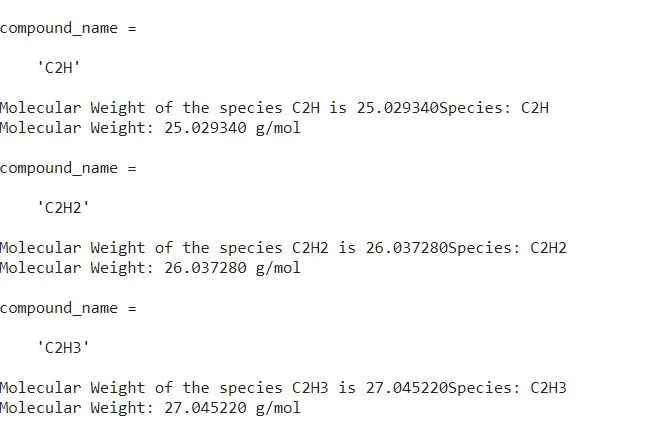
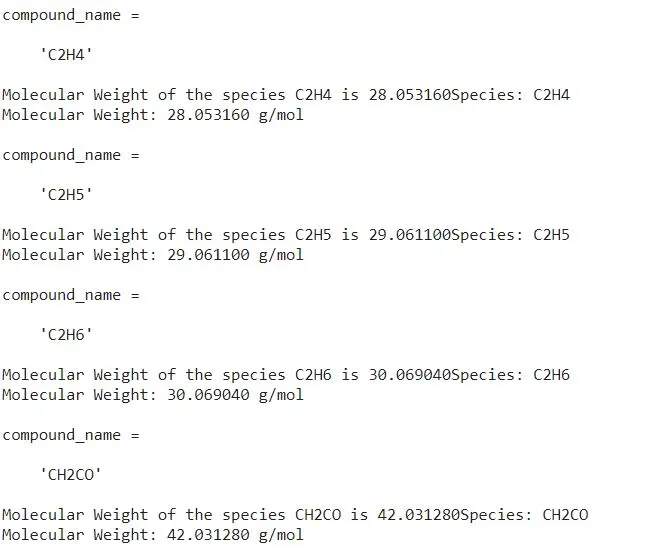
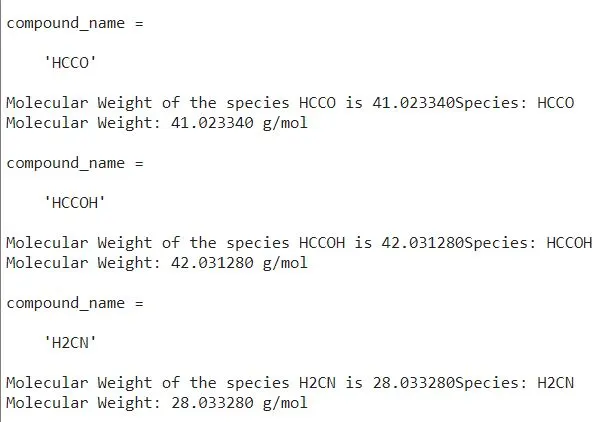
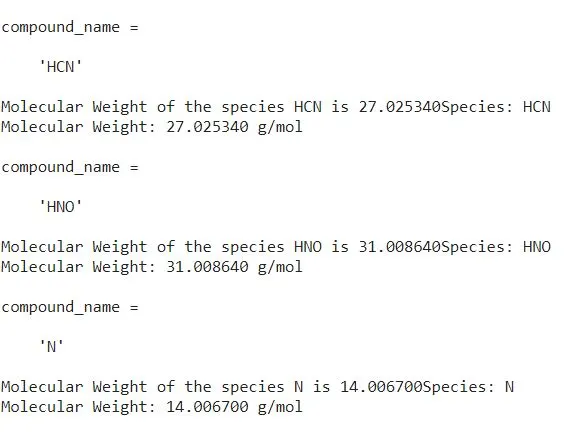
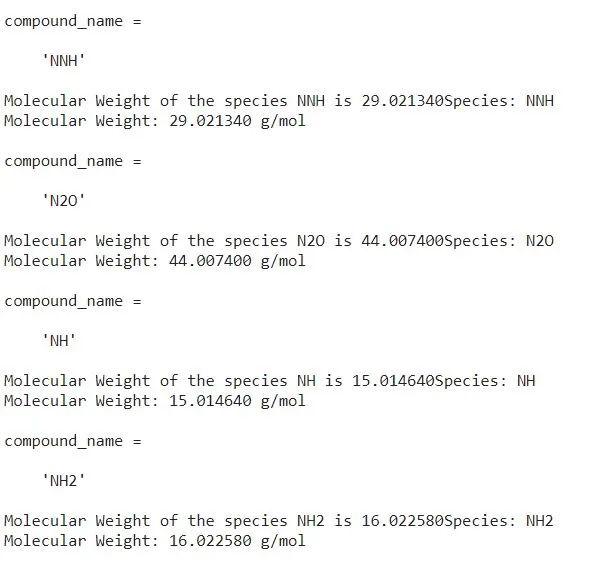
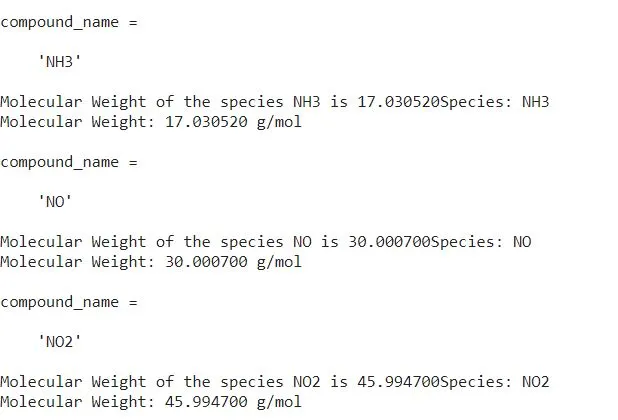
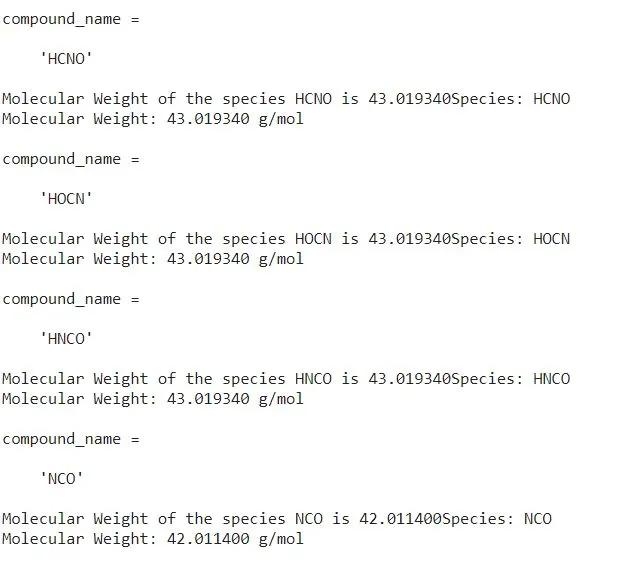
- Step 6:Molecular weight is calculated using the molecular weight function and is printed on the command window
- Step 7:The plots for Cp, H, S are created for each species and saved in a folder in jpg format to access the species with different images
- Step 8:Creating folders for different molecules and save the plots for specific heat, enthalpy, and entropy in that folder and display the molecular weight of different species in the command window
CODE for the functions used in the main program:
Entropy:
- In thermodynamics, entropy is a measure of a system's disorder and how much energy is not available to do work.

Code for Entropy function:
Entropy function explanation:
- First line defines a function named entropy_S that takes various coefficients (x1 to x14), temperature data (Temperature), midpoint temperature (glob_midtemp), and the universal gas constant (R) as inputs and calculates entropy (S).
- This line provides an example of a simple linear interpolation formula.
- It suggests using a linear interpolation between coefficients x6 and x13 based on the temperature (Temperature) and the midpoint temperature (glob_midtemp).
- This is a placeholder and should be replaced with the correct entropy calculation for your system.
Enthalpy:
- In thermodynamics, enthalpy is the sum of a system's internal energy and the product of its pressure and volume. It is a state function that is used in many measurements in chemical, biological, and physical systems.

Code for Enthalpy function:
Enthalpy function Explanation:
- First line defines a function named enthalpy_H that takes various coefficients (x1 to x13), temperature data (Temperature), midpoint temperature (glob_midtemp), and the universal gas constant (R) as inputs and calculates enthalpy (H).
- Formula line provides an example of a simple linear interpolation formula.
- Then it suggests using a linear interpolation between coefficients x5 and x13 based on the temperature (Temperature) and the midpoint temperature (glob_midtemp).
- Then is a placeholder and should be replaced with the correct enthalpy calculation for your system.
Specific Heat (Cp):
In thermodynamics, specific heat (Cp) is the amount of heat required to increase the temperature of a substance by one degree Celsius or Kelvin while keeping the pressure constant.

Code for specific heat function:
- First line defines a function named Specific_heat that takes various coefficients (x1 to x12), temperature data (Temperature), midpoint temperature (glob_midtemp), and the universal gas constant (R) as inputs and calculates specific heat (Cp).
- This line provides an example of a simple linear interpolation formula.
- It suggests using a linear interpolation between coefficients x5 and x11 based on the temperature (Temperature) and the midpoint temperature (glob_midtemp).
- This is a placeholder, and you should replace it with the correct specific heat calculation for your system.
Molecular weight:
- Molecular weight is the sum of the atomic masses of all atoms in a molecule. It is also known as molecular mass or formula mass.
Code for Molecular weight:
- First line defines a function named mol_wt that calculates the molecular weight of a species. The function takes the species name (sp_name) as input and returns the molecular weight (mw).
- Then stores the input species name in the variable compound_name.
- Next creates an array key_at containing elemental symbols like 'C', 'H', 'O', 'N', and 'A'.
- Then creates an array value_at containing corresponding atomic mass values for the elements mentioned in key_at.
- After that initializes the molecular weight (mw) to zero.
- In next lines constitute a nested loop to iterate over each character in the species name. It compares each character with the elemental symbols and adds the corresponding atomic mass to the molecular weight. If a numeric value is found, it calculates the molecular weight considering the count.
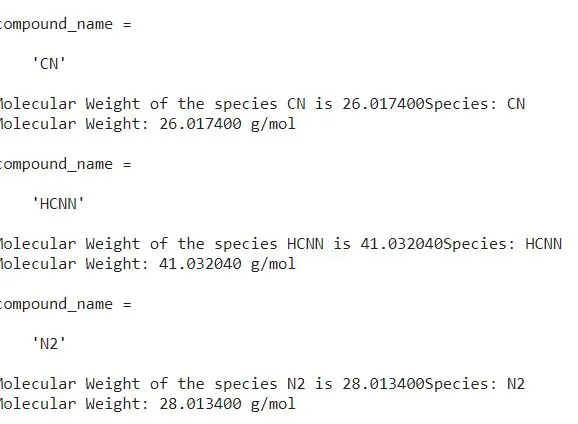
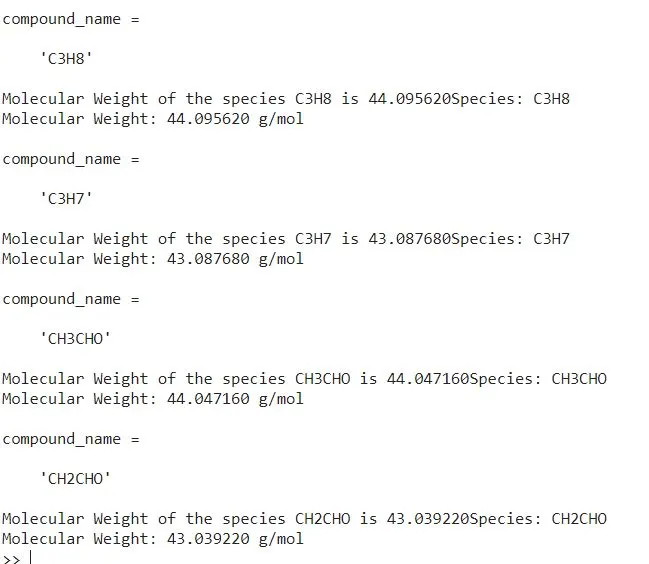
- Then prints the calculated molecular weight for the given species name.
- In summary, this function calculates the molecular weight of a species based on the provided elemental symbols and their atomic masses. The function uses a nested loop to iterate through the species name, compares characters with elemental symbols, and performs the necessary calculations. Finally, it prints the molecular weight for the species.
Main code:
- Open the file 'THERMO.dat' and read its first line.
- Define the universal gas constant, R, with a value of 8.314 J/(mol-K).
- Read the global temperature information from the next line and store the low, mid, and high temperatures.
- Generate an array of 1000 evenly spaced temperature values between the low and high temperatures.
- Skip the next three lines in the file.
- Loop over each of the 53 species in the file.
- Read the species name from the current line.
- Read the coefficients from the next three lines.
- Calculate entropy, specific heat (Cp), enthalpy (H), and molecular weight (mw) for the species.
- Display the species name and its molecular weight with six decimal places.
- Append the molecular weight information to the 'Molecular Weight.txt' file.
- Create a folder for the current species and navigate to it.
- Plot and save three figures (Enthalpy vs. Temperature, Entropy vs. Temperature, Specific Heat vs. Temperature) for the species.
- Move back to the parent directory.
- The plotAndSaveFigures function is defined to handle plotting and saving figures based on the temperature, enthalpy, entropy, specific heat, and species name.
Output:
Here Im using Matlab online so,
File location:
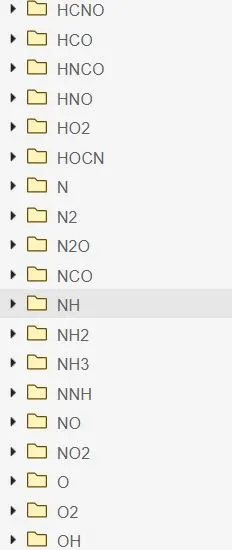
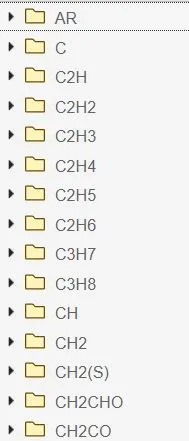
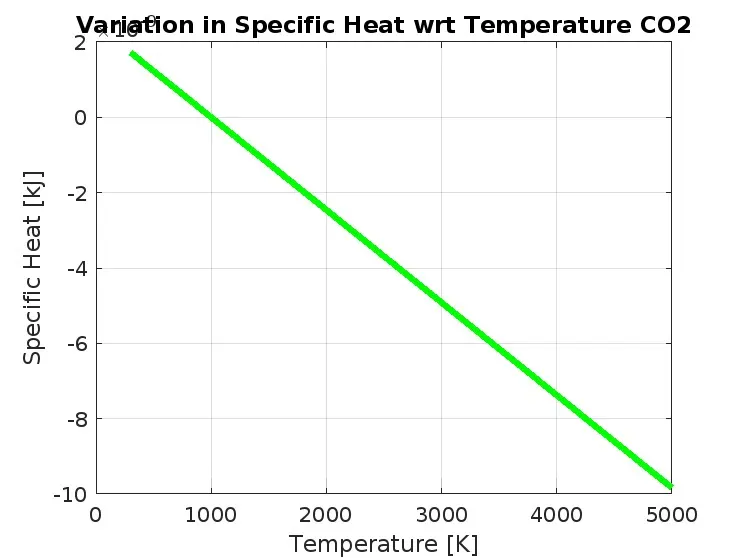
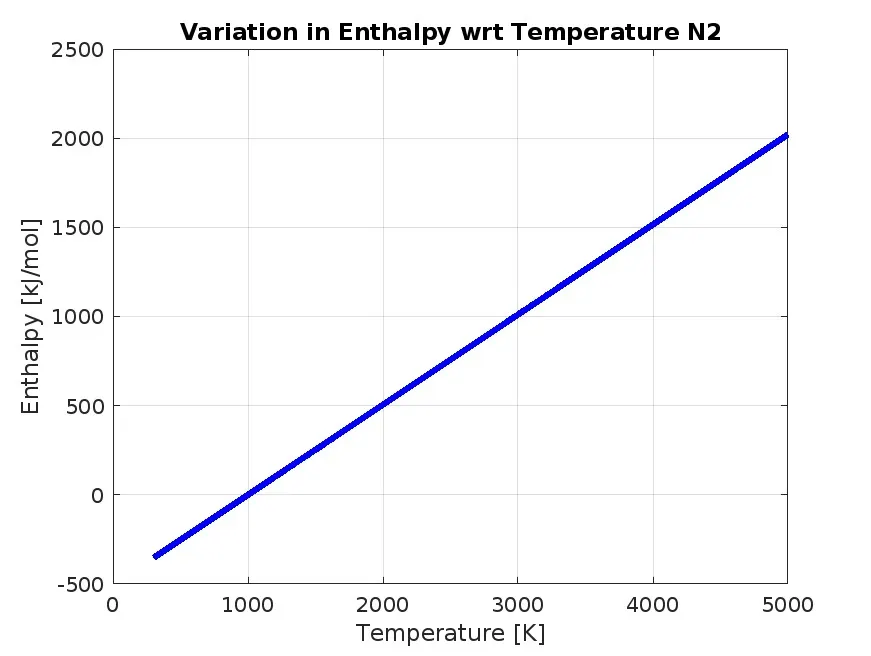
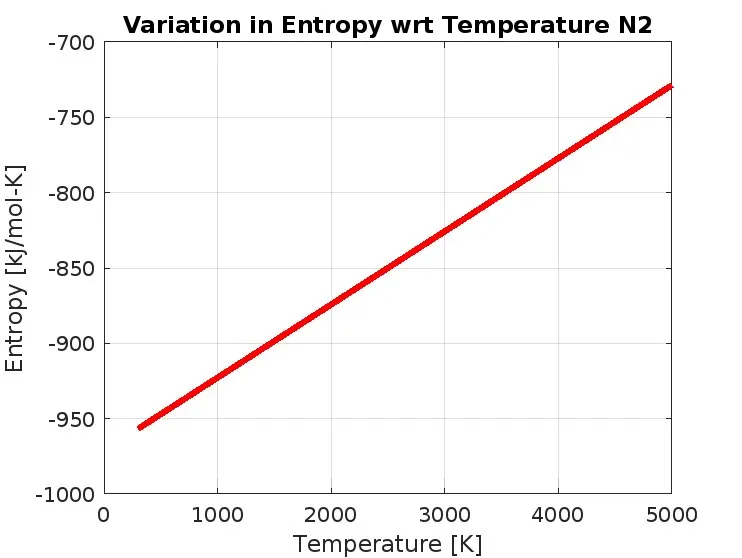
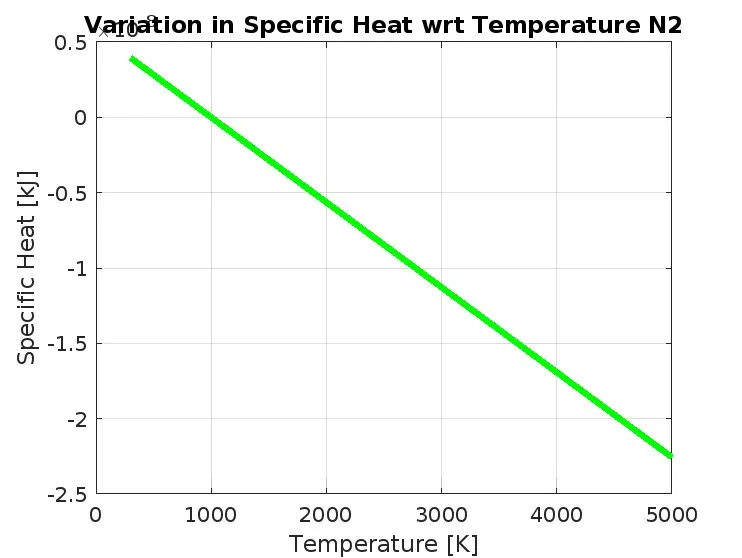
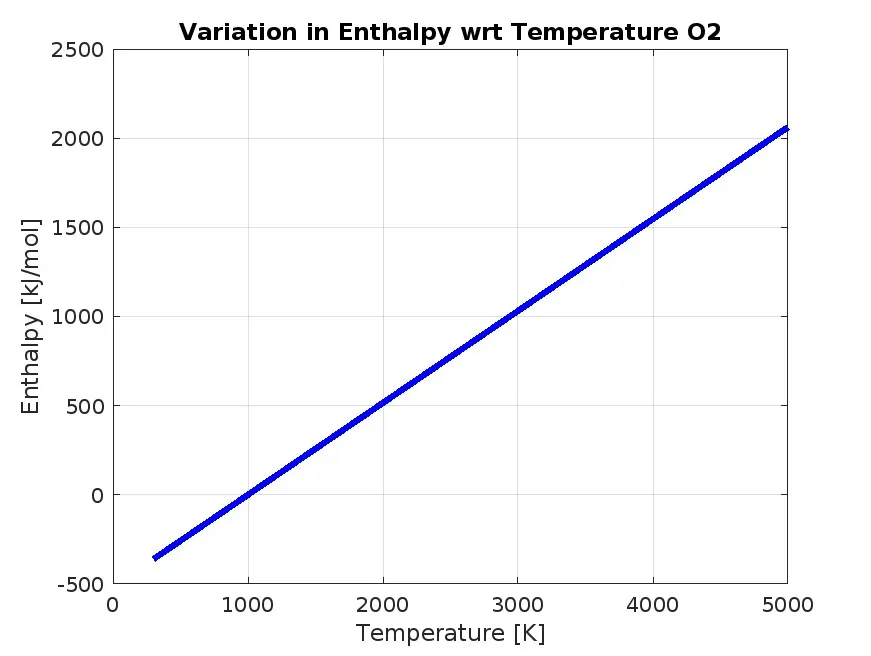
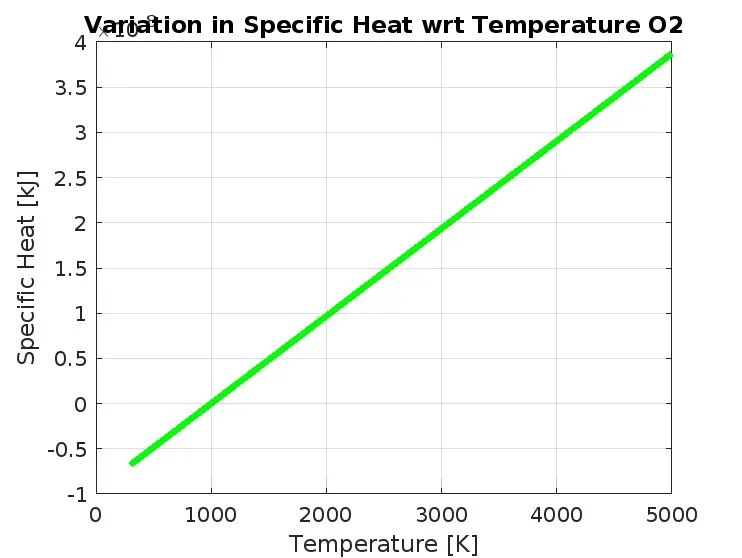
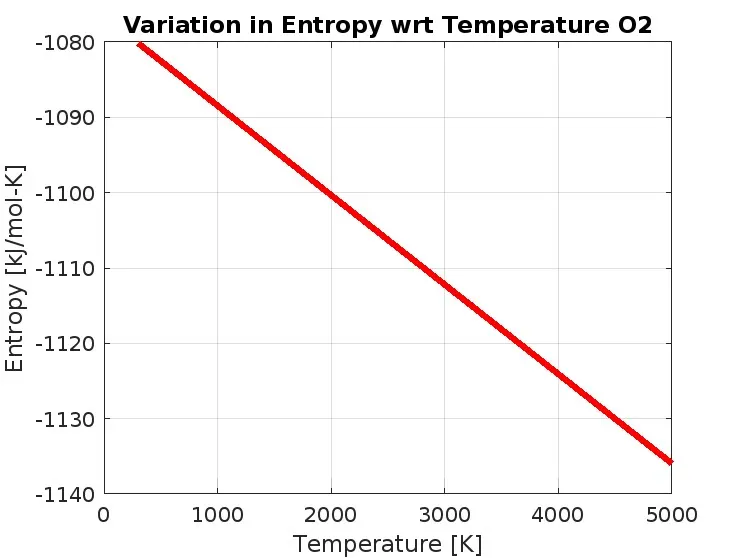
Output for the plots of N2 , O2, and CO2 for the Enthalpy Specific Heat and Entropy:
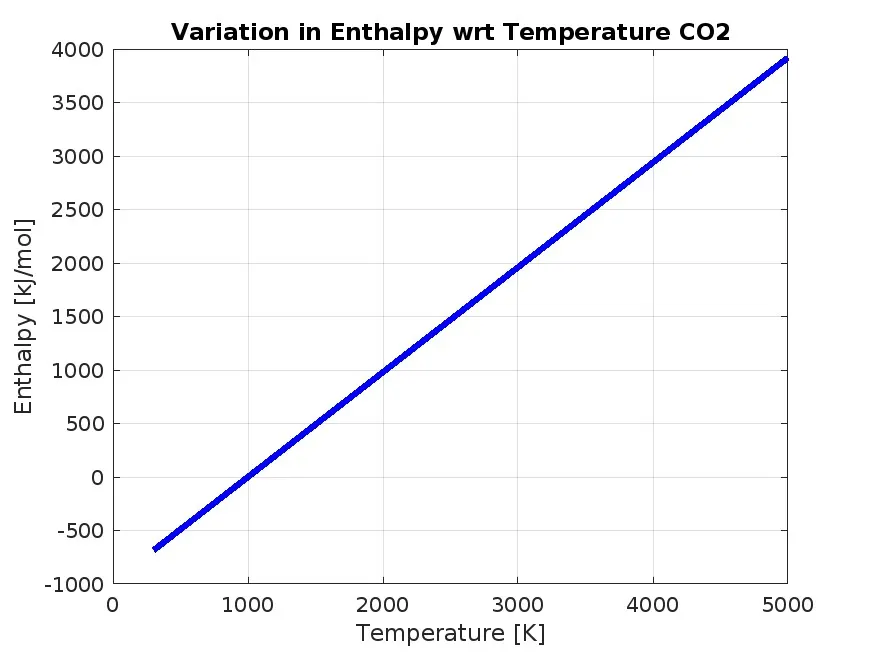
- Blue color - Variation in Enthalpy with respect to temperature
- Green color - Variation in Specific Heat with respect to temperature
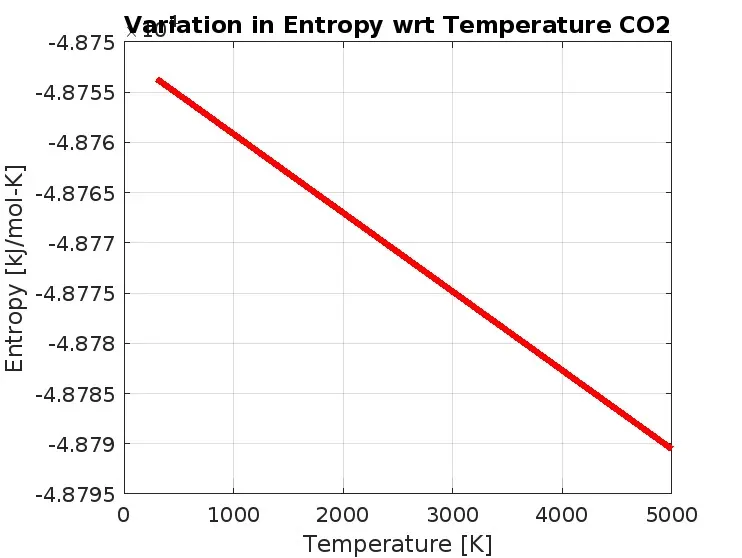
- Red color -Variation in Entropy with respect to temperature
CO2 Output:
N2 OUTPUT:
O2 OUTPUT:
COMMENT BOX SCREENSHOT:
Conclusion:
File Reading:
- The code reads data from a file named "THERMO.dat" containing information about 53 different chemical species.
- The data includes temperature ranges, coefficients, and other details.
Calculations and Plots:
For each of the 53 species:
- Coefficients are extracted from the file.
- Entropy, Enthalpy, and Specific Heat are calculated using placeholder formulas.
- Molecular weight is calculated based on the species' elemental composition.
- Plots (Enthalpy vs. Temperature, Entropy vs. Temperature, Specific Heat vs. Temperature) are generated.
Output and Saving:
- Molecular weights and plots are displayed.
- Plots are saved in separate folders for each species.
- Molecular weights are also saved in a text file.