Week 3 - External flow simulation over an Ahmed body.
External flow simulation over an Ahmed body
Aim:To simulate external flow over an Ahmed body.
Introduction and Theory:(Ans for Q1)
Ahmed's body and its importance:The Ahmed body is a geometric shape first proposed by Ahmed and Ramm in 1984. The shape provides a model to study geometric effects on the wakes of ground vehicles (like cars).The airflow around the Ahmed body captures the essential flow features around an automobile .Although it has a very simple shape, Ahmed body allows us to capture characteristic features that are relevant to bodies in the automobile industry.This model is also used to describe the turbulent flow field around a car-like geometry. Once the numerical model in validated,it is used to design new models of the car.
As the burning of fossil fuels becomes a more pressing issue, manufacturers are introducing more fuel efficient cars to the market. One main contributor to fuel burn is the car’s aerodynamic drag. Complexly shaped, cars are very challenging to model and it’s difficult to quantify the aerodynamic drag computationally. The Ahmed body is a benchmark model widely used in the automotive industry for validating simulation tools. The Ahmed body shape is simple enough to model, while maintaining car-like geometry features.
The Ahmed Body was first created by S.R. Ahmed in his research “Some Salient Features of the Time-Averaged Ground Vehicle Wake” in 1984. Since then, it has become a benchmark for aerodynamic simulation tools. The simple geometrical shape has a length of 1.044 meters, height of 0.288 meters, and a width of 0.389 meters. It also has 0.5-meter cylindrical legs attached to the bottom of the body and the rear surface has a slant that falls off at 40 degrees.
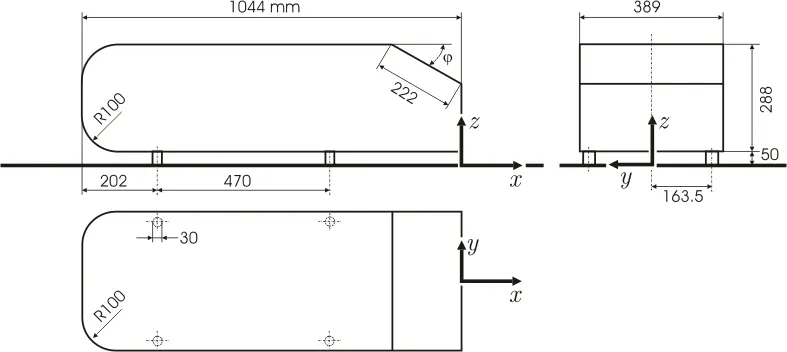
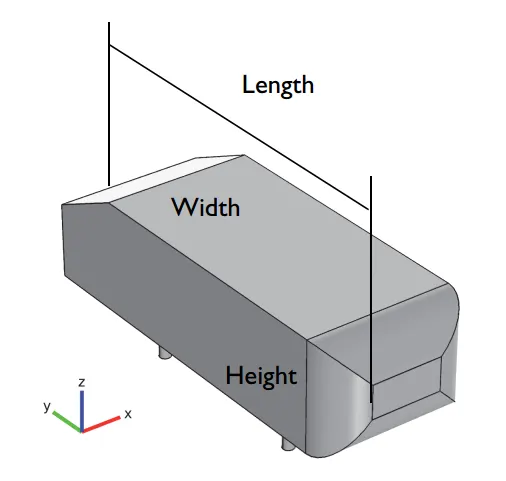
The simple geometry of an Ahmed body
Solving & Modelling approach:
Base line modelling:
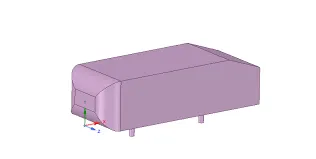
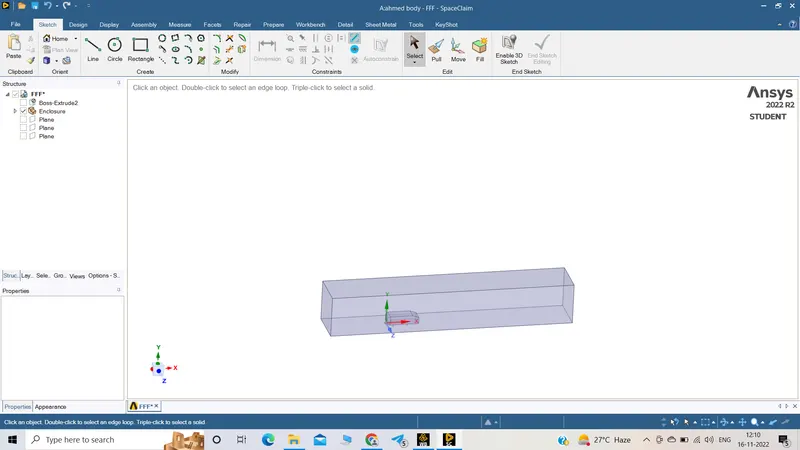
Geomtry creation:Importing geomtry in spaceclaim.
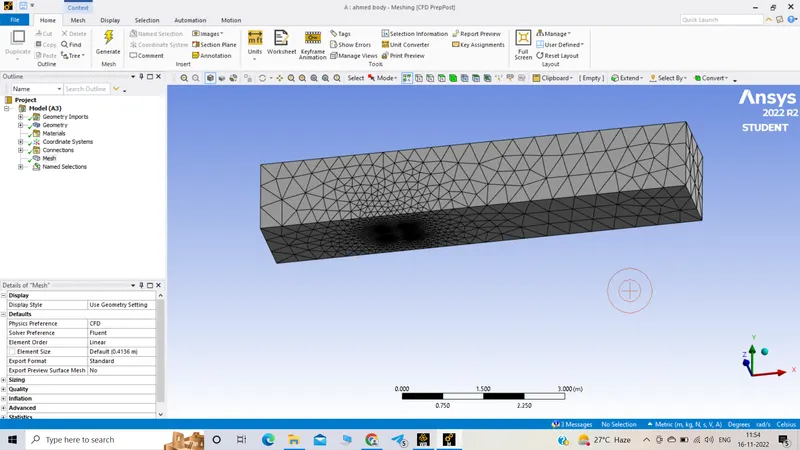
Meshing:
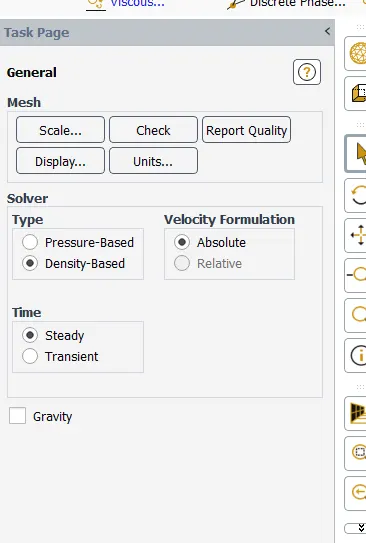
set up:
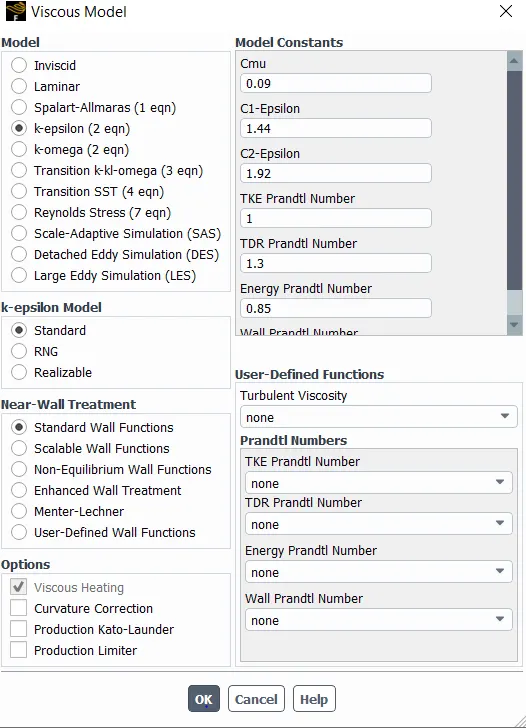
Solution:
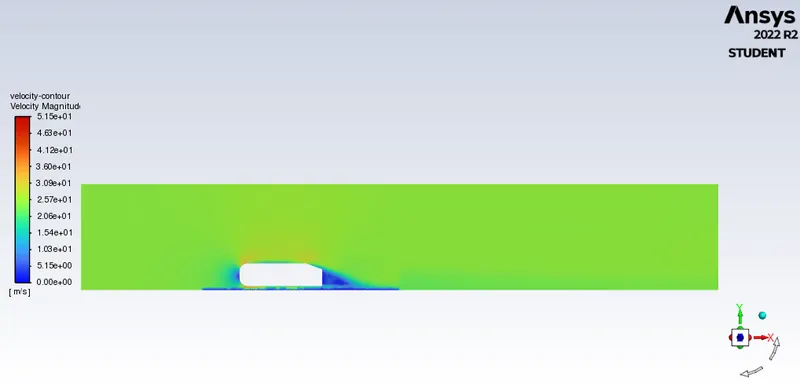
Velocity contour plot:
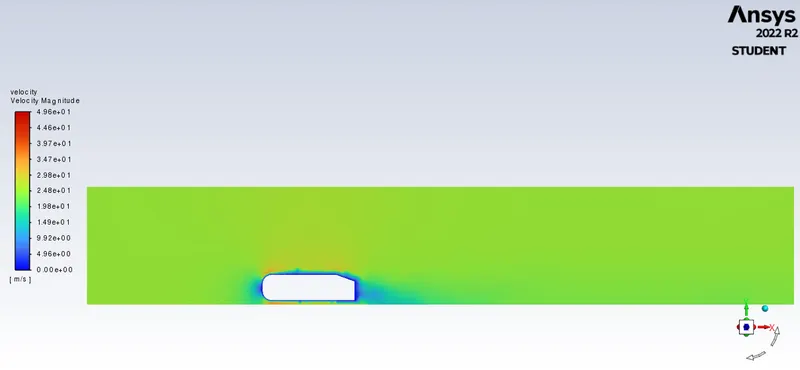
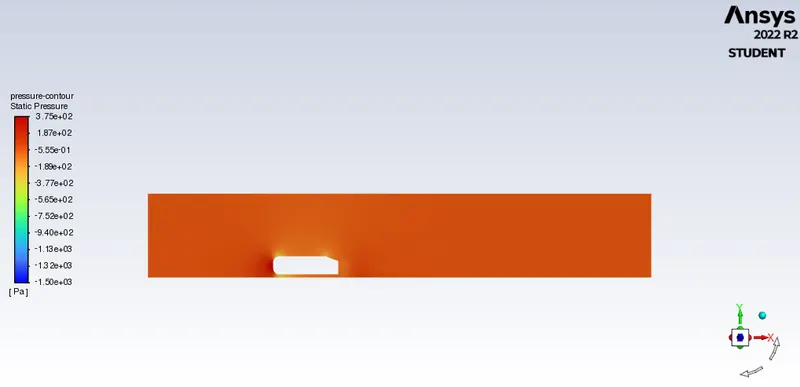
Pressure contour plot:
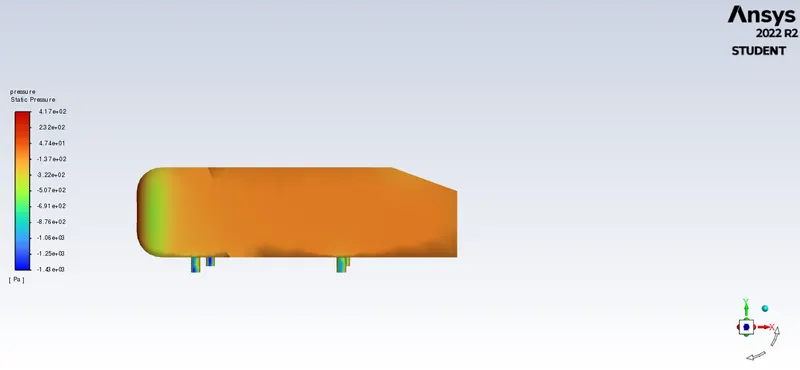
Refined Modelling:
Geometry setting:In present case, the body is symmetry along z axis. Thus the xy plane is used to split body in spaceclaim using Split body command. An enclosure is created around the body as shown in the figure.
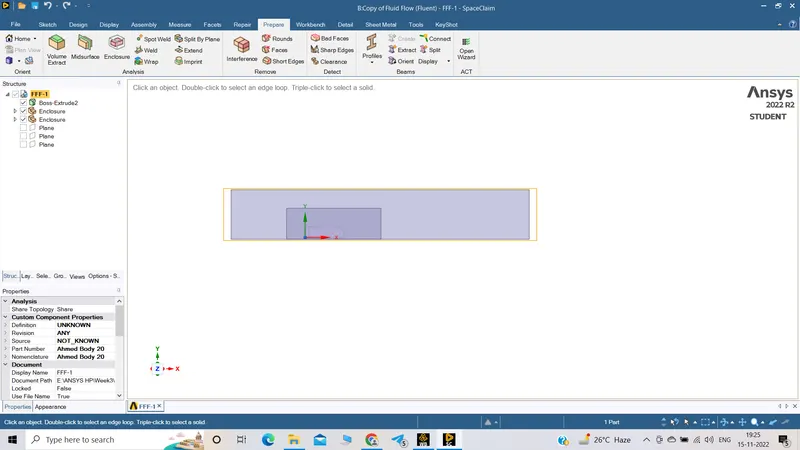
Mesh setting:
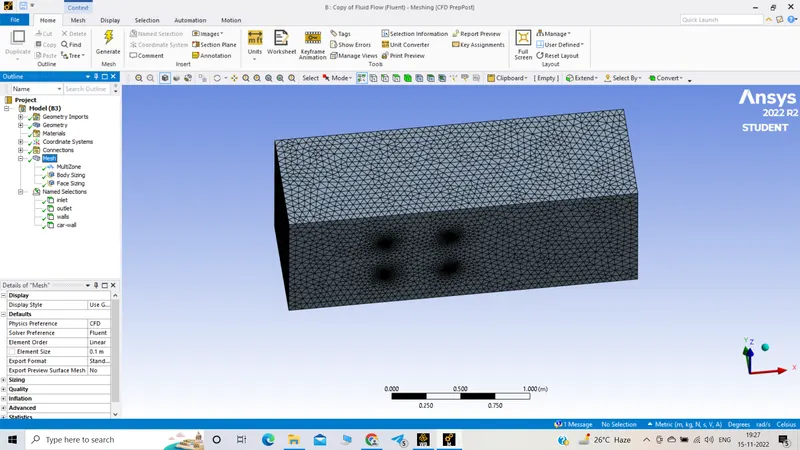
1. In meshing the outer enclosure is meshed with the multizone method to adjust with inner enclosure. Interference between inner enclosure and outer enclosure is removed and topology between two is made to share.
2. Body sizing method is used for the inner enclosure to refine the mesh.
3. Facing size in given to the bottom stands. Mesh around the face is refined to keep its cross section circular in shape.
4. Inflation is given for car wall. Total thickness method is given .
If first layer thikness=0.0007164 m,no of layers=5
using online y+ calculator:
It's important that your mesh near the wall is properly sized to ensure accurate simulation of the flowfield. This calculator computes the height of the first mesh cell off the wall required to achieve a desired Y+ using flat-plate boundary layer theory.
Input
Reset to sea level conditions
Compute Wall Spacing
where:
- `F_d`= the drag force, which is by definition the force component in the direction of the flow velocity;
- `rho`= the mass density of the fluid;
- `u`= the flow speed of the object relative to the fluid;
- `A`=the reference area
5. Faces are named according to their function. inlet,outlet,wall(symmetry:all side walls) and car-wall.
Setup:
General:
Viscous Model:
Set the reference values from inlet :(change the area to projected area)
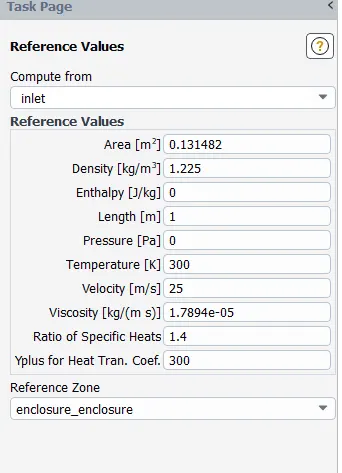
Projected area is to be calculated from result-reports
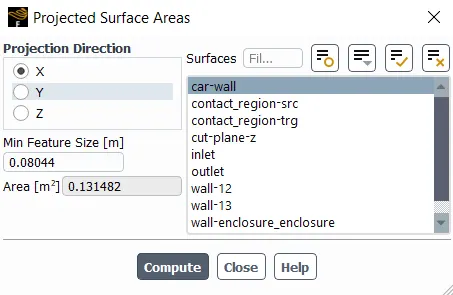
Velocity of fluid at inlet=25m/s(given)
Fluid: Air
Turbulence model= k-epsilon
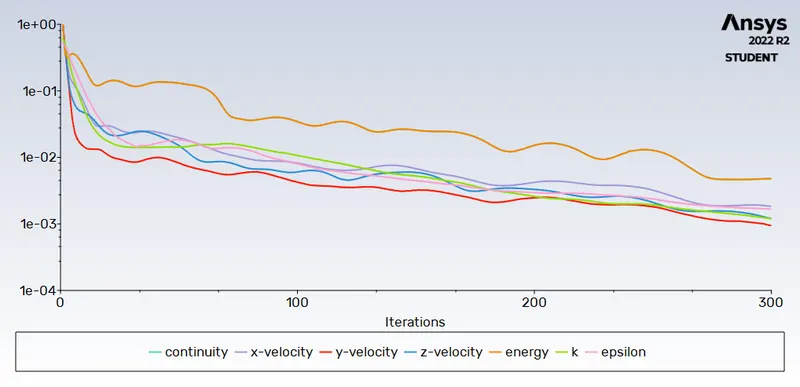
No. of iterations=300
Scaled residuals:
Drag-coefficient plot(refined):
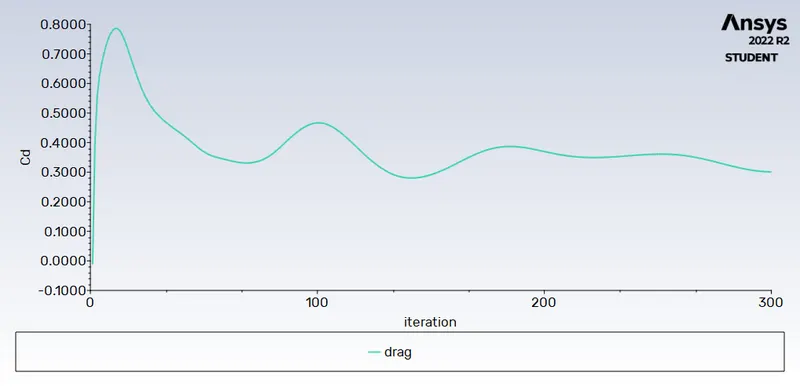
Drag coefficient,Cd=0.3005143
Lift-coefficient plot(refined):
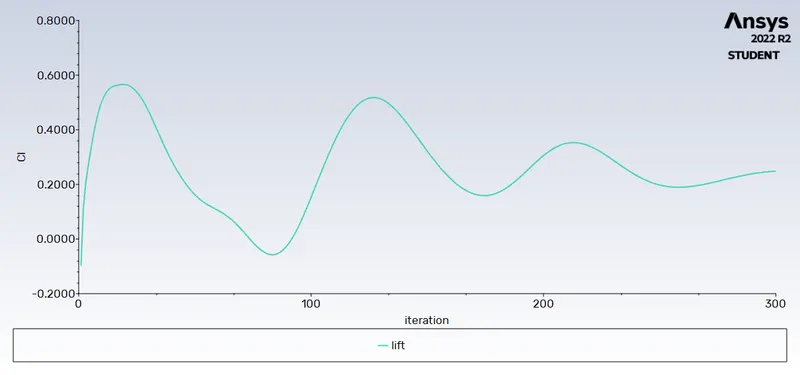
Lift coefficient,Cl=0.24824794
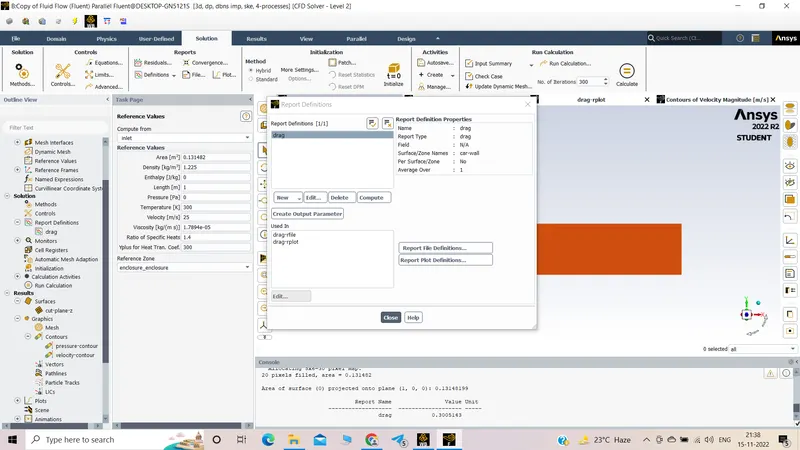
Cd=
0.3005143
Velocity contour plot:
Pressure contour plot:
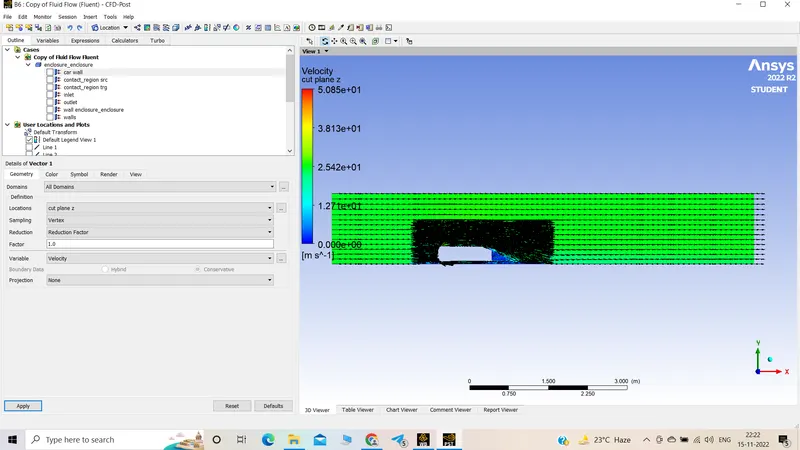
The vector plot showing the wake region:
Grid independency test:
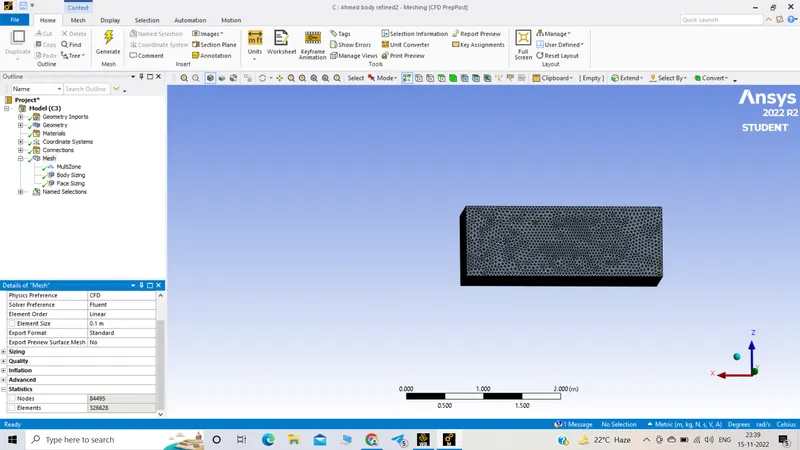
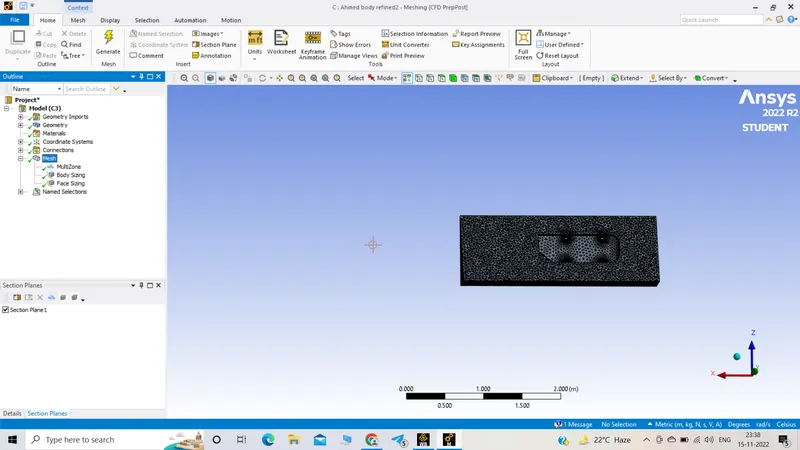
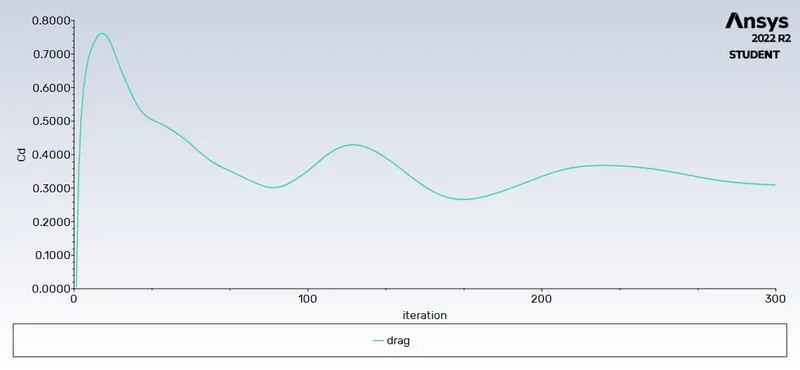
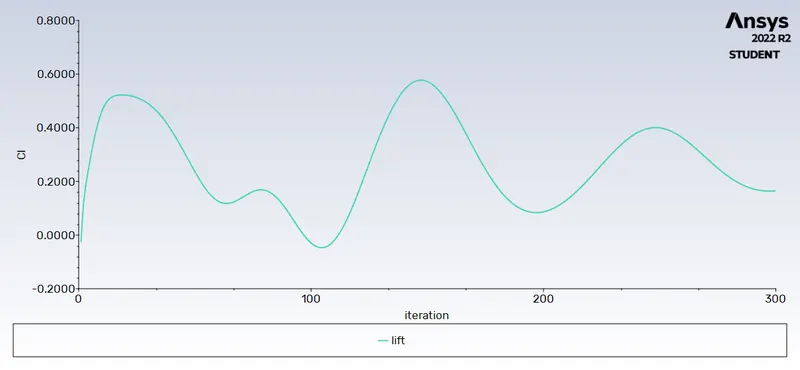
Case 1:
Body sizing:Element size:0.04m
Drag-coefficient plot(case 1):
Lift-coefficient plot(case 1):
Case 1:
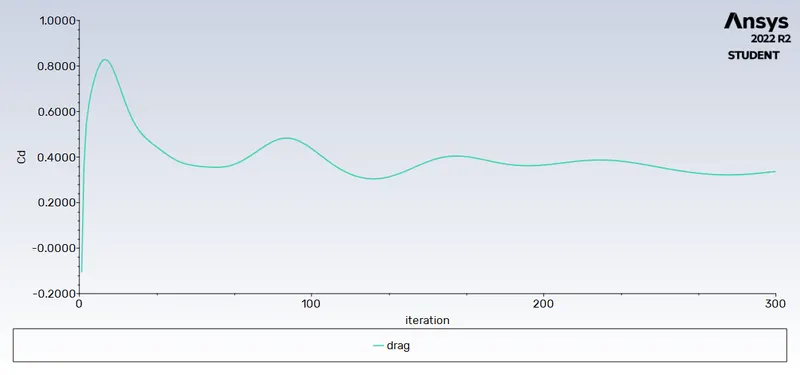
Body sizing:Element size:0.06m
Drag-coefficient plot(case 2):
Lift-coefficient plot(case 2):
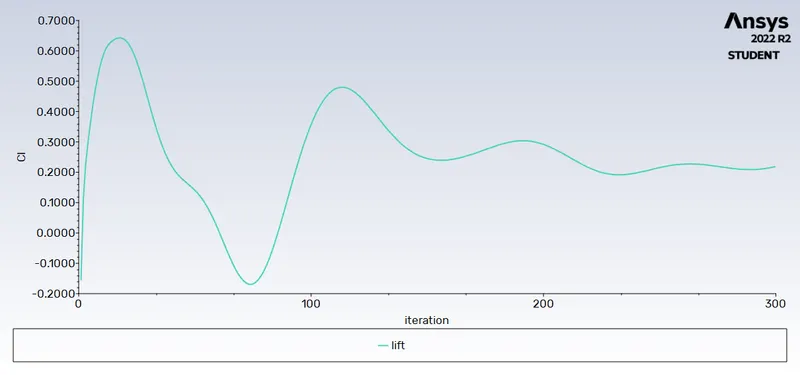
| cases | drag coefficient(Cd) | lift coefficient(Cl) |
| 1.(Element size 0 .05m)(body sizing) |
0.3005143 |
0.24824794 |
| 2.(Element size 0 .04m)(body sizing) | 0.30897883 | 0.16502426 |
| 3..(Element size 0 .06m)(body sizing) |
0.33728987 |
0.21885791 |
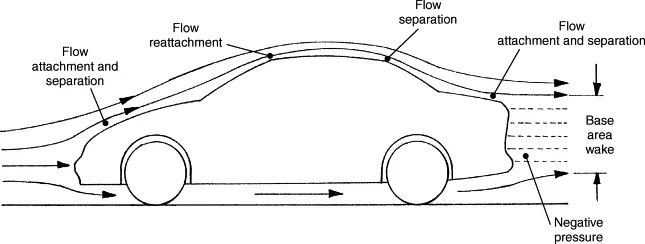
The reason for the negative pressure in the wake region (Ans for Q2):

Suppose there is a stationary average car, in which air all around it at atmospheric pressure. Now when the car just starts to move forward, the air would flow from the front to the back of the car. There would be streamlined flow over the car. Now, when the flow reaches a separation point, i.e., where it can no longer maintain the streamlined nature, the flow leaves the surface.
The point where the flow leaves the surface is called the separation point. In scientific terms, it is the point where there is no more influence of the wall i.e., there is no zero wall shear stress. This flow with it would carry the air particles behind the car when the car was at rest. So, the number of molecules behind the car has now considerably gone down, which implies the pressure has reduced. This is the negative pressure region that is developed behind the car.
1.Flow and Turbulence Structures in the Wake of a Simplified Car Model
2.Experiments and numerical simulations on the aerodynamics of the Ahmed body
3.https://www.cfd-online.com/Wiki/Ahmed_body