Week 9 - Parametric study on Gate valve.
Parametric study on Gate valve
Objectives:
To perform a parametric study on the gate valve simulation by setting the opening from 10% to 80%.
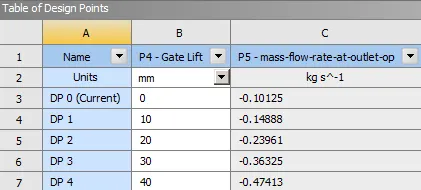
- Obtain the mass flow rates at the outlet for each design point.
- Calculate the flow coefficient and flow factor for each opening and plot the graph.
- Discuss the results of the mass flow rate and flow coefficient.
Gate Valve:
A gate valve is a linear motion valve used to regulates, control, or directs the flow of a fluid by opening, closing, or partially obstructing fluid flow.
It consists of several parts such bonnet, body, stem, yoke, handle, gate disc etc. In this parametric study the flow region and the position of gate disc is the region of concern. The below figure shows different flow paths corresponding to different lift of gate disc.
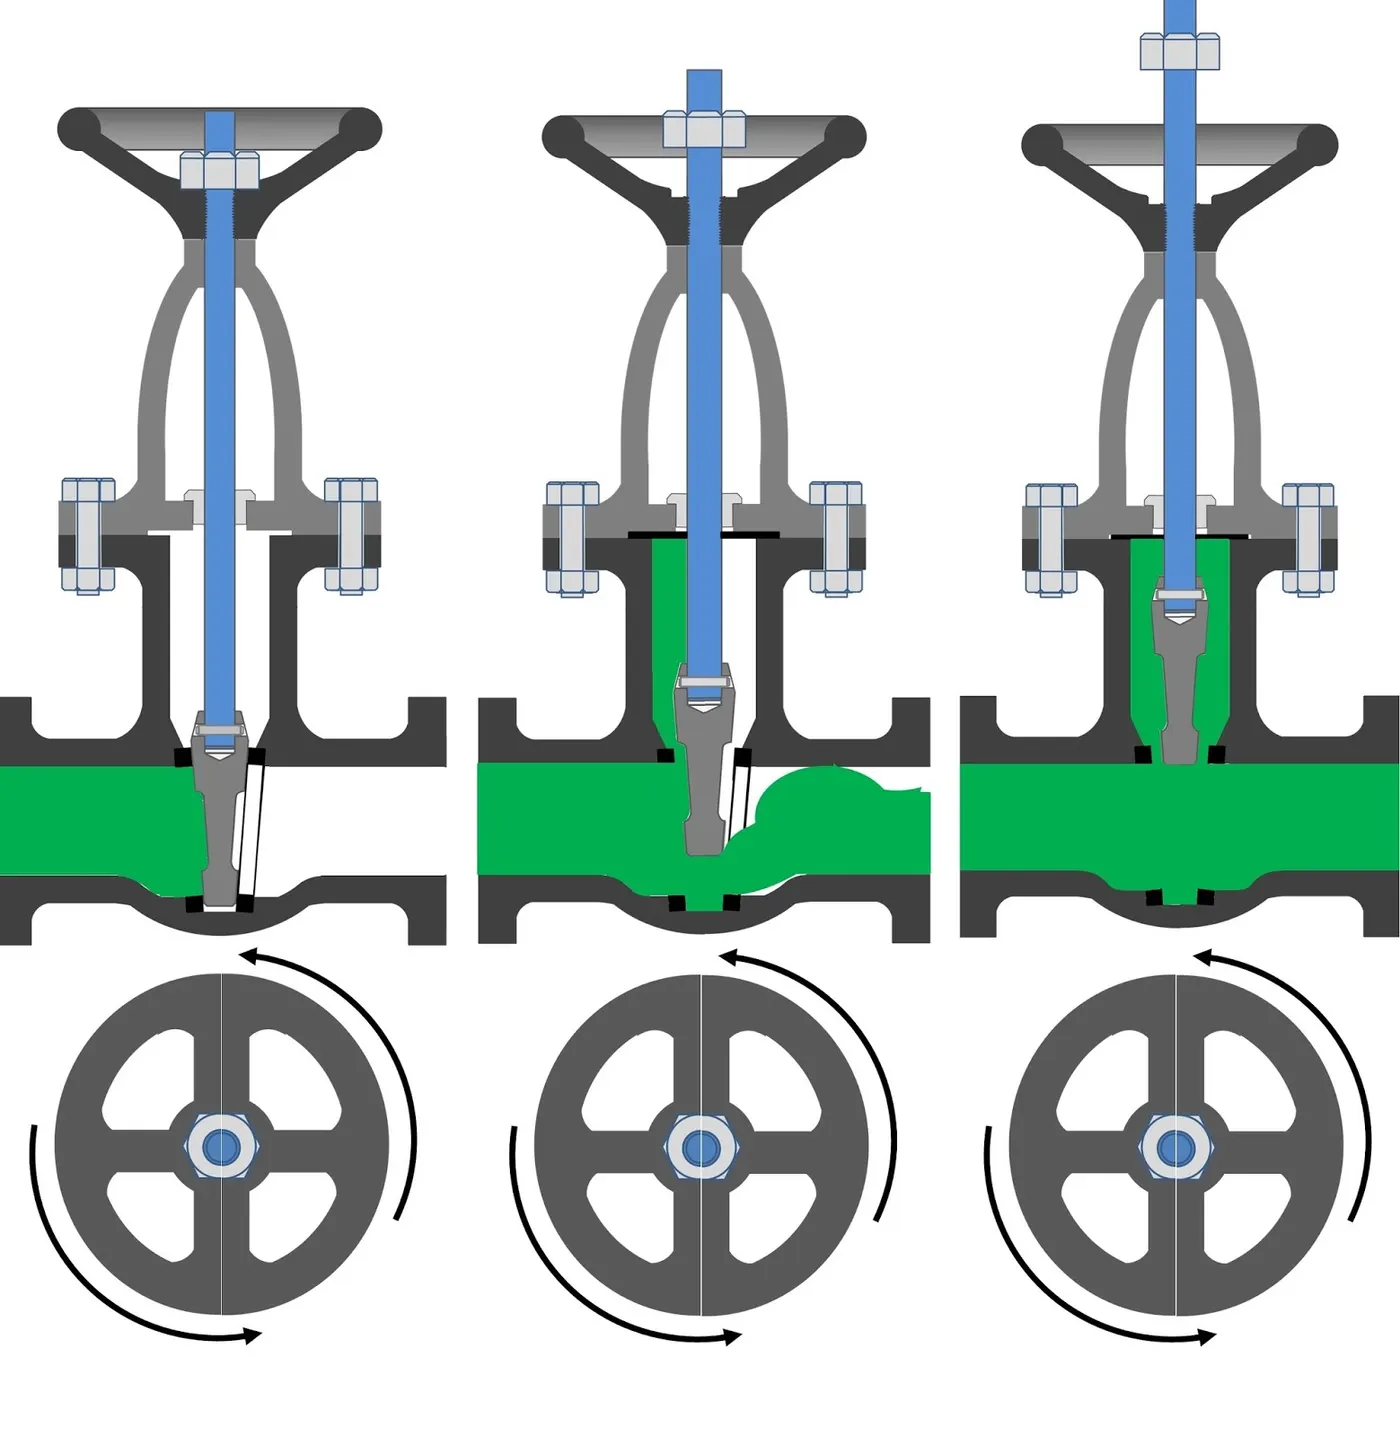
Fig 1. Flow inside Gate Valve
Geometry:
The given geometry consists of 5 parts, namely body, bonnet, spindle, hand wheel and disc.
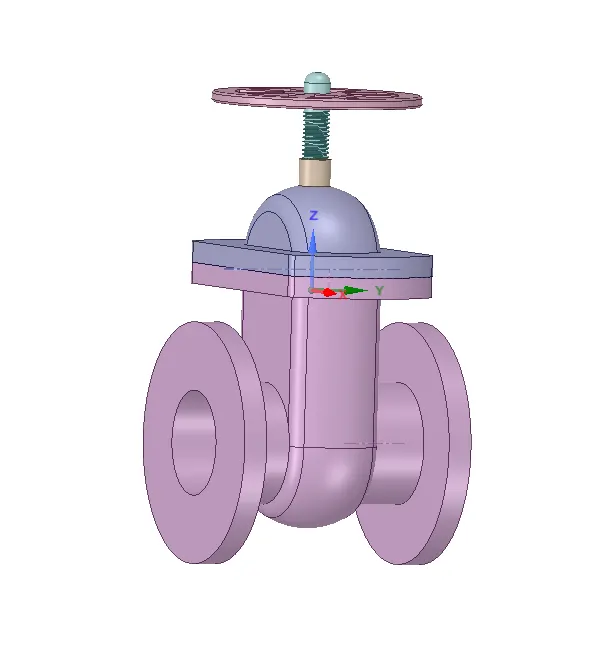
Fig 2. Geometry of Gate Valve
The lift of the gate disc is parametrized to perform the parametric study. The order of parametrization is from 0 to 80 mm with a step of 10 mm. (i.e., 0 to 80%)
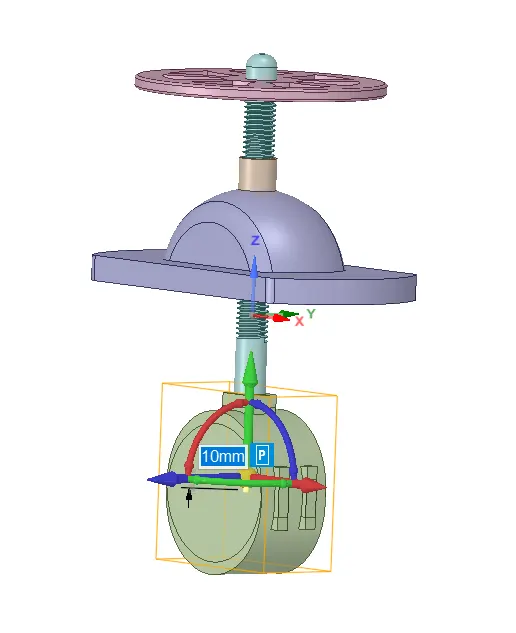
Fig 3. Gate disc parametrization
The fluid volume is extracted and the inlet and outlets are extruded to a length of 800mm on both sides (upstream as well as downstream) (Refer Fig 4)
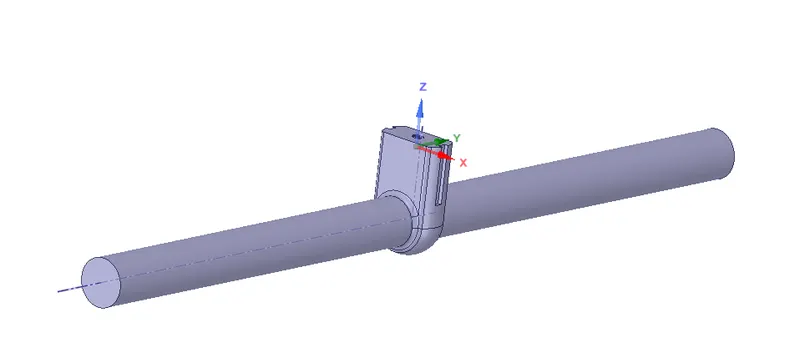
Fig 4. Extracted Fluid volume at 0% lift
Meshing:
Element size: 10 mm
Mesh statistics:

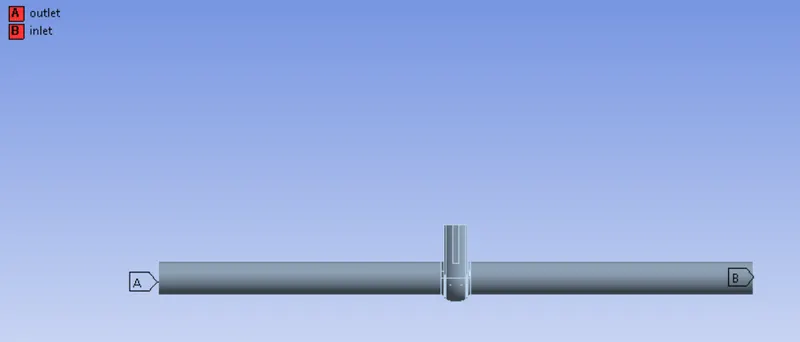
Fig 5. Named Selections (inlet and outlet)
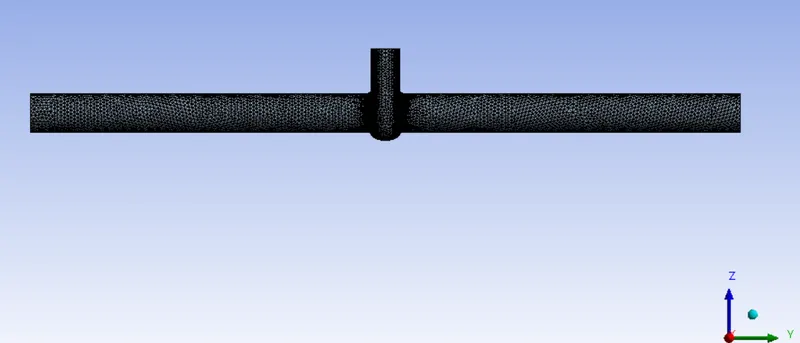
Fig 6. Meshed Geometry
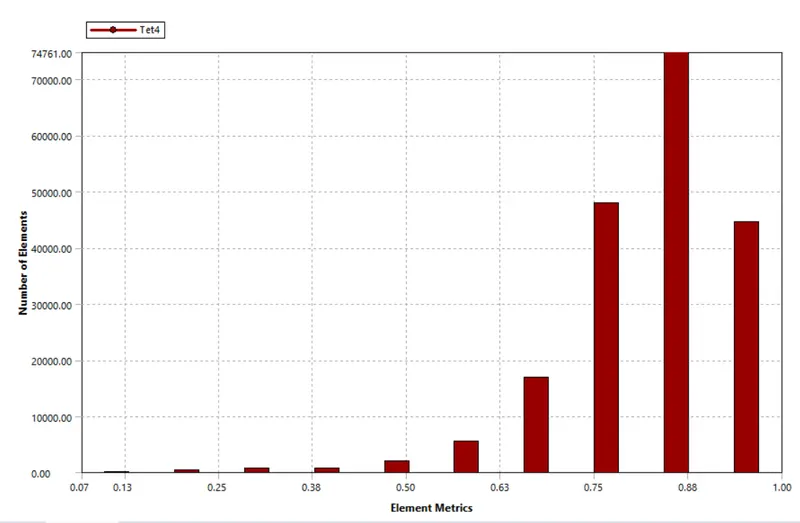
Fig 7. Mesh Quality
From the above histogram, majority of the elements are near to metric 1 which proves to be sufficient to achieve a good result.
Case setup:
- Steady State Simulation
- Gravity - 'on' along ' - Z '
- Solver Type- Pressure based
- Turbulence Model- k epsilon realisable with scalable wall function
- Working Fluid - Water
- Cell Zone conditions set to Water
- Boundary conditions Type: Pressure inlet and Pressure outlet
- Pressure at inlet = 10 Pa
- Pressure at outlet = 0 Pa
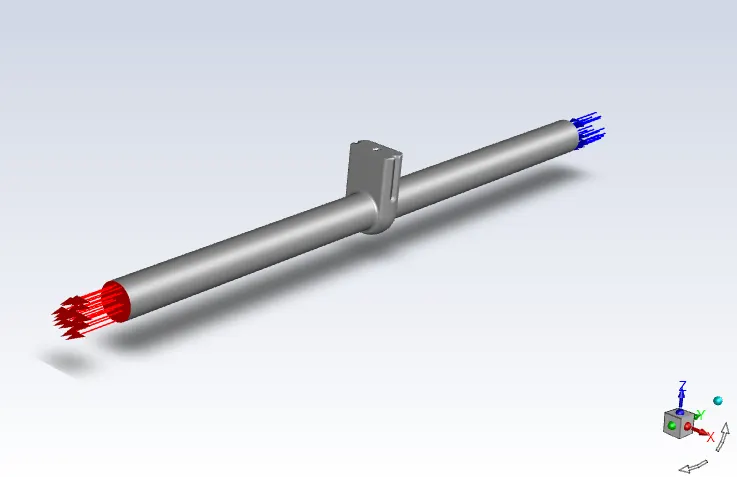
Fig 8. Inlet and Outlet of pipeline
Results:
Case 1:
0 mm opening
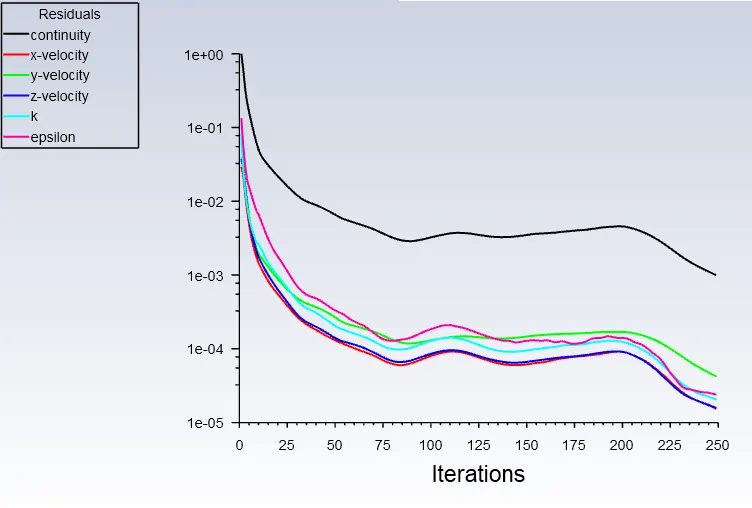
Residual Plot:
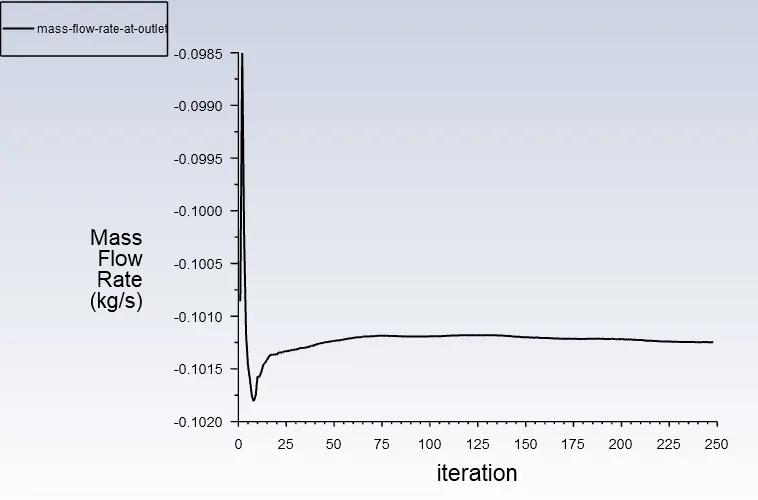
Mass flow rate Plot: -0.10125 kg/s
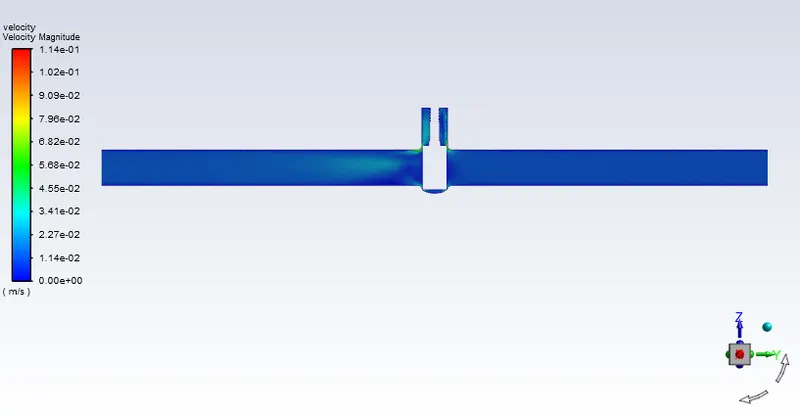
Velocity Contour:
Pressure Contour:
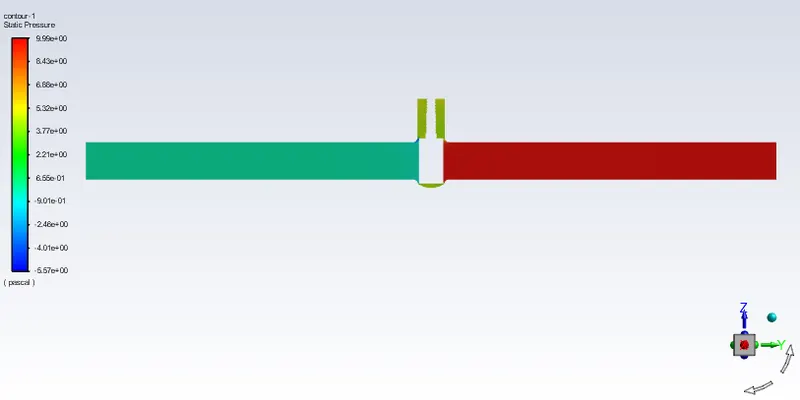
Pressure Probes at upstream and downstream:

- Value at Point of Pressure on Point 1
9.89445 [Pa]
- Value at Point of Pressure on Point 2
-0.0708373 [Pa]
Case 2:
10 mm opening
Residual Plot:
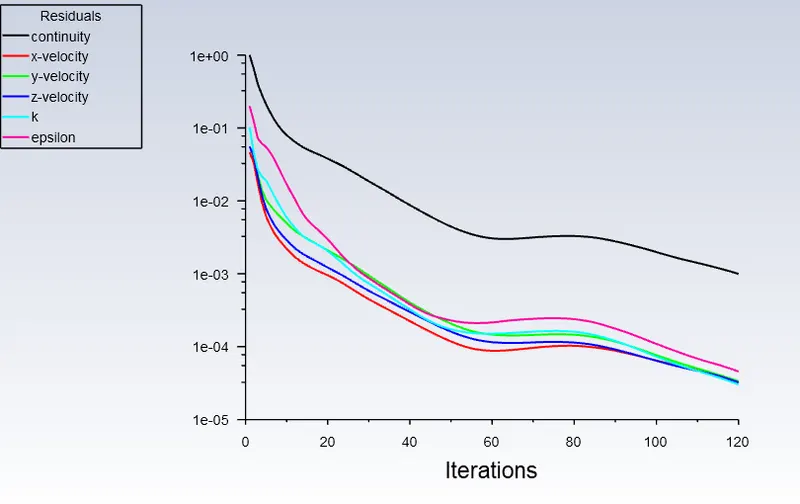
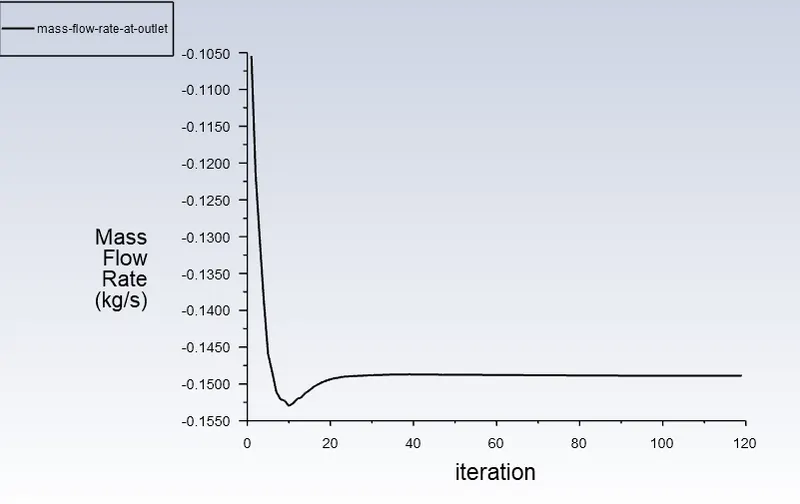
Mass flow rate Plot: -0.14887 kg/s
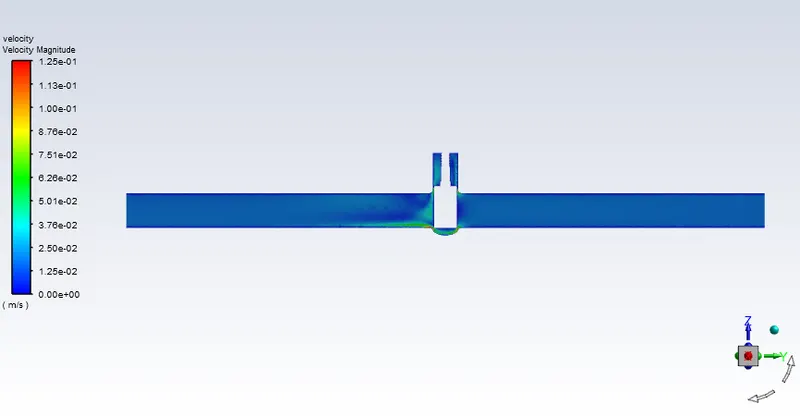
Velocity Contour:
Pressure Contour:
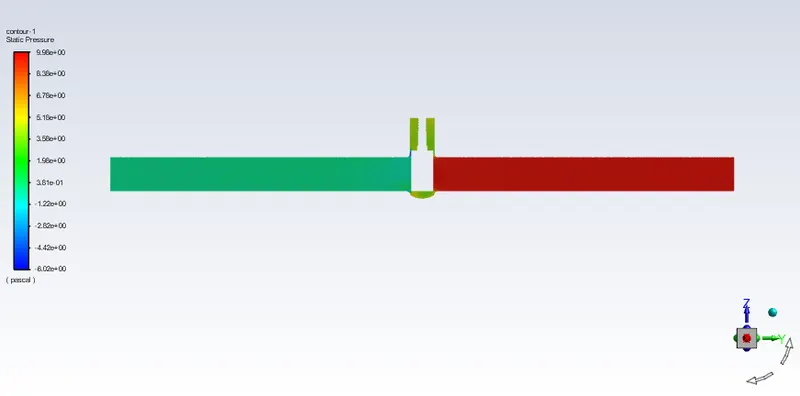
Pressure Probes at upstream and downstream:
Value at Point of Pressure on Point 1
9.76987 [Pa]
Value at Point of Pressure on Point 2
-0.302994 [Pa]
Case 3:
20 mm opening
Residual Plot:
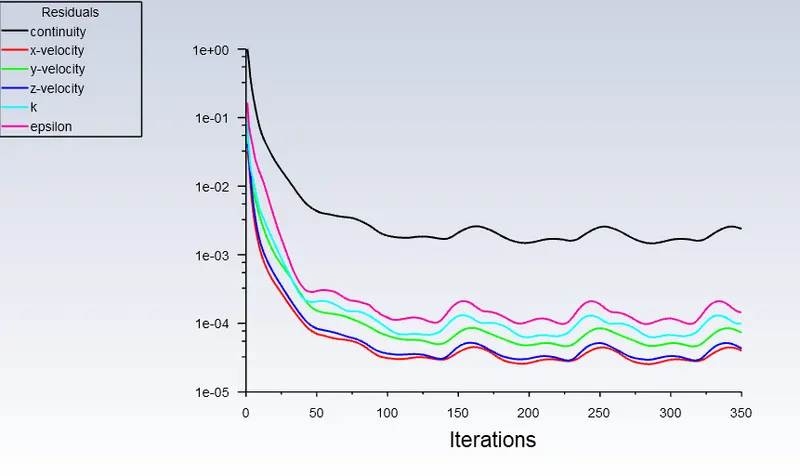
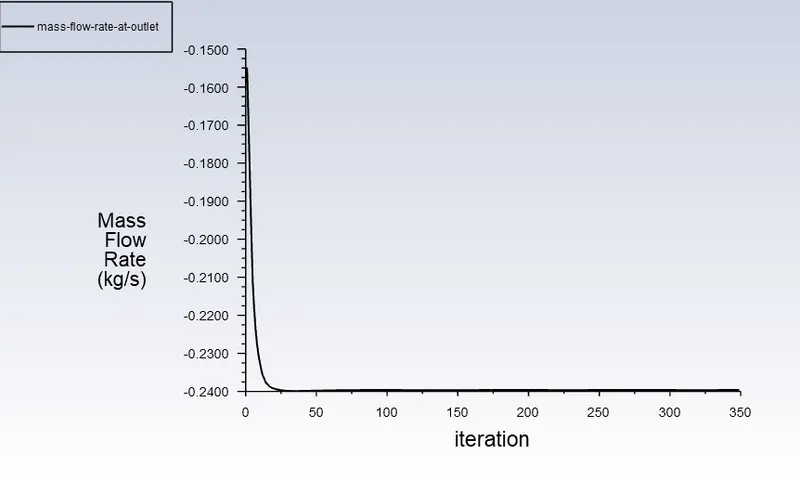
Mass flow rate Plot: -0.23960 kg/s
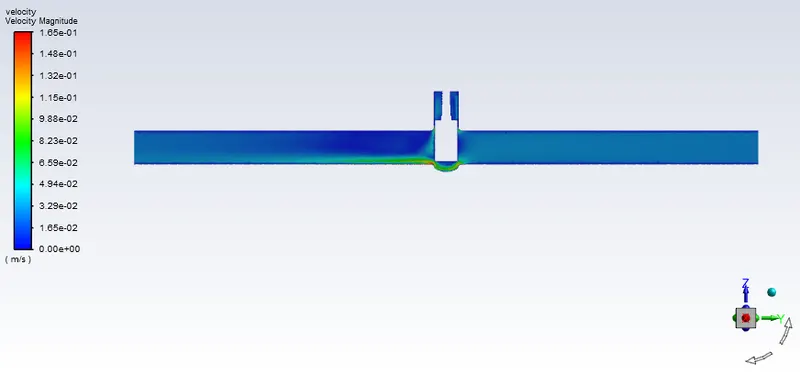
Velocity contour:
Pressure contour:
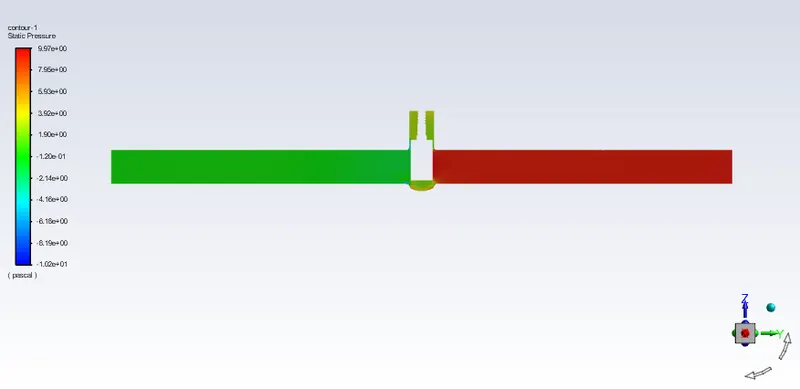
Pressure Probes at upstream and downstream:
Value at Point of Pressure on Point 1
9.40329 [Pa]
Value at Point of Pressure on Point 2
-0.916248 [Pa]
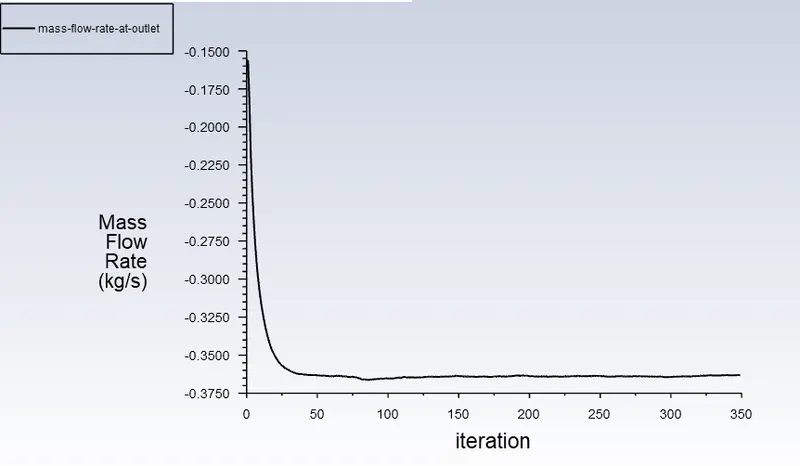
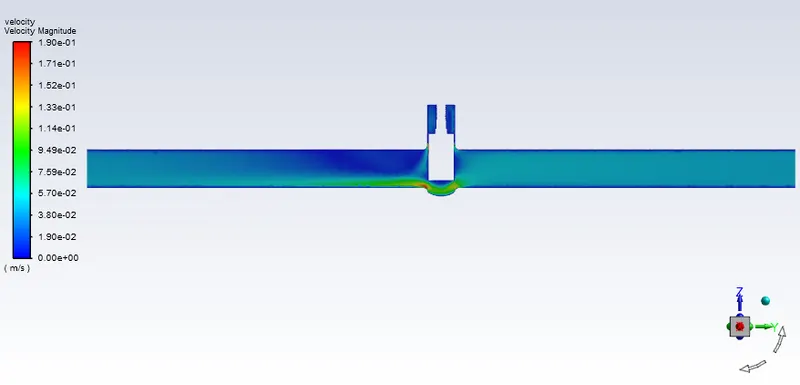
Case 4:
30 mm opening
Residual Plot:
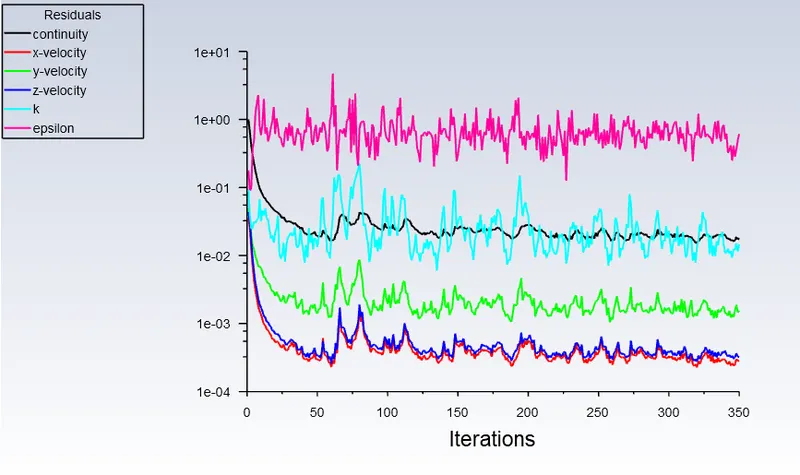
Mass flow rate Plot: -0.36325 kg/s
Velocity contour:
Pressure contour:
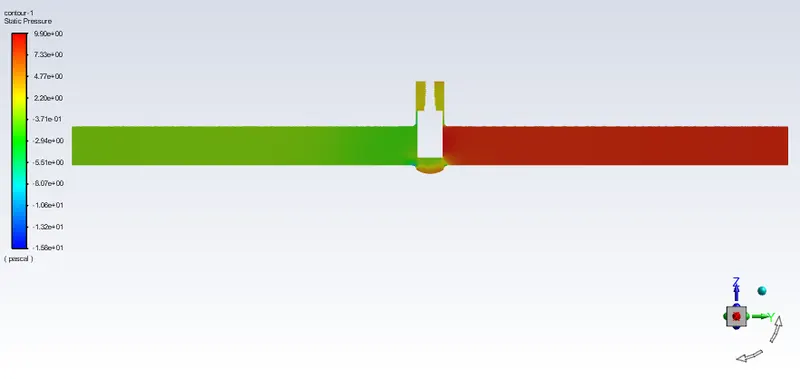
Pressure Probes at upstream and downstream:
Value at Point of Pressure on Point 1
8.62489 [Pa]
Value at Point of Pressure on Point 2
-1.50811 [Pa]
Case 5:
40 mm opening
Residual Plot:
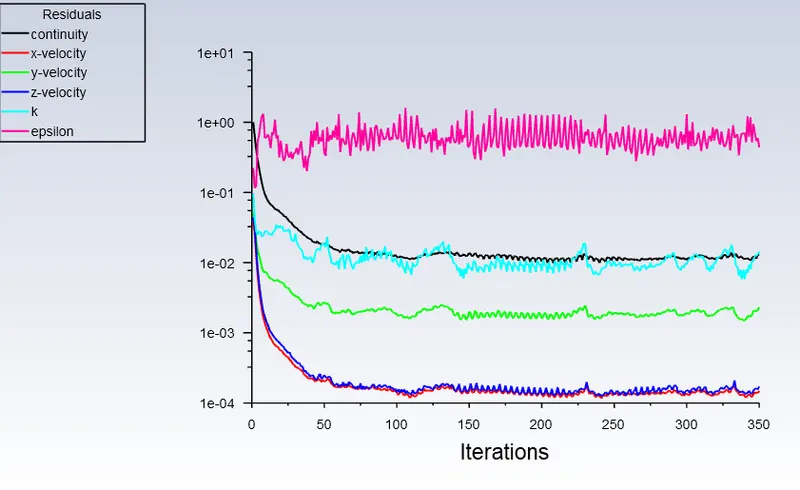
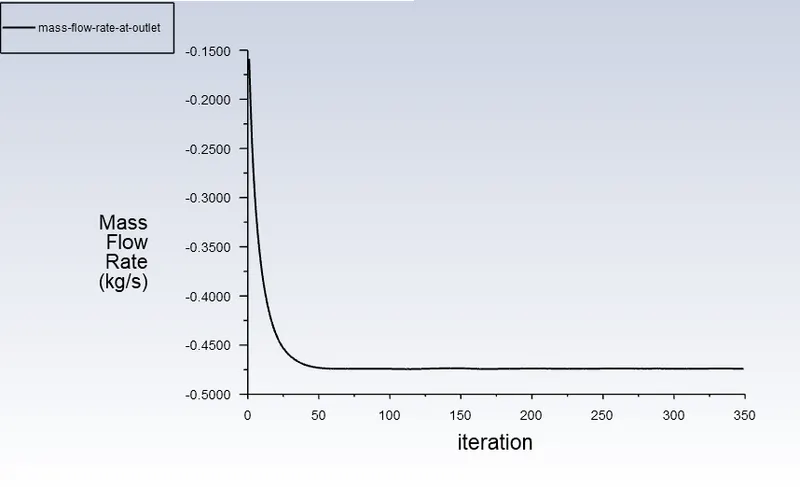
Mass flow rate Plot: -0.47412 kg/s
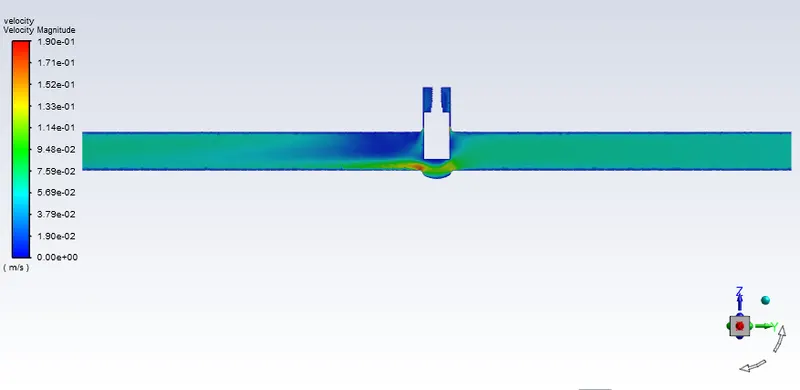
Velocity Contour:
Pressure Contour:
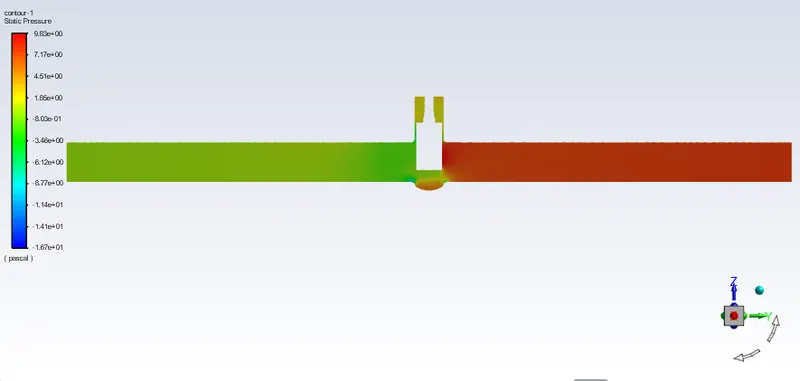
Pressure Probes at upstream and downstream:
Value at Point of Pressure on Point 1
7.62913 [Pa]
Value at Point of Pressure on Point 2
-1.77265 [Pa]
Parametric Study performed various lift conditions:
Flow Coefficient:
- The flow coefficient (Cv) is also known as the valve flow coefficient. It is an imperial measurement and is defined as the flow of water through a valve in US gallons per minute (GPM) at a pressure drop of 1 lb/in².
- Cv = Q * √ (SG/ΔP) (units in US GPM, psi)
- where, Q = Flow in US GPM, SG = Specific Gravity, ΔP = Differential Pressure (psi)
Flow Factor:
- Flow factor (Kv) is the metric equivalent of the flow coefficient. It is defined as the flow of water in cubic meters per hour (m³/hr) at a pressure drop of the bar.
- Kv = Q * √ (SG/ΔP) (units in m3/hr, bar)
- where, Q = Flow in m3/ hr, SG = Specific Gravity, ΔP = Differential Pressure (bar)
- The Relationship between Cv and Kv is Cv = 1.156 Kv OR Kv = 0.864 Cv
Based on the above details following data is obtained,
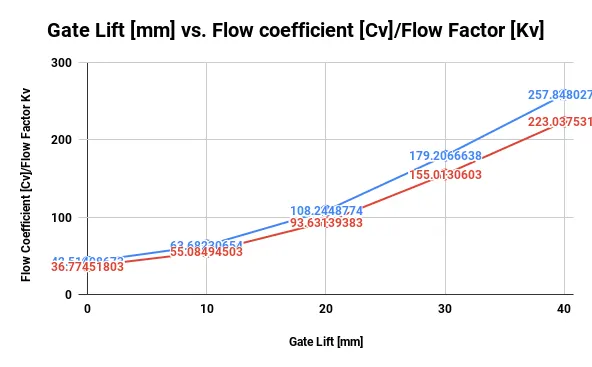
| Flow Coefficient Cv | Flow Factor Kv |
| 42.51408673 | 36.77451803 |
| 63.68230654 | 55.08494503 |
| 108.2448774 | 93.63139383 |
| 179.2066638 | 155.0130603 |
| 257.8480278 | 223.0375313 |
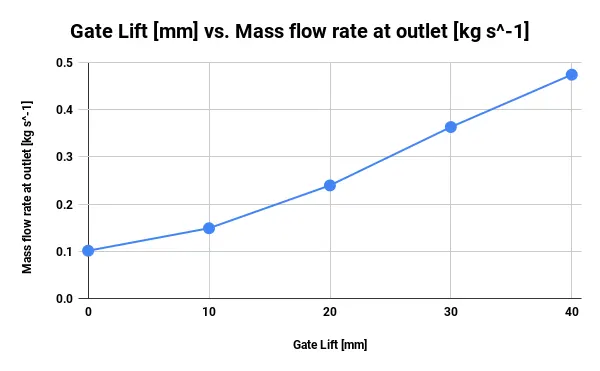
Relationship between Gate Lift Vs. Mass flow rate:
Relationship between Gate Lift [mm] vs. Flow coefficient [Cv]_Flow Factor [Kv]:
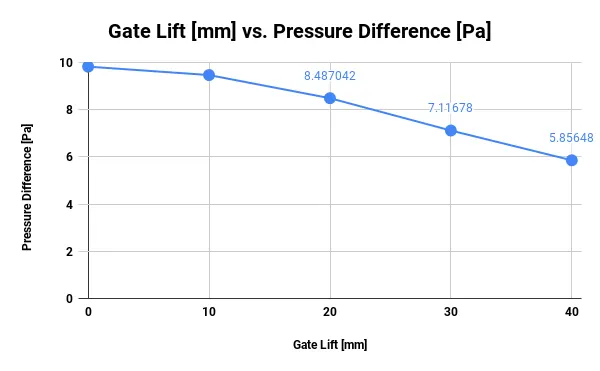
Relationship between Gate Lift [mm] vs. Pressure Difference between upstream and Downstream [Pa]:
Inference:
From the above parametric study, following are the observations
- As the gate lift increases, mass flow rate across the valve is increases and vice versa.
- As the mass flow rate increases, Flow coefficient, Flow factor increases and vice versa.
- Difference between the flow coefficient and the flow factor is based on unit scale only. Flow factor Kv is always less than Flow coefficient Cv.
- Pressure Difference between upstream and downstream decreases as the Gate disc Lift increases.
References:
[1] https://www.engineeringtoolbox.com/flow-coefficients-d_277.html
[Encl: Detailed Excel Sheet calculator