Week 6 - CHT Analysis on a Graphics card
CHT Analysis on a Graphics card
Objectives:
1. Perform a steady-state conjugate heat transfer analysis on a model of a graphics card.
2. Run the simulation by varying the velocity from 1m/sec to 5m/sec and discuss the results.
3. Find out the maximum temperature and heat transfer coefficient attained by the processor.
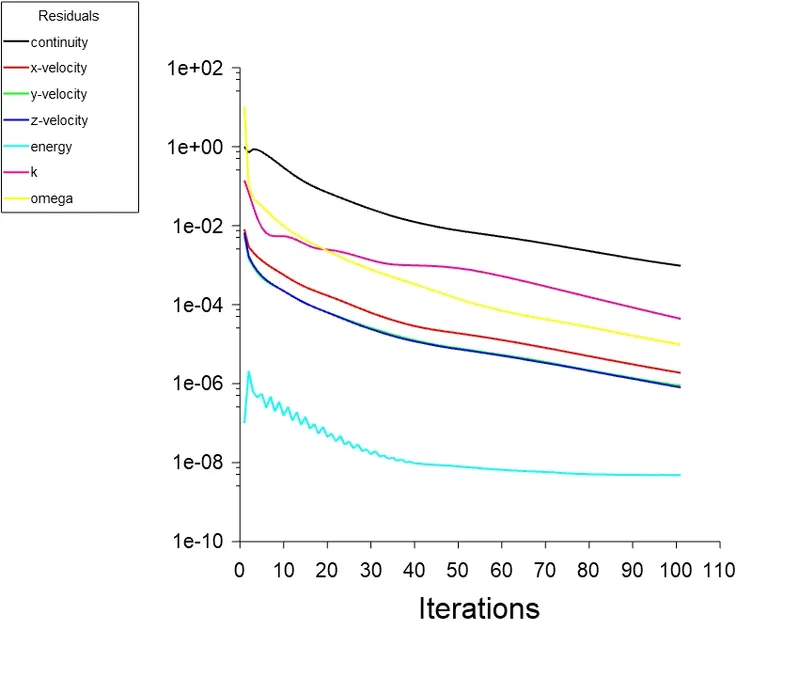
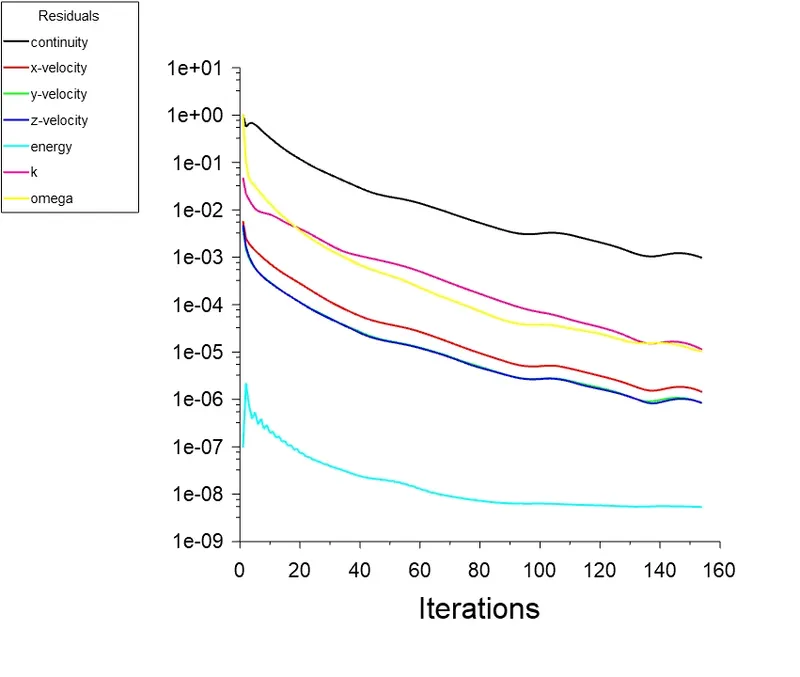
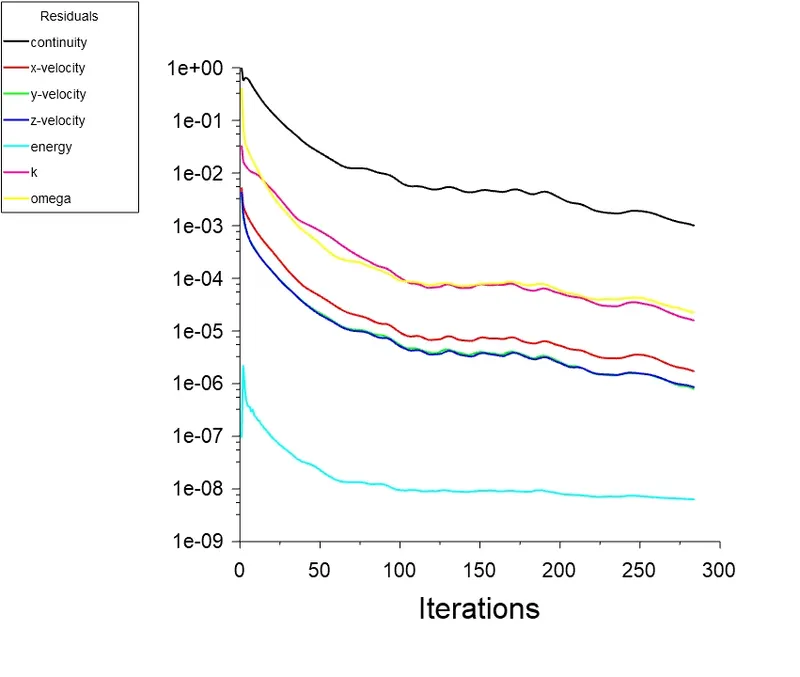
4. Prove that the simulation has achieved convergence with appropriate images and plots.
5. Identify potential hotspots on the model.
Conjugate Heat Transfer Analysis:
The Conjugate Heat Transfer (CHT) analysis type allows for the simulation of heat transfer between solid and fluid domains by exchanging thermal energy at the interfaces between them. Typical applications of this analysis type exist as, but are not limited to, the simulation of heat exchangers, cooling of electronic equipment, and general-purpose cooling and heating systems.
In this study, the thermal energy generated by the processor is transferred to a larger surface area through a heat sink, and the sink, in turn, is cooled by Air. Thermal management of the processor is essential for it to provide a sustainable performance without any throttling.
Geometry:
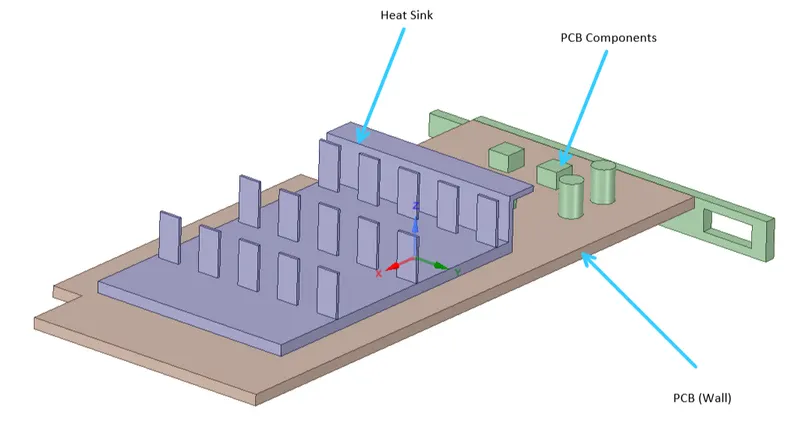
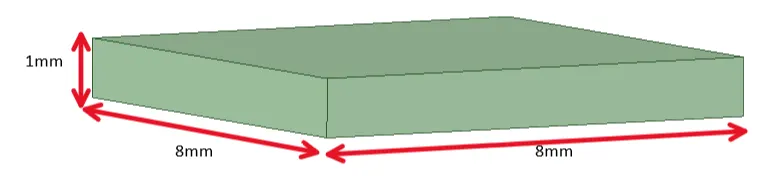
The above geometry is given to perform CHT analysis. It consists of a heat sink and PCB components.
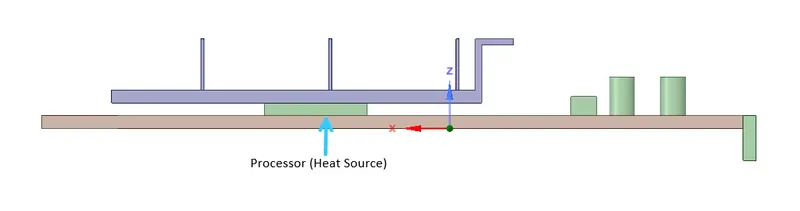
The processor acts as a heat source which has to be cooled by forced convection/natural convection by Air.
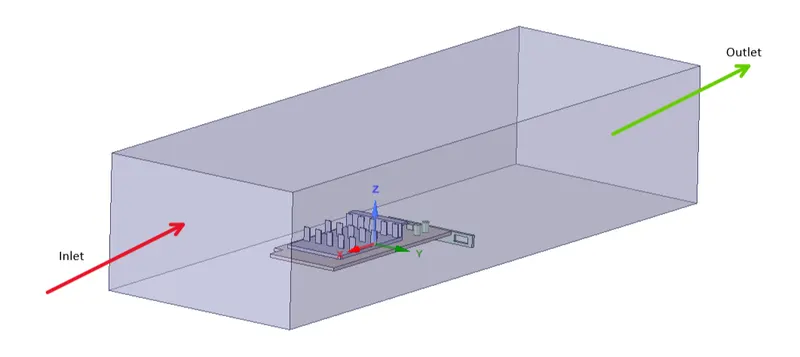
A bounding box is created to define the setup for external flow simulation.
Meshing:
Refined: (Element size: 75mm, 431951 elements)
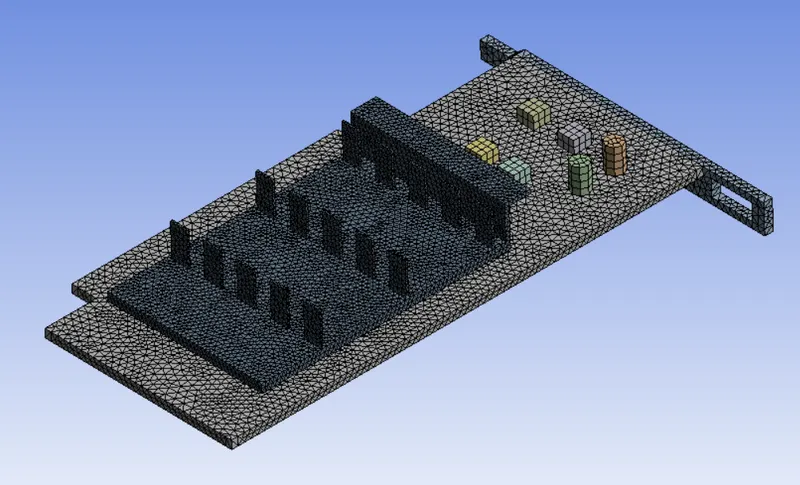

Conformal Mesh is created using share topology and the mesh is refined using capture proximity.
Materials:
All materials are used based on the availability in the FLUENT database.
Processor - Titanium
PCB - Steel
Heat Sink - Copper
PCB Components - Aluminium
Fluid - Air
Setup:
Solver: Steady State - Pressure based
Turbulence Model: K-ω SST (Used to capture near-wall physics much more accurately)
Inlet: Velocity 1,3,5 m/s
Outlet: Atmospheric Pressure
Cell-zone: Processor - Heat Generation rate 1,56,25,000 W/m3
This is calculated based on the volume of the processor, which is equal to 6.4e-8 m3, and the Thermal Design Power of the GPU is assumed to be 1W due to its minimal size.
Results:
Case 1: Ambient Velocity 1m/s
Residuals:
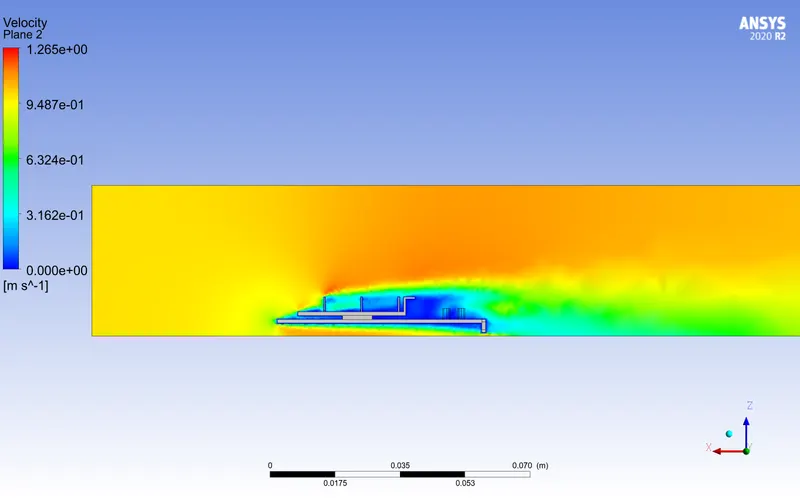
Global Velocity distribution:
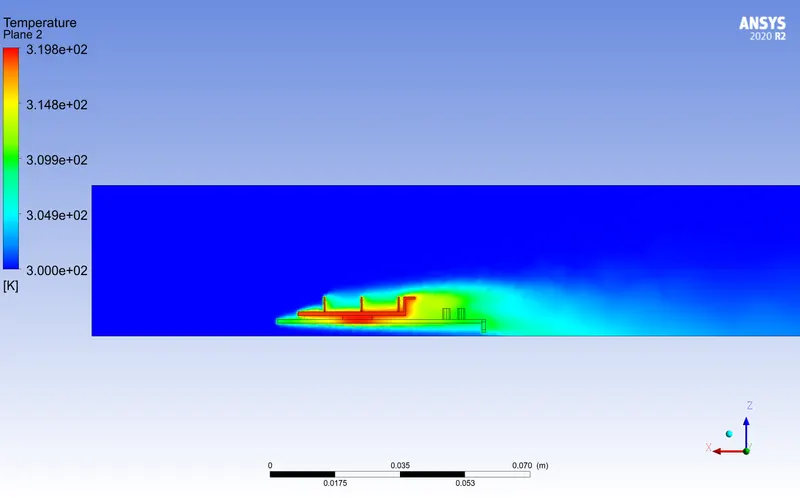
Global Temperature distribution:
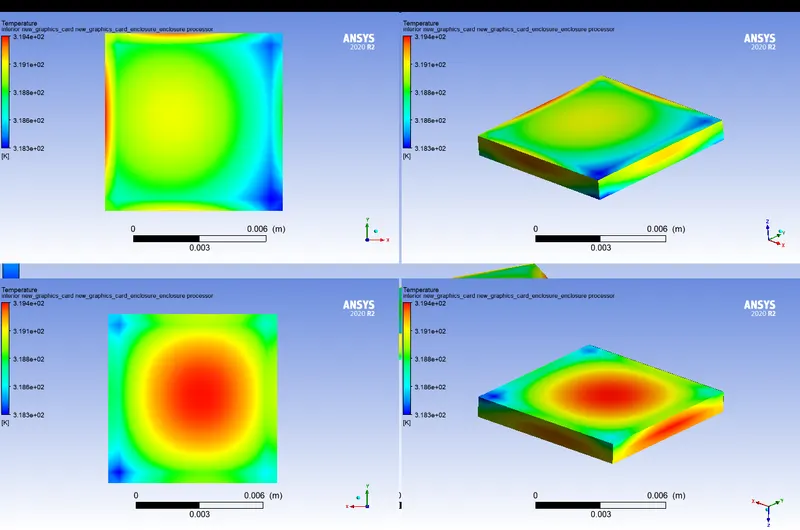
Localized Temperature distribution at the Processor:
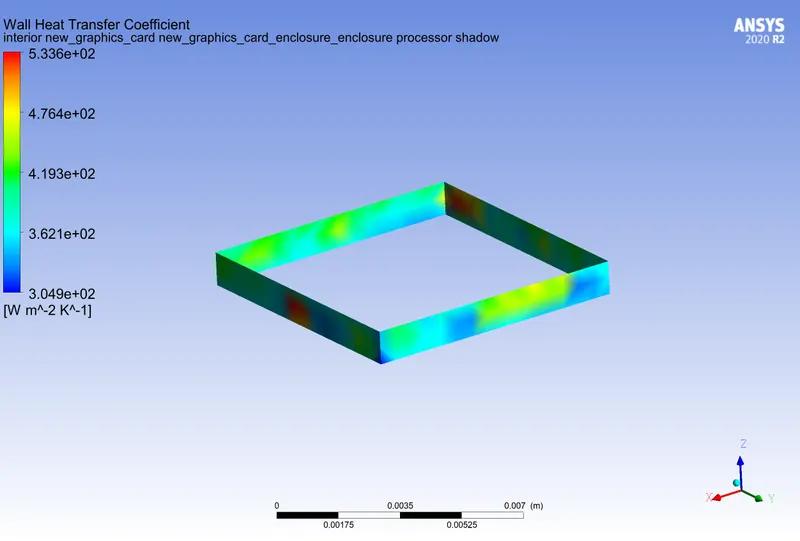
Localized HTC distribution at the Processor:
Case 2: Ambient Velocity 3m/s
Residuals:
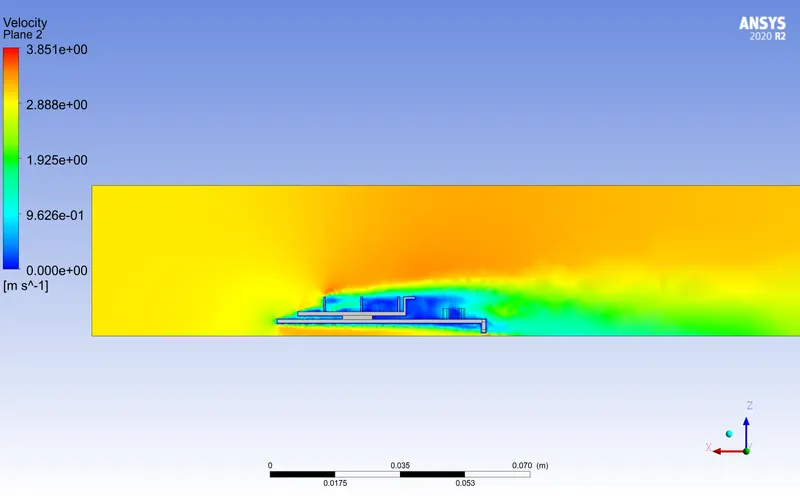
Global Velocity distribution:
Global Temperature distribution:
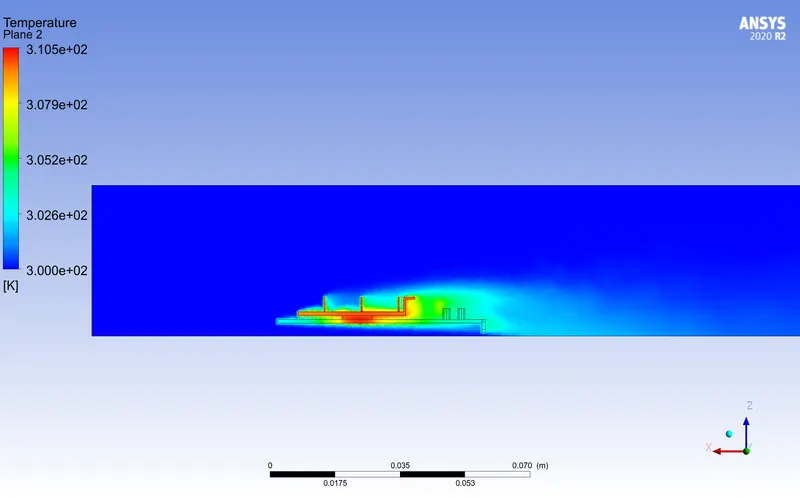
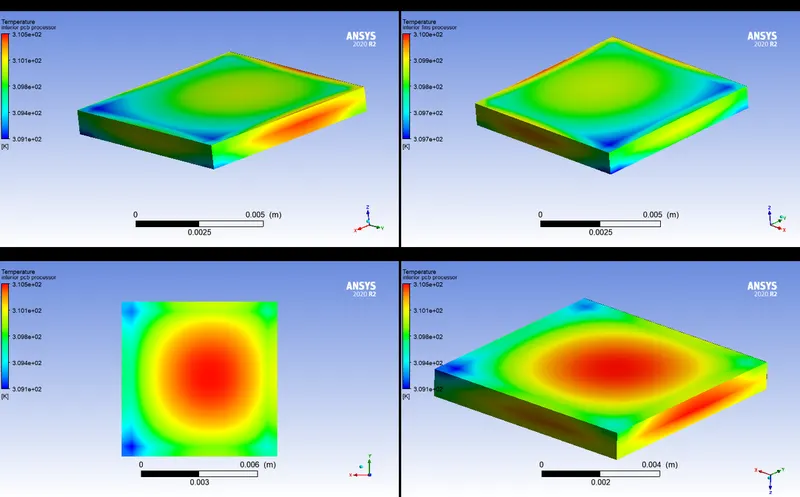
Localized Temperature distribution at the Processor:
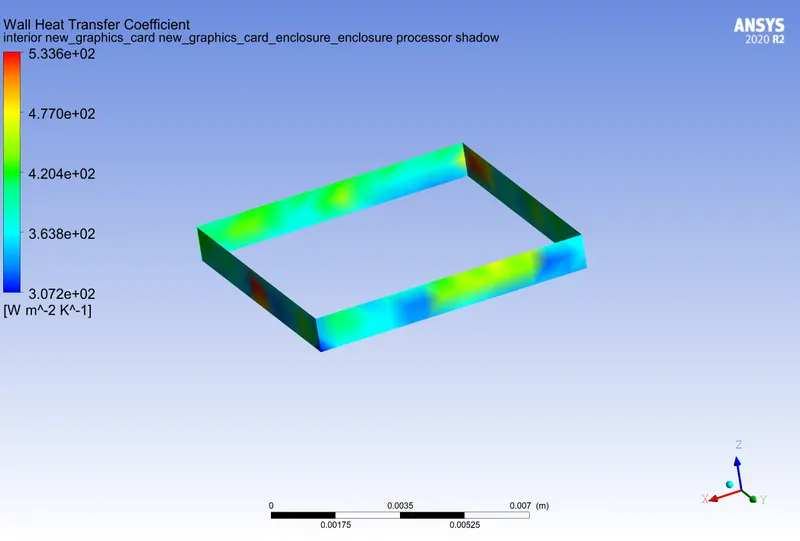
Localized HTC distribution at the Processor:
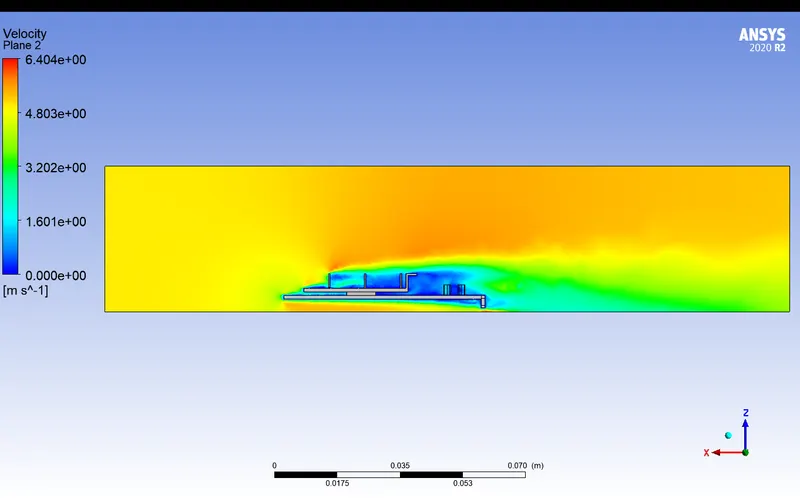
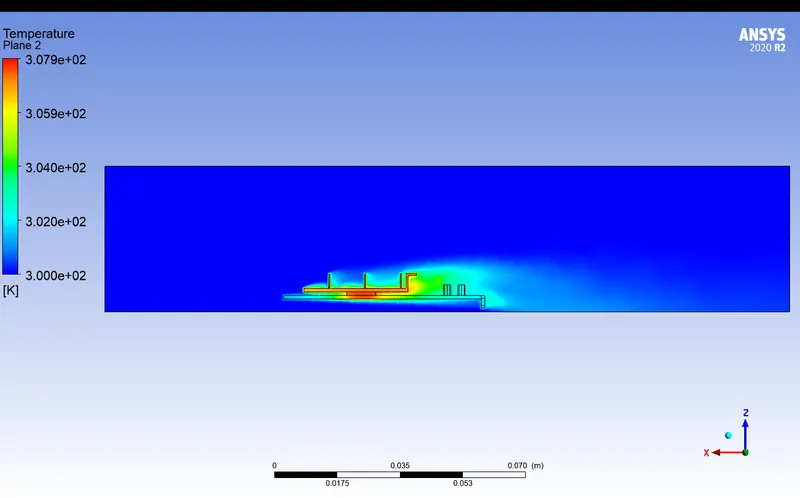
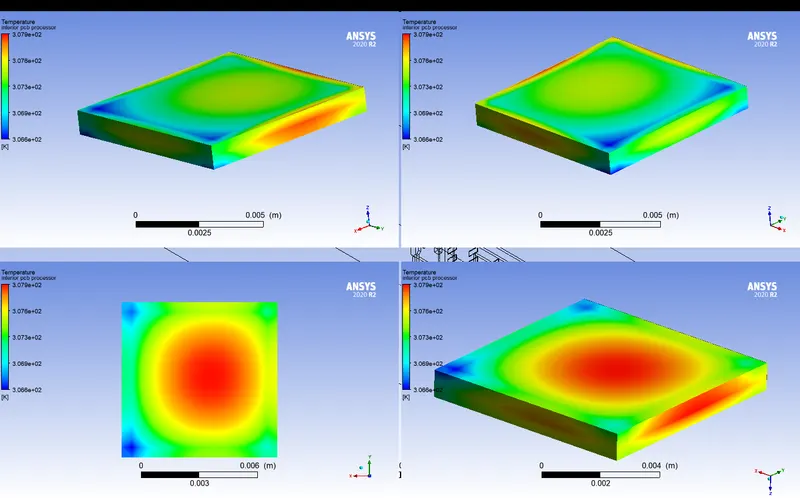
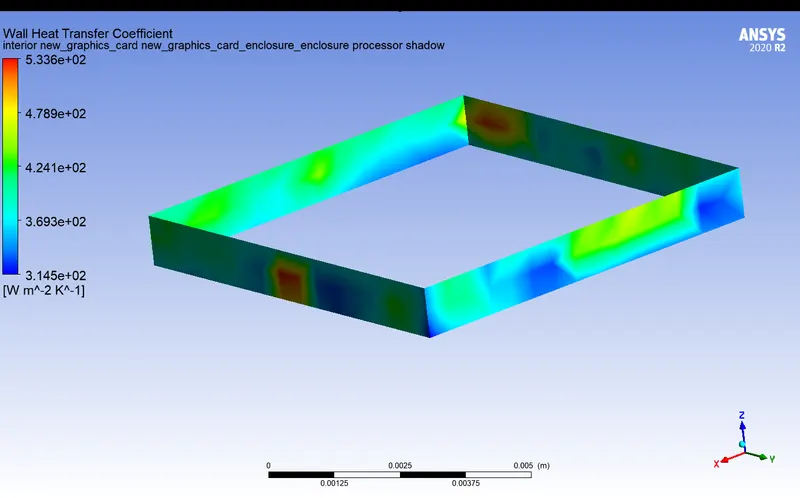
Case 3: Ambient Velocity 5m/s
Residuals:
Global Velocity distribution:
Global Temperature distribution:
Localized Temperature distribution at the Processor:
Localized HTC distribution at the Processor:
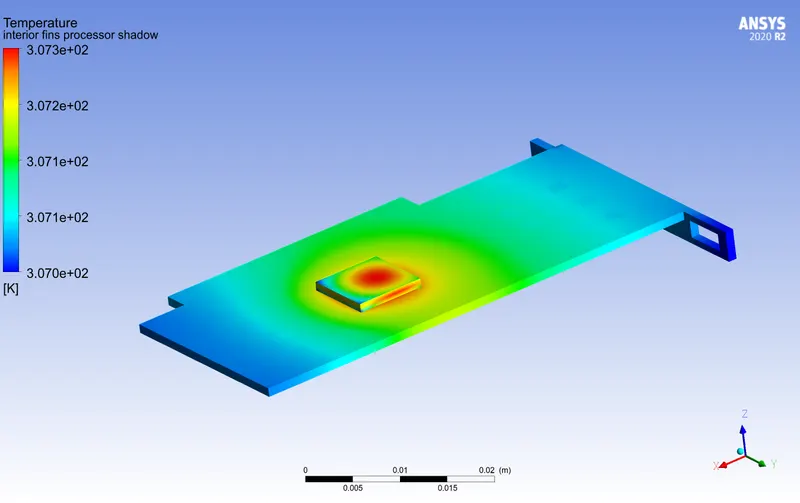
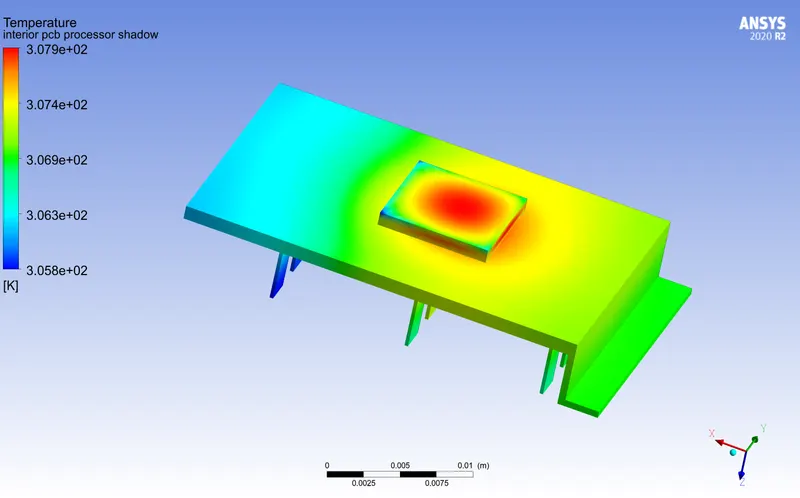
Potential Hotspots:
- Potential hotspots are the regions near the processor (SOC). The surface above it and below it experiences the highest thermal load.
Inferences:
| Cases | Peak Temperature Global K | Processor Peak Temperature K | Processor HTC W/m2.K |
| Case 1 - Velocity 1m/s | 319.8 | 319.4 | 304.9 to 533.6 |
| Case 2 - Velocity 3m/s | 310.5 | 310.5 | 307.2 to 533.6 |
| Case 3 - Velocity 5m/s | 307.9 | 307.9 | 314.5 to 533.6 |
- As the velocity of airflow is increased from 1 to 5 m/s, the temperature of the processor has decreased from 319.4 K to 307.9 K. Therefore, it is evident that higher velocities can help in controlling the temperature of the system.
- As the velocity of flow increases, the range Heat transfer coefficient has seen an increase which is in accordance with the drop in Temperature. This is due to increased heat transfer when velocity is increased.