Week 1- Mixing Tee
Mixing Efficiency of Tee
Aim:
1. To compare
Case 1 : Short Mixing Tee
Case 2 : Long Mixing Tee
and perform the following
- Velocity and temperature contour plots on the cut planes along and across the pipe.
- Velocity and temperature line plots along and across the length of the pipe.
- Perform Mesh independent study for any one case.
- Discuss the effect of length and momentum ratio on results.
Given Data:
Hot inlet temperature is 360C & the Cold inlet is at 190C.
Case 1:
- Short mixing tee with a hot inlet velocity of 3m/s.
- Momentum ratio of 2, 4.
Case 2 :
- Long mixing tee with a hot inlet velocity of 3m/s.
- Momentum ratio of 2, 4
Solution:
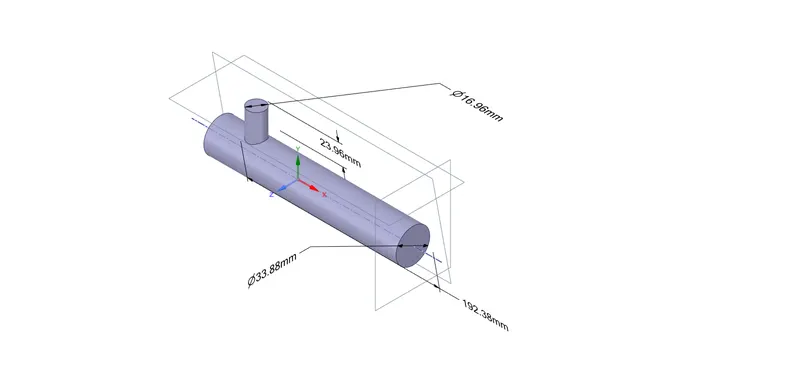
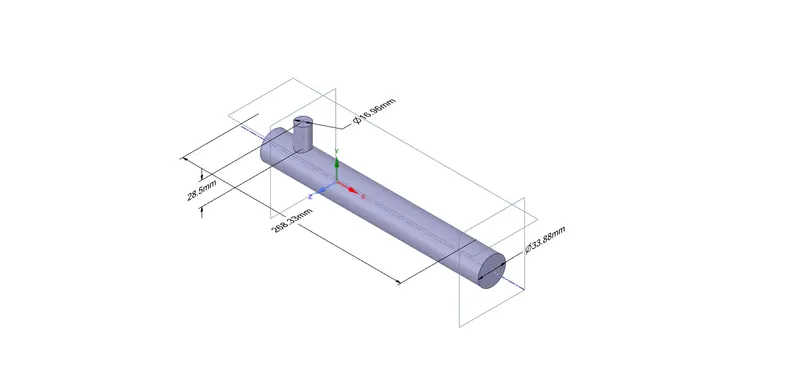
1. Geometry
Case 1 :
Case 2 :
2. Meshing
Mesh settings are kept default. Tetramesh is applied by default.
Case 1:
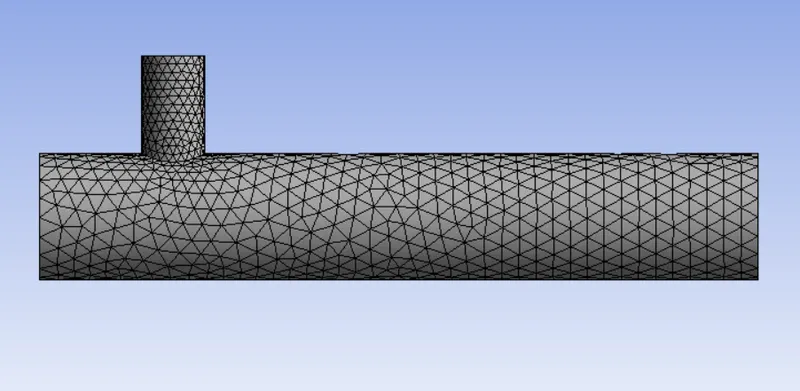

Each element size is 1.0219e-002 m
Case 2:
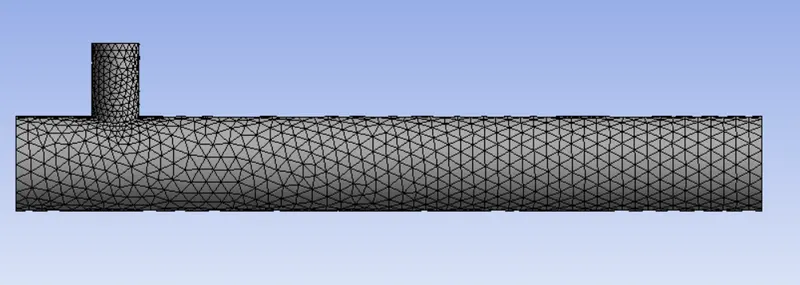
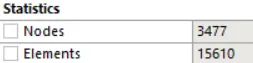
Each element size is 1.3853e-002 m
3. Working Fluid: Air
4. Turbulence Model used : K epsilon
Reason: K-omega is used for near wall modelling and particularly in case of low Re number. In our case, both of them are not required. Hence K epsilon is chosen.
5. Parametric Study for Grid Independence and Momentum Ratio
Case 1 :
- In this study the mesh element size is varied from 10mm to 2 mm at a step of 2 mm . There was no significant change in the result, initial 10mm mesh element size is good enough for an accurate result.
- Momentum Ratio is altered between 2 and 4 by altering the parameter 6 (cold inlet velocity) from 6 to 12 m/s.
- DP 0-5 shows MR 2 , DP 6-10 shows MR 4.

Case 2:
- Momentum Ratio is altered between 2 and 4 by altering the parameter 6 (cold inlet velocity) from 6 to 12 m/s.
- DP 0-5 shows MR 2 , DP 6-10 shows MR 4.
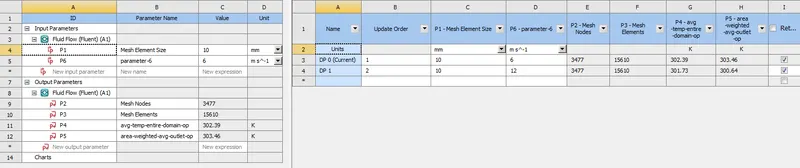
Comparision between Case 1 and Case 2:
|
Cell count |
Average outlet temperature |
Number of iterations for convergence |
|
| Case 1 | 12657 |
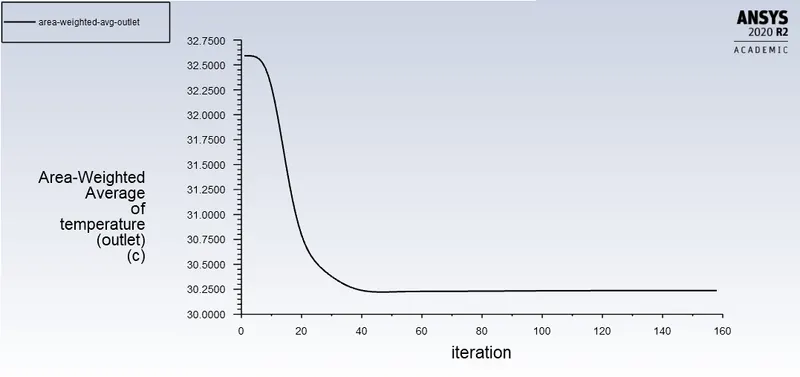
MR 2, 303.39 K MR 4, 300.68 K |
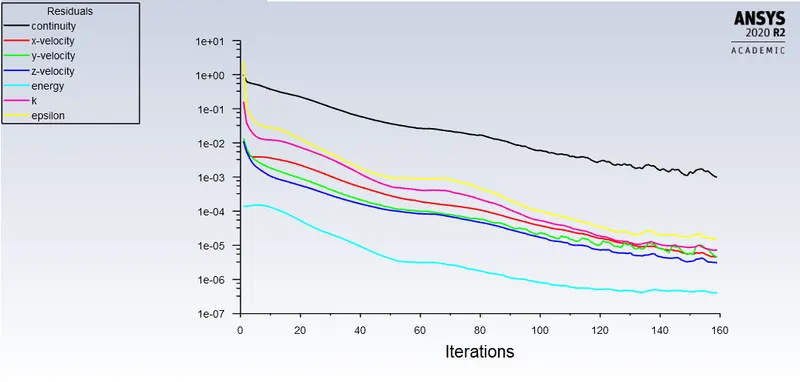
159 |
| Case 2 | 15610 |
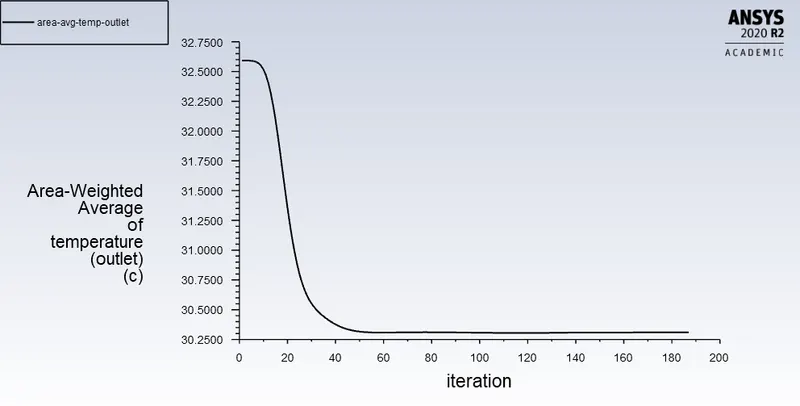
MR 2, 303.46 K MR 4, 300.64 K |
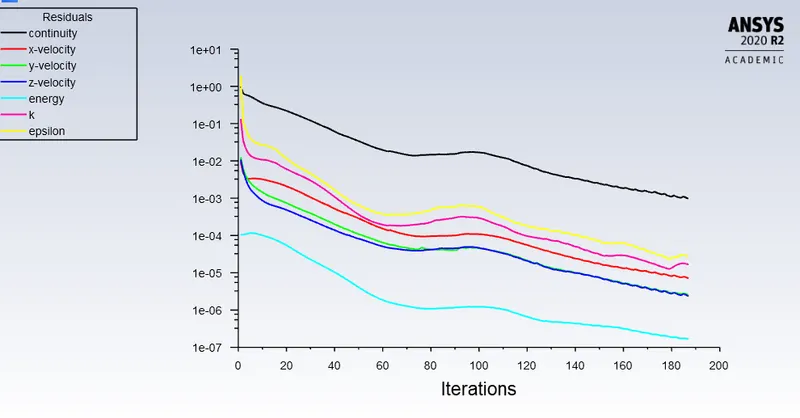
181 |
6. Residual Plot
Case 1:
Case 2:
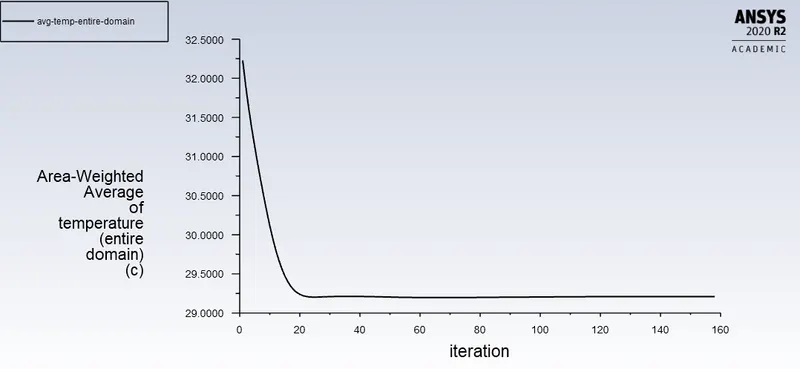
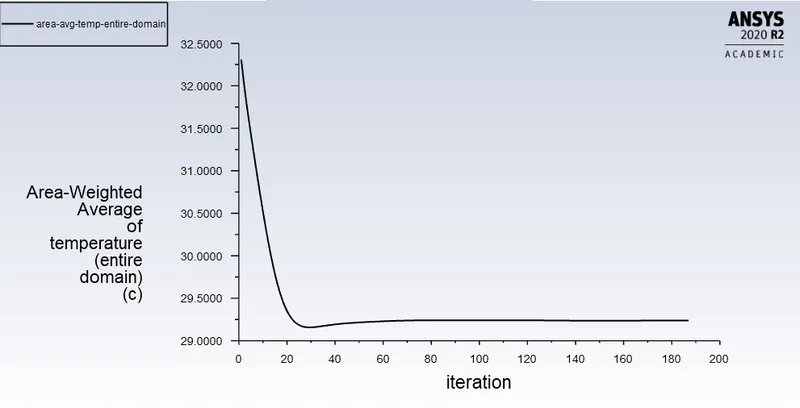
7. Area Avg. Temperature Plot for Entire Domain:
Case 1:
Case 2:
8. Area Avg. Temperature Plot for Outlet:
Case 1:
Case 2: 30.03 deg.C
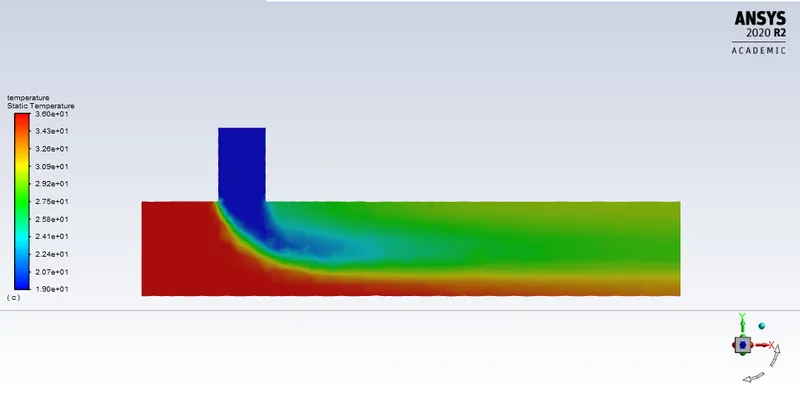
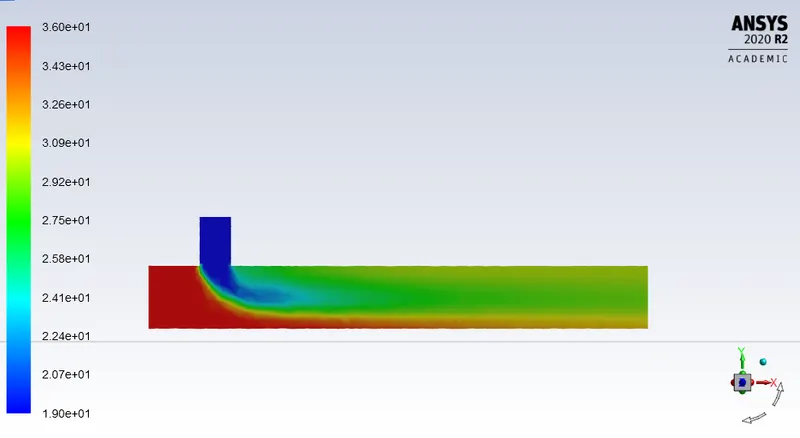
9. Temperature Contour:
Case 1:
Case 2:
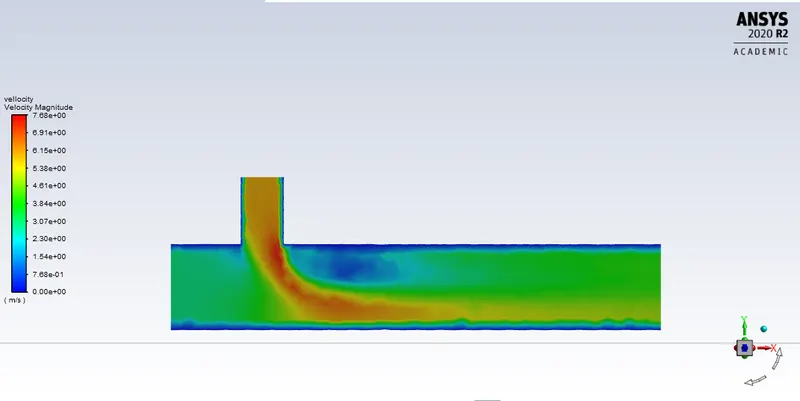
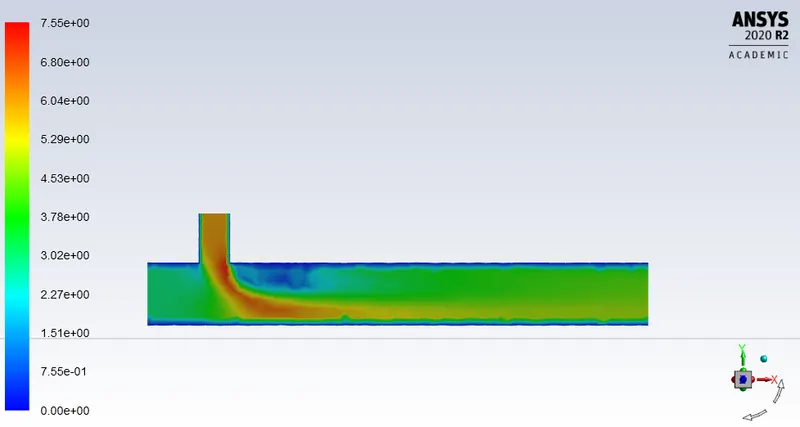
10. Velocity Contour:
Case 1:
Case 2:
Inference:
- As the length is increased, number of mesh elements is increasing and the iterations increases. Temperature also drops faster than the short length as the fluid needs a travel farther than the short tee.
- As the momentum ratio is increased, the temperature falls rapidly due to higher velocity.