Project 1 - Parsing NASA thermodynamic data
OBJECTIVES:
1. To extract the 14 coefficients and determine the specific heat, entropy, and enthalpy for each species in the data file.
2. To figure out what each species' molecular weight is.
3. To plot each species' local temperature range from low temperature to high temperature along with specific heat, enthalpy, and entropy.
INTRODUCTION:
File parsing is the process of extracting structured data from a file or stream. This is often accomplished by reading the file or stream and breaking it down into its constituent pieces, such as individual words, lines, or records. The retrieved data may subsequently be evaluated, altered, and used for a number of applications.
File parsing is extensively used in programming and computer science for tasks such as reading configuration files, parsing log files, and extracting data from web pages. Because there are several file formats and data kinds, the parsing procedure might differ based on the task's unique needs.
EQUATIONS:
The equations that we are going to use in the Functions to calculate cp, H,S are:
EXPLANATION:
- At first, the value of 'R' is defined.
- The file 'THERMO.dat' is then retrieved using a command.
- Next, we use 'fgetl' to begin retrieving the lines and, after processing the first two lines, convert the strings to numbers and allocate global (low, mid, and high) temperatures from the second line.
- For computation and graphing purposes, the command 'findstr' was used to obtain the temperature range.
- Again, use the 'fgetl' command again, to skip the next three lines.
- Furthermore, using a for loop, to get the 53 species, their temperatures (low, medium, and high), and the 14 coefficients.
- Subsequently by using the fgetl command to navigate to the next line and get the first seven coefficients, which were saved. Similarly, continue on to the next two lines for retrieving the remaining coefficients with the fgetl command.
- Finally, after obtaining the 14 coefficients, we apply these coefficients to the functions and determine cp, H and S.
- The Molecular weight function was used to obtain the species' molecular weight.
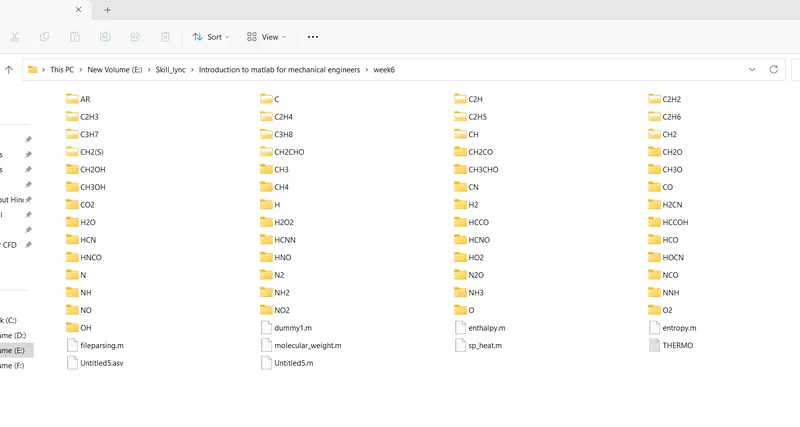
In addition, a script to alter the directory so that the file could be saved in a specific location. - After changing the directory, 'mkdir' was used to create a new folder with the current species' name and then 'cd' to create mkdir the current directory.
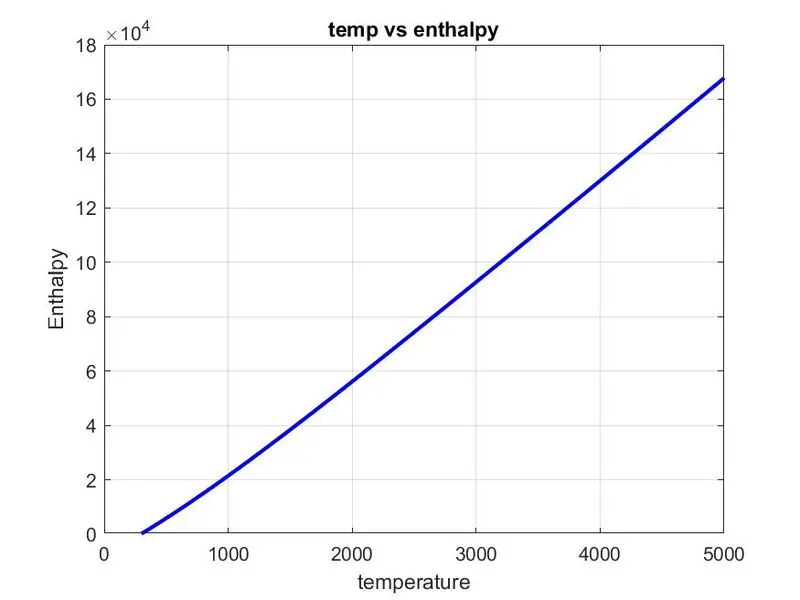
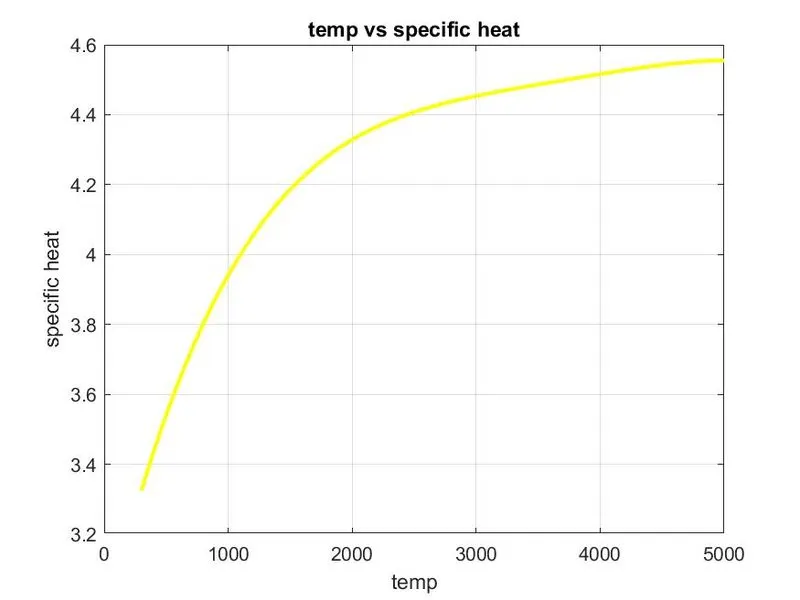
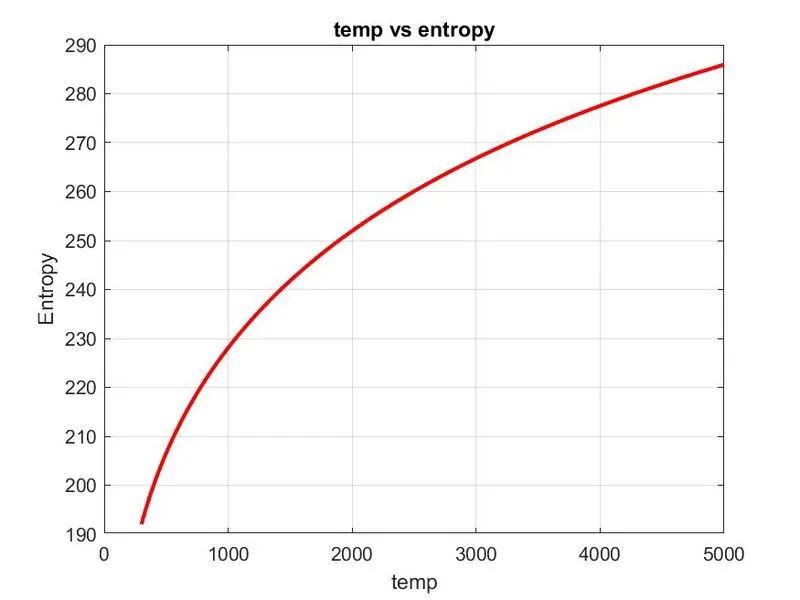
- The plot command is then used to plot temperature versus (cp, enthalpy, entropy). In this plotting, the figure command is utilized to acquire the three different plots and the save as command to save the figures in the folder.
- Moreover, the change in the directory was done to restart the loop. So the loop continues until we get all 53 species and then it is halted.
MAIN CODE:
clear all
close all
clc

%Reading the header from Thermo data file
f1 = fopen('THERMO.dat','r');
line1 = fgetl(f1);
disp(line1);
line2 = fgetl(f1);
disp(line2);
Header = strsplit(line2,' ');
R = 8.314;
global_low_temp = str2num(Header{2})
global_mid_temp = str2num(Header{3})
global_high_temp = str2num(Header{4})
for i = 1:3
  info_line =  fgetl(f1);
  disp(info_line)
end
%Reading the species block from THERMO data file

for i = 1:53
    Line1 = fgetl(f1);
    species_desc = strsplit(Line1,' ');
    species_name = species_desc{1};

    a= flip(species_desc);

    local_low_temp = str2num(a{4});
    local_high_temp = str2num(a{3});
    local_mid_temp = str2num(a{2});

    temp = linspace(local_low_temp, local_high_temp,500);

    Line2 = fgetl(f1);
    a = findstr(Line2, 'E');
     Line3 = fgetl(f1);
    b = findstr(Line3, 'E');
     Line4 = fgetl(f1);
    c = findstr(Line4, 'E');

    %High temperature coefficients
    a1 = str2double(Line2(1:a(1)+3));
    a2 = str2double(Line2(a(1)+4:a(2)+3));
    a3 = str2double(Line2(a(2)+4:a(3)+3));
    a4 = str2double(Line2(a(3)+4:a(4)+3));
    a5 = str2double(Line2(a(4)+4:a(5)+3));
    a6 = str2double(Line3(1:b(1)+3));
    a7 = str2double(Line3(b(1)+4:b(2)+3));

    %Low temeprature coefficients
    b1 = str2double(Line3(b(2)+4:b(3)+3));
    b2 = str2double(Line3(b(3)+4:b(4)+3));
    b3 = str2double(Line3(b(4)+4:b(5)+3));
    b4 = str2double(Line4(1:c(1)+3));
    b5 = str2double(Line4(c(1)+4:c(2)+3));
    b6 = str2double(Line4(c(2)+4:c(3)+3));
    b7 = str2double(Line4(c(3)+4:c(4)+3));

    specific_heat =  sp_heat(a1,a2,a3,a4,a5,b1,b2,b3,b4,b5,temp,local_mid_temp);
    enthalpy1 = enthalpy(a1,a2,a3,a4,a5,a6,b1,b2,b3,b4,b5,b6,R,temp,local_mid_temp);
    entropy1 = entropy(a1,a2,a3,a4,a5,a7,b1,b2,b3,b4,b5,b7,R,temp,local_mid_temp);
    Mw = molecular_weight(species_name);

    figure(1)
    plot(temp,enthalpy1,'linewidth',2,'color','b')
    title('temp vs enthalpy')
    xlabel('temperature')
    ylabel('Enthalpy')
    grid on


    figure(2)
    plot(temp,entropy1,'linewidth',2, 'color','r')
    title('temp vs entropy')
    xlabel('temp')
    ylabel('Entropy')
    grid on


    figure(3)
    plot(temp,specific_heat,'linewidth',2,'color','y')
    title('temp vs specific heat')
    xlabel('temp')
    ylabel('specific heat')
    grid on

    mkdir(species_name);
    %directory=(['E:Skill lync', species_name]);
    cd(species_name);

    saveas(1,'enthalpy.jpg')
    saveas(2,'entropy.jpg')
    saveas(3,'specific_heat.jpg')
    cd  ..
 disp(['molecular weight of ',species_name]);
 disp(Mw)
end
FUNCTION CODE FOR ENTHALPY, ENTROPY, SPECIFIC HEAT AND MOLECULAR WEIGHT
ENTHALPY:
function[h] = enthalpy(a1,a2,a3,a4,a5,a6,b1,b2,b3,b4,b5,b6,R,temp,local_mid_temp)
if temp <= local_mid_temp
    h = R*temp.*(b1+ (b2.*(temp./2))+ (b3.*(((temp).^2)./3))+ (b4.*(((temp).^3)./4))+ (b5.*(((temp).^4)./5)) + b6./temp);
else
   h = R*temp.*(a1+ (a2.*(temp./2))+ (a3.*(((temp).^2)./3))+ (a4.*(((temp).^3)./4))+ (a5.*(((temp).^4)./5)) + a6./temp);
end
end-
function [H] = enthalpy_H(a1,a2,a3,a4,a5,a6,b1,b2,b3,b4,b5,b6,temp,local_mid_temp,r) - function is used to make the code easy to implement ,it is a group of statements that together perform a task
-
if(temp<=local_mid_temp) - comparing matrix values of the temperature generated from the linspace command with the global medium temperature
-
H = r*temp.*(b1 + ((b2*temp)/2) + ((b3*(temp).^2)/3) + ((b4*(temp).^3)/4) + ((b5*(temp).^4)/5) + ((b6./temp))); - calculation of the enthalpy wrt to the equations
-
else - else statement to perform the task if the if statements fail
-
H = r*temp.*(a1 + ((a2*temp)/2) + ((a3*(temp).^2)/3) + ((a4*(temp).^3)/4) + ((a5*(temp).^4)/5) + ((a6./temp))); - calculation of the enthalpy wrt to the equations
ENTROPY:
function[s] = entropy(a1,a2,a3,a4,a5,a7,b1,b2,b3,b4,b5,b7,R,temp,local_mid_temp)
if temp<= local_mid_temp
    s = R.*(b1.*log(temp) + (b2.*temp) + (b3.*(((temp).^2)./2)) + (b4.*(((temp).^3)./3)) + (b5.*(((temp).^4)./4)) + b7);
else
    s = R.*(a1.*log(temp) + (a2.*temp) + (a3.*(((temp).^2)./2)) + (a4.*(((temp).^3)./3)) + (a5.*(((temp).^4)./4)) + a7);
end-
function [S] = entropy_S(x1,x2,x3,x4,x5,x7,x8,x9,x10,x11,x12,x14,temp,local_mid_temp)
the function is used to make the code easy to implement it is a group of statements that together perform a task
-
if(temp<=local_mid_temp - comparing matrix values of the temperature generated from the linspace command with the global medium temperature
-
S = r.*(b1.*log(temp) +b2.*temp) +(b3*((temp).^2)/2) + (b4*((temp).^3)/3) + (b5*((temp).^4)/4) + (x14)); - calculation of the entropy wrt to the equations
-
else - else statement to perform the task if the if statements fail
-
S = r.*(a1.*log(temp) +(a2.*temp) +(a3*((temp).^2)/2) + (a4*((temp).^3)/3) + (a5*((temp).^4)/4) + (a6)); - calculation of the entropy wrt to the equations
-
end - to end or terminate the function
SPECIFIC HEAT:
function[c_p] = sp_heat(a1,a2,a3,a4,a5,b1,b2,b3,b4,b5,temp,local_mid_temp)
if temp <= local_mid_temp
    c_p = (b1+ (b2.*temp)+ (b3.*((temp).^2))+ (b4.*((temp).^3))+ (b5.*((temp).^4)));
else
    c_p = (a1+ (a2.*temp)+ (a3.*((temp).^2))+ (a4.*((temp).^3))+ (a5.*((temp).^4)));
end
end
Explanation of the above code: -
- function [Cp] = Specific_heat(a1,a2,a3,a4,a5,a6,b1,b2,b3,b4,b5, temp,local_mid temperature,r) - function is used to make the code easy to implement,it is a group of statements that together perform a task
- if(temp<=gb_m) - comparing matrix values of the temperature generated from the linspace command with the global medium temperature
- Cp = r.*(b1 +(b2.*temp) +(b3*(temp).^2) + (b4*(temp).^3) + (b5*(temp).^4)); - calculation of the Specific heat wrt to the equations
- else - else statement to perform the task if the if statements fail
- Cp = r.*(a1 +(a2.*temp) +(a3*(temp).^2) + (a4*(temp).^3) + (a5*(temp).^4)); - calculation of the Specific heat wrt to the equations
MOLECULAR WEIGHT:
function[Mw] = molecular_weight(species_name)

elements = ['H', 'C', 'N', 'O', 'A'];
atomic_weight = [1, 12, 14, 16, 40];

Mw = 0;
for i = 1:length(species_name)
    for j = 1:length(elements)
       if strcmp(species_name(i), elements(j))
        Mw = Mw + atomic_weight(j);
        a = j;
       end
    end

n = str2double(species_name(i));
if n>1
    Mw = Mw+ atomic_weight(a)*(n-1);
end
end
end
Explanation of the above code: -
- function mw = molecular_weight(sp_name)
- compound_name = (sp_name)
- creating an array of elements
- value_at = [12.0107 1.00794 15.994 14.0067 39.948]; - storing the atomic mass value in the array
- mw =0 ; -asssigning molecular mass as 0
- for i = 1:length(compound_name) - creating for loop to execute till the elements lenght
- for j = 1:length(key_at) - creating for loop to execute till the key_at array length
- if strcmp(compound_name(i),key_at(j)) - comparing the string value of the species name and the elemts in the array key_at
- mw =mw + value_at(j); - molecular mass calculation
- pos = j; - storing the position
- end - to terminate the if statement
- end - to terminate the inner for j loop
- n = str2double(compound_name(i)); - converting the srting to number
- if(n>1)
- fprintf('Molecular Weight of the species %s is %f',compound_name ,mw) - to print the species name and value
Error faced during the development of the code: -
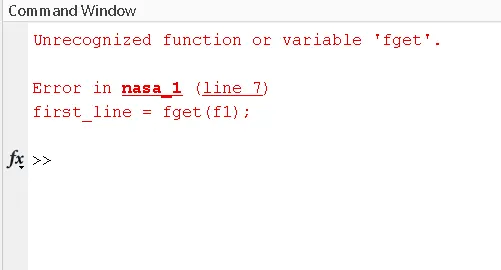
1) unrecognized function on debugging it was due to wrong command name fgetl was used instead
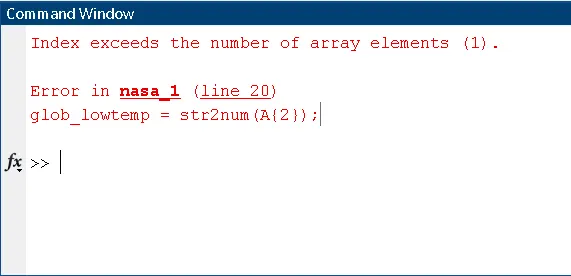
2)On debugging was found was due to the missing of space in strsplit command
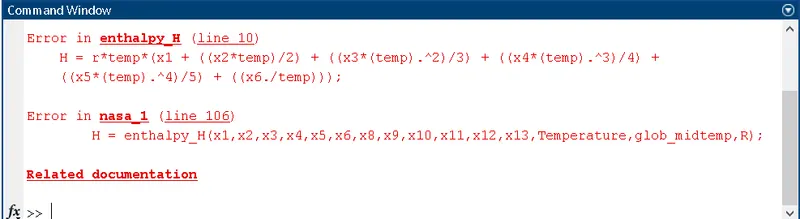
3)On Debugging for the code found that the dot operator as missing
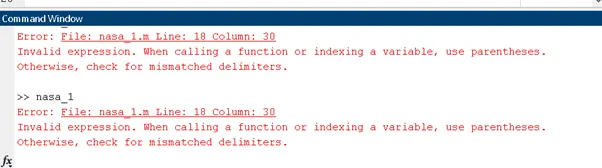
5)On Debugging for the code found that the brackets were missing in the command
- Screenshot of the folder:
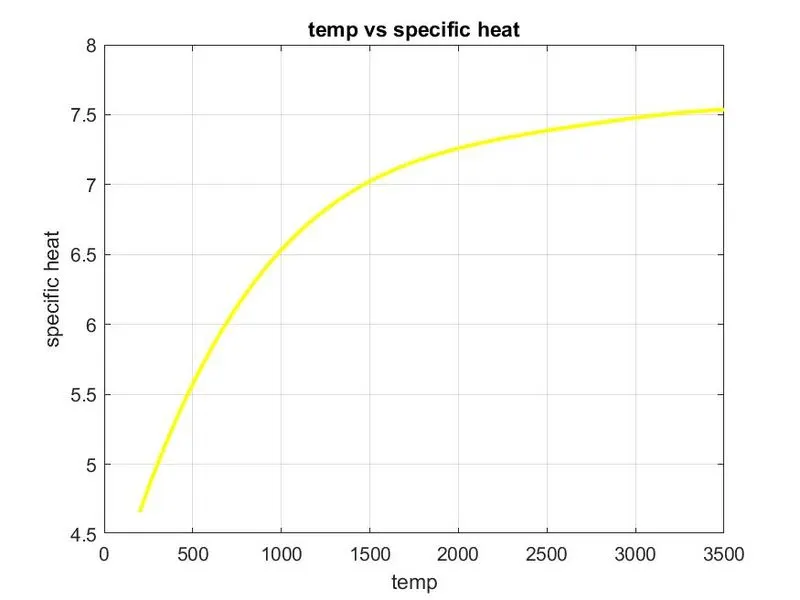
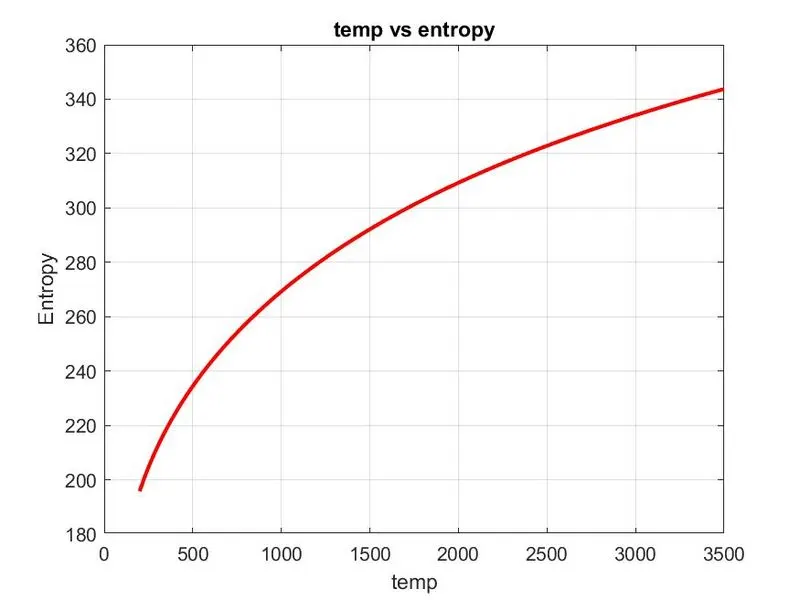
Output for the plots of N2 , O2, and CO2 for the Enthalpy Specific Heat and Entropy:-
Blue color plot - Variation in Enthalpy wrt temperature
Yellow color plot - Variation in Specific Heat wrt temperature
Red color plot -Variation in Entropy wrt temperature
1)Plots for N2
 |
 |
 |
2)Plots for O2
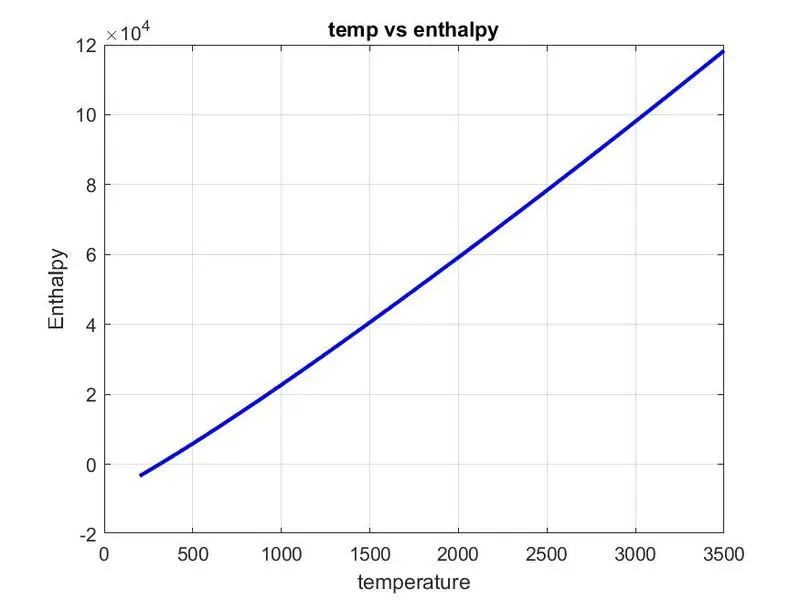 |
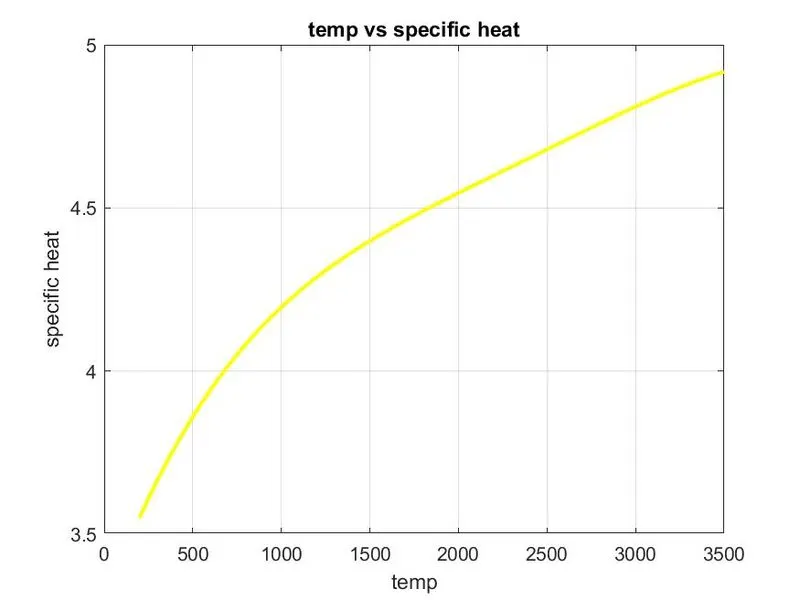 |
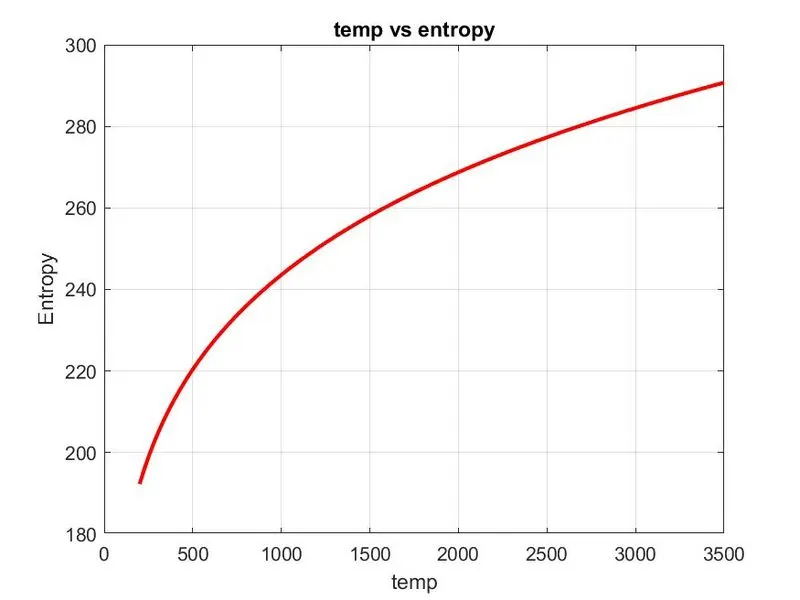 |
3)Plots for CO2
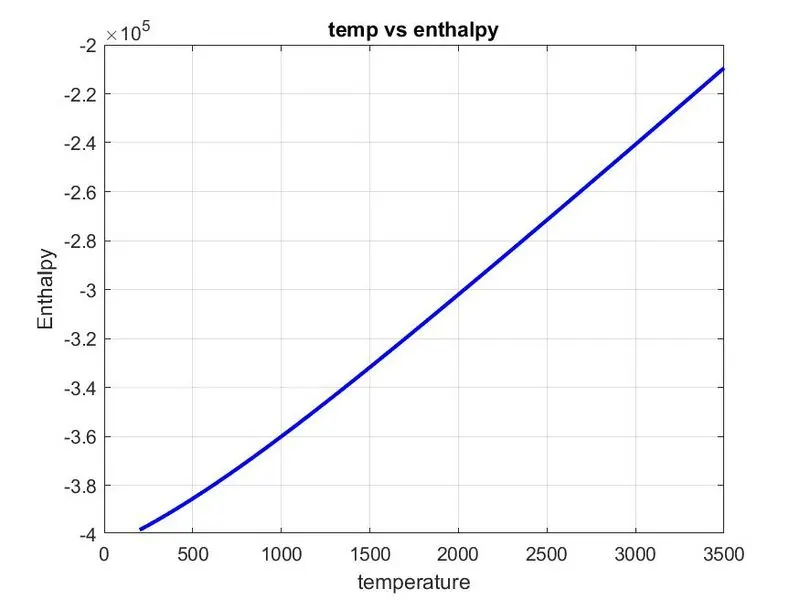 |
 |
 |
OUTPUT
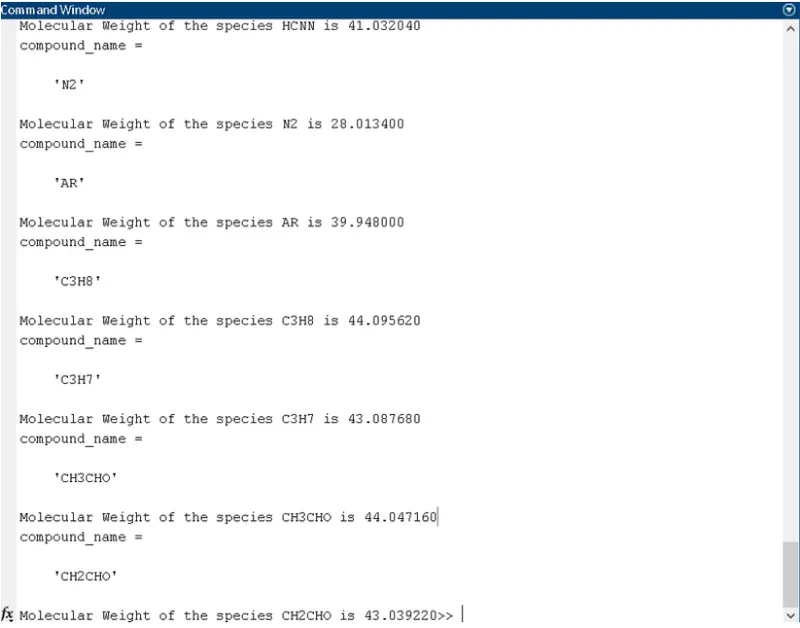
Output for molecular weight is displayed along with the name for each species.
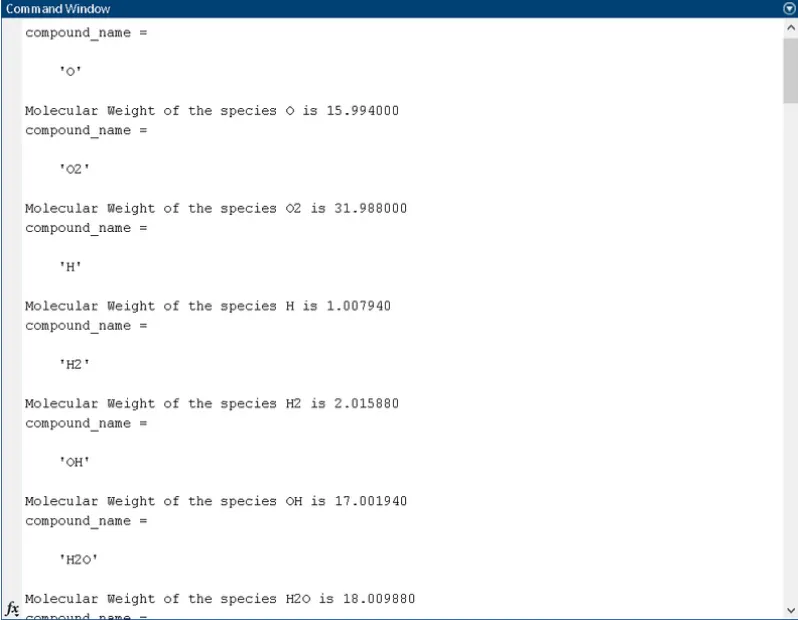
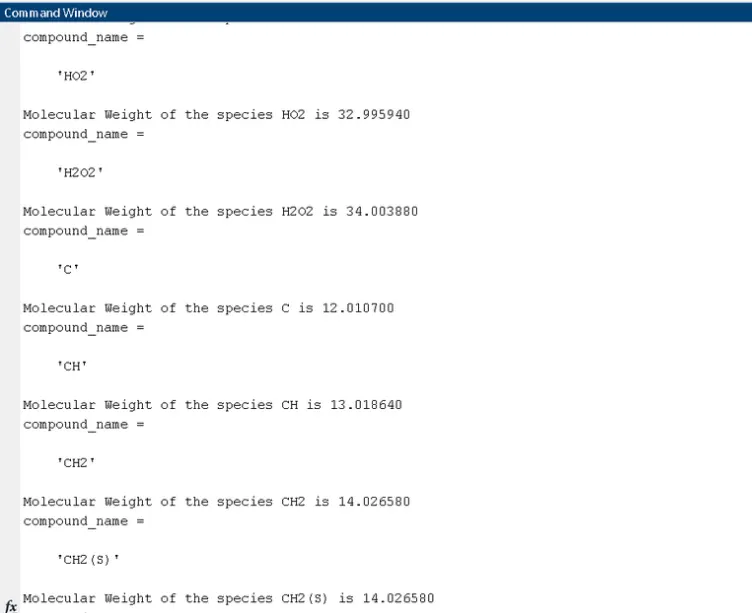
upto AR and CH2CHO
Conclusion: -
- Parsing of the file was done with the plot generation
- To plots for 53 molecules were generated
- All three plots(Cp, H, S) were saved in a folder for a molecule
- Molecular weight is generated for the 53 molecules in the command window