NASA Thermodynamic Data
FILE PARSING AND PLOTTING OF NASA THERMODYNAMIC DATA
AIM:
- Write a program in MATLAB to parse a NASA thermodynamic file and plot the calculated results.
- The program should automatically create a folder and save the plots according to compound, in the respective sub-folder.
GOVERNING EQUATIONS:
- The following equations were used for the computation of specific heat, enthalpy and entropy at specified temperature ranges.
`C_p/R=a_1+a_2T+a_3T^2+a_4T^3+a_5T^4`_____(1)
`H/(RT)=a_1+a_2T/2+a_3T^2/3+a_4T^3/4+a_5T^4/5+a_6/T`_____(2)
`S/R=a_1lnT+a_2T+a_3T^2/2+a_4T^3/3+a_5T^4/4+a_7`_____(3)
where `S,C_p,H` are entropy , specific heat and enthalpy at specified `T` temperatures.
OBJECTIVES OF THE PROJECT:
- A set of commands were used to access the file and extract local temperature ranges and 14 coefficients of each compound.
- A function was created for the computation of all the required parameters in the low and high temper temperature regime.
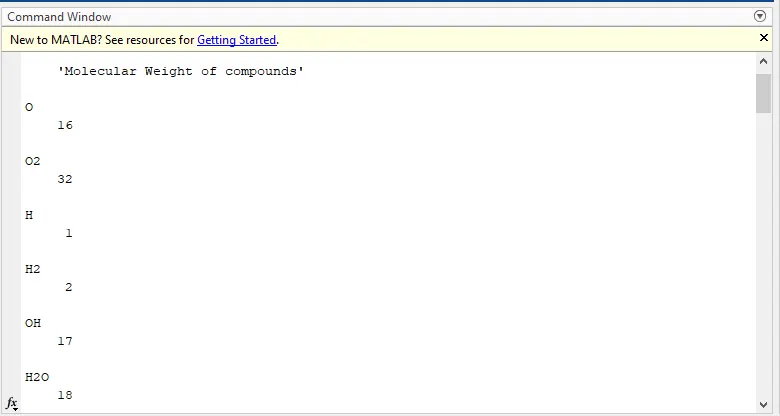
- The molecular weight of each compound was calculated and printed in the command window.
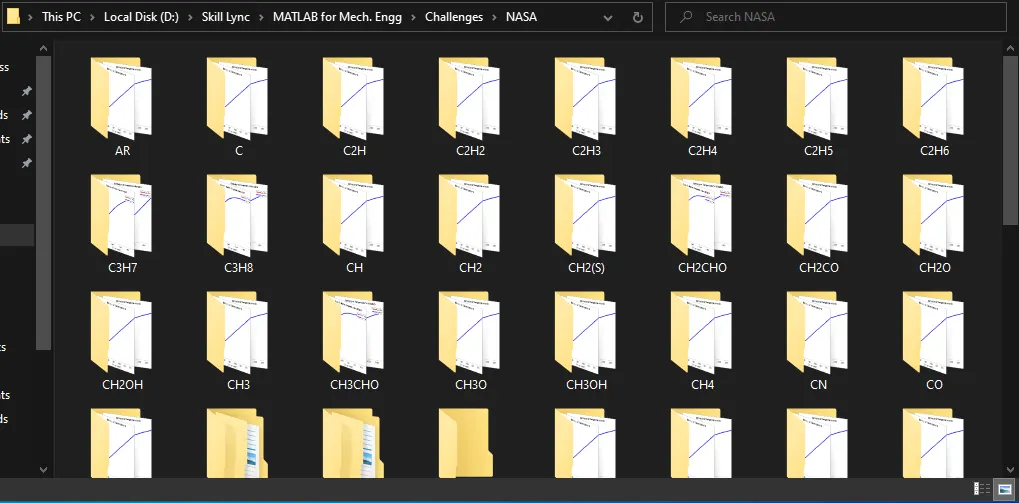
- Each frame for each compound's graphs are plotted, extracted and stored in a folder in the same directory as the MATLAB code.
BODY OF THE CONTENT:
- Code:
-
clear all,close all,clc
%Program to parse NASA thermodynamic cata files and plot variation of
%specific heat,enthalpy and entropy as a function of temperature

%fopen command is used to open the file data, and assign a varible f1
%'r' command is the syntax is for reading the file
f1=fopen('THERMO.dat','r');
%fgetl command is used to extract the first line of the f1 file pointer
fgetl(f1);
%Applying the fgetl again gives the subsequent line, as a string, save in a
a=fgetl(f1);
%strsplit command is used to split the string and store in array of strings
%after whichever charachter specified. Here charachter specified is
%'space'. The split strings are stored in cell arrays.
A=strsplit(a,' ');
%str2num command is used to convert the string of numbers into numeric and
%save in the specified variables
global_lowtemp=str2num(A{2});
global_midtemp=str2num(A{3});
global_hightemp=str2num(A{4});
fgetl(f1);
fgetl(f1);
fgetl(f1);
%A loop is run to extract all the content and coefficient data for the 53 compounds
for i=1:53
   b=fgetl(f1);
   B=strsplit(b,' ');
   %Each respective data is extracted using the respective commands.
   species(i)=B(1);
   localtemp(i,1)=str2num(B{end-3});
   localtemp(i,2)=str2num(B{end-2});
   localtemp(i,3)=str2num(B{end-1});
   %The data in this section involves coefficients. Therefore, the data is
   %split after the exponent character. And the respective coefficient
   %values are extracted from the initial index to the 3 places after
   %the exponent character.
   c=fgetl(f1);
   ce=findstr(c,'E');
   %k variable is used to store the updated values of the starting index
   %of coefficients
   k=1;
   for j=1:length(ce)
      coeff(i,j)=str2num(c(k:ce(j)+3));
      k=ce(j)+4;
   end
   %Similar steps are followed to extract the coefficients from the next line
   c=fgetl(f1);
   ce=findstr(c,'E');
   k=1;
   for j=1:length(ce)
      coeff(i,j+5)=str2num(c(k:ce(j)+3));
      k=ce(j)+4;
   end
   c=fgetl(f1);
   ce=findstr(c,'E');
   k=1;
   for j=1:length(ce)
      coeff(i,j+10)=str2num(c(k:ce(j)+3));
      k=ce(j)+4;
   end

end
%Calculations of specific heat,entropy and enthalpy
   [cplow,cphigh,hlow,hhigh,slow,shigh]=cphsfunc(coeff,localtemp);


%Molecular Weight calculation of all compounds
%Two arrays are made to store the character and respective
%molecular weight of element with corresponding indices.
element_list={'H','C','N','O','S','A'};
element_molwt=[1,12,14,16,32,40];
%A loop is run over all the compounds and each character
%is compared using strcmp, and the respective weigths are input
%and stored in species_wt
 for i=1:53
     mol_wt=0;
     compound=char(species(i));
     for p=1:length(compound)
     for j=1:length(element_list)
        if strcmp(compound(p),element_list(j))
           mol_wt= mol_wt+element_molwt(j);
           k=j;
        end
     end
     %str2double is used to convert numbers in strings to double
     %If the scanned number is greater than one, the previous
     %element scanned is added n-1 times
     n=str2double(compound(p));
     if n>1
     mol_wt=mol_wt+(n-1)*element_molwt(k);
     end
     end
     species_wt(i)=mol_wt;
 end

%Plotting and Saving in Folder
%ct is defined to store frame number
ct=1;
for i=1:53
   %A directory is named with repective compound names
   data=sprintf('%s',char(species(i)));
   %pwd gives the current directory path
   current_dir=pwd;
   %mkdir creates a new directory of the defined name
   %at the current address
   mkdir(data);
   %cd is used to enter the specified directory
   cd(data);
   %fugures are numbered,plotted,labelled and titled
   figure(ct);
   x=linspace(localtemp(i,1),localtemp(i,3),500);
   y=linspace(localtemp(i,3),localtemp(i,2),500);
   hold on;
   plot(x,cplow(i,:),'color','r','linewidth',3);
   plot(y,cphigh(i,:),'color','b','linewidth',3);
   hold off;
   xlabel('Temperature [K]');
   ylabel('Specific Heat [kJ/kg.K]');
   legend('Low Temp','High Temp','Location','northwest');
   title(['Specific Heat vs Temperature for ',char(species(i))]);
   %getframe command is used to capture the frame of the flot
   getframe(gcf);
   %saveas is used to save the plot with the assigned name
   saveas(ct,'Cp.png');
   ct=ct+1;
   %similar procedure is used to plot the remaining graphs
   figure(ct);
   hold on;
   plot(x,hlow(i,:),'color','r','linewidth',3);
   plot(y,hhigh(i,:),'color','b','linewidth',3);
   hold off;
   xlabel('Temperature [K]');
   ylabel('Enthalpy [kJ]');
   legend('Low Temp','High Temp','Location','northwest');
   title(['Enthalpy vs Temperature for ',char(species(i))]);
   getframe(gcf);
   saveas(ct,'H.png');
   ct=ct+1;
   figure(ct);
   hold on;
   plot(x,slow(i,:),'color','r','linewidth',3);
   plot(y,shigh(i,:),'color','b','linewidth',3);
   hold off;
   xlabel('Temperature [K]');
   ylabel('Entropy [kJ/K]');
   legend('Low Temp','High Temp','Location','northwest');
   title(['Entropy vs Temperature for ',char(species(i))]);
   getframe(gcf);
   saveas(ct,'S.png')
   %cd is used to current directory of the matlab code, for execution
   cd(current_dir);
   ct=ct+1;
 end
%Following commands are used for printing of the calcultaed molecular weights
%of compounds
 sprintf('Molecular Weight of compounds')
for i=1:53
   %disp() is used to display the specified text in command window
   disp(char(species(i)))
   disp(species_wt(i))
end
- Explanation of code algorithm:
- File Parsing:
-
clear all,close all,clc %Program to parse NASA thermodynamic cata files and plot variation of %specific heat,enthalpy and entropy as a function of temperature %fopen command is used to open the file data, and assign a varible f1 %'r' command is the syntax is for reading the file f1=fopen('THERMO.dat','r'); %fgetl command is used to extract the first line of the f1 file pointer fgetl(f1); %Applying the fgetl again gives the subsequent line, as a string, save in a a=fgetl(f1); %strsplit command is used to split the string and store in array of strings %after whichever charachter specified. Here charachter specified is %'space'. The split strings are stored in cell arrays. A=strsplit(a,' '); %str2num command is used to convert the string of numbers into numeric and %save in the specified variables global_lowtemp=str2num(A{2}); global_midtemp=str2num(A{3}); global_hightemp=str2num(A{4}); fgetl(f1); fgetl(f1); fgetl(f1); %A loop is run to extract all the content and coefficient data for the 53 compounds for i=1:53 b=fgetl(f1); B=strsplit(b,' '); %Each respective data is extracted using the respective commands. species(i)=B(1); localtemp(i,1)=str2num(B{end-3}); localtemp(i,2)=str2num(B{end-2}); localtemp(i,3)=str2num(B{end-1}); %The data in this section involves coefficients. Therefore, the data is %split after the exponent character. And the respective coefficient %values are extracted from the initial index to the 3 places after %the exponent character. c=fgetl(f1); ce=findstr(c,'E'); %k variable is used to store the updated values of the starting index %of coefficients k=1; for j=1:length(ce) coeff(i,j)=str2num(c(k:ce(j)+3)); k=ce(j)+4; end %Similar steps are followed to extract the coefficients from the next line c=fgetl(f1); ce=findstr(c,'E'); k=1; for j=1:length(ce) coeff(i,j+5)=str2num(c(k:ce(j)+3)); k=ce(j)+4; end c=fgetl(f1); ce=findstr(c,'E'); k=1; for j=1:length(ce) coeff(i,j+10)=str2num(c(k:ce(j)+3)); k=ce(j)+4; end end - Firstly, the files are opened into 'read only mode' and taken into a pointer. Each line is extracted, and the necessary ones are only input in a variable as a string. strsplit command is used to split the string on the specified segments. The global temperature values are recorded and the str2num command is used to convert the character array into a number. The unnecessary lines are skipped using fget() and a loop is run to extract the local temperatures, compound names and 14 coefficients of each compound. A specified update on the variable k is used for indexing of each coefficient, and converting into number. Three lines of coefficients are specified for each compound, and hence three loops for each extraction is applied.
- Molecular weight calculation and Printing:
-
%Molecular Weight calculation of all compounds %Two arrays are made to store the character and respective %molecular weight of element with corresponding indices. element_list={'H','C','N','O','S','A'}; element_molwt=[1,12,14,16,32,40]; %A loop is run over all the compounds and each character %is compared using strcmp, and the respective weigths are input %and stored in species_wt for i=1:53 mol_wt=0; compound=char(species(i)); for p=1:length(compound) for j=1:length(element_list) if strcmp(compound(p),element_list(j)) mol_wt= mol_wt+element_molwt(j); k=j; end end %str2double is used to convert numbers in strings to double %If the scanned number is greater than one, the previous %element scanned is added n-1 times n=str2double(compound(p)); if n>1 mol_wt=mol_wt+(n-1)*element_molwt(k); end end species_wt(i)=mol_wt; end - Execution in Command Window:
-
%Following commands are used for printing of the calcultaed molecular weights %of compounds sprintf('Molecular Weight of compounds') for i=1:53 %disp() is used to display the specified text in command window disp(char(species(i))) disp(species_wt(i)) end - Two vectors are specified, with each element and its corresponding molecular weight at the same indices. A loop is run to verify each character of the compound name and add the respective molecular weight. When a number is encountered (n), the previous index's molecular weight is multiplied with (n-1) and added to the actual compound weight. These computed molecular weights are stored in species_wt. The disp command is used to print the name and calculated molecular weight of each compound.
- Plotting and Saving of graphs:
-
%Plotting and Saving in Folder %ct is defined to store frame number ct=1; for i=1:53 %A directory is named with repective compound names data=sprintf('%s',char(species(i))); %pwd gives the current directory path current_dir=pwd; %mkdir creates a new directory of the defined name %at the current address mkdir(data); %cd is used to enter the specified directory cd(data); %fugures are numbered,plotted,labelled and titled figure(ct); x=linspace(localtemp(i,1),localtemp(i,3),500); y=linspace(localtemp(i,3),localtemp(i,2),500); hold on; plot(x,cplow(i,:),'color','r','linewidth',3); plot(y,cphigh(i,:),'color','b','linewidth',3); hold off; xlabel('Temperature [K]'); ylabel('Specific Heat [kJ/kg.K]'); legend('Low Temp','High Temp','Location','northwest'); title(['Specific Heat vs Temperature for ',char(species(i))]); %getframe command is used to capture the frame of the flot getframe(gcf); %saveas is used to save the plot with the assigned name saveas(ct,'Cp.png'); ct=ct+1; %similar procedure is used to plot the remaining graphs figure(ct); hold on; plot(x,hlow(i,:),'color','r','linewidth',3); plot(y,hhigh(i,:),'color','b','linewidth',3); hold off; xlabel('Temperature [K]'); ylabel('Enthalpy [kJ]'); legend('Low Temp','High Temp','Location','northwest'); title(['Enthalpy vs Temperature for ',char(species(i))]); getframe(gcf); saveas(ct,'H.png'); ct=ct+1; figure(ct); hold on; plot(x,slow(i,:),'color','r','linewidth',3); plot(y,shigh(i,:),'color','b','linewidth',3); hold off; xlabel('Temperature [K]'); ylabel('Entropy [kJ/K]'); legend('Low Temp','High Temp','Location','northwest'); title(['Entropy vs Temperature for ',char(species(i))]); getframe(gcf); saveas(ct,'S.png') %cd is used to current directory of the matlab code, for execution cd(current_dir); ct=ct+1; end - In this section, firstly ct is declared to store frames of each graph. A loop is run for each compound and the computed values of specific heat, enthalpy and entropy as a function of temperature are plotted. Each compound has the 3 graphs plotted, labelled, and titled. The frame of the plot is captured using getframe. But firstly, data is a directory named for each compound. pwd command is used to obtain the current directory path. mkdir command is used to create a new directory of the name 'data' at the current address. cd command is used to get inside the specified file name of compound. Inside each folder, the 3 plots are saved using saveas. The cd(current_dir) is used to return to the original directory where the MATLAB code is present.
- Specific Heat, Enthalpy and Entropy calculation:
-
%Function for calculation of specific heat,enthalpy and entropy for all temperature ranges function [cplow,cphigh,hlow,hhigh,slow,shigh]=cphsfunc(coeff,localtemp) %Specific gas constant is assigned to R R=8.314; for i=1:53 j=1; %coeff is a 2D matrix,stored with the 14 coefficiets of 53 compounds %Each coefficient is accessed using variable j a1=coeff(i,j); a2=coeff(i,j+1); a3=coeff(i,j+2); a4=coeff(i,j+3); a5=coeff(i,j+4); a6=coeff(i,j+5); a7=coeff(i,j+6); j=8; b1=coeff(i,j); b2=coeff(i,j+1); b3=coeff(i,j+2); b4=coeff(i,j+3); b5=coeff(i,j+4); b6=coeff(i,j+5); b7=coeff(i,j+6); %linspace command is used to create a vector of low temperature range values and %high temperature range values t_high=linspace(localtemp(i,3),localtemp(i,2),500); t_low=linspace(localtemp(i,1),localtemp(i,3),500); %The respective formulas are input to create corresponding values of Cp,H and S %at each specified temperature value cphigh(i,:)=(a1+ a2.*t_high+ a3.*t_high.^2+ a4.*t_high.^3+ a5.*t_high.^4).*R; hhigh(i,:)=(a1+ (a2.*t_high)./2+ (a3.*t_high.^2)./3+ (a4.*t_high.^3)./4+ (a5.*t_high.^4)./5+ a6./t_high).*R.*t_high; shigh(i,:)=(a1.*log(t_high)+ a2.*t_high+ (a3.*t_high.^2)./2+ (a4.*t_high.^3)./3+ (a5.*t_high.^4)./4+ a7).*R; cplow(i,:)=(b1+ b2.*t_low+ b3.*t_low.^2+ b4.*t_low.^3+ b5.*t_low.^4).*R; hlow(i,:)=(b1+ (b2.*t_low)./2+ (b3.*t_low.^2)./3+ (b4.*t_low.^3)./4+ (b5.*t_low.^4)./5+ b6./t_low).*R.*t_low; slow(i,:)=(b1.*log(t_low)+ b2.*t_low+ (b3.*t_low.^2)./2+ (b4.*t_low.^3)./3+ (b5.*t_low.^4)./4+ b7).*R; end end - The function cphsfunc is used to calculate the desired quantities. The 'localtemp' and 'coeff' vectors are input into the function. The high and low temperature coefficients are stored in `a_1,a_2,a_3,a_4,a_5,a_6,a_7` and `b_1,b_2,b_3,b_4,b_5,b_6,b_7` respectively. Using linspace command an array of low and high temperature ranges are created to calculate the Cp,H and S values at each point. Using Eqn.1,2 and 3 the vectors for each compound are computed and stored in different variables.
- OUTPUT:
- Oxygen(`O_2`):
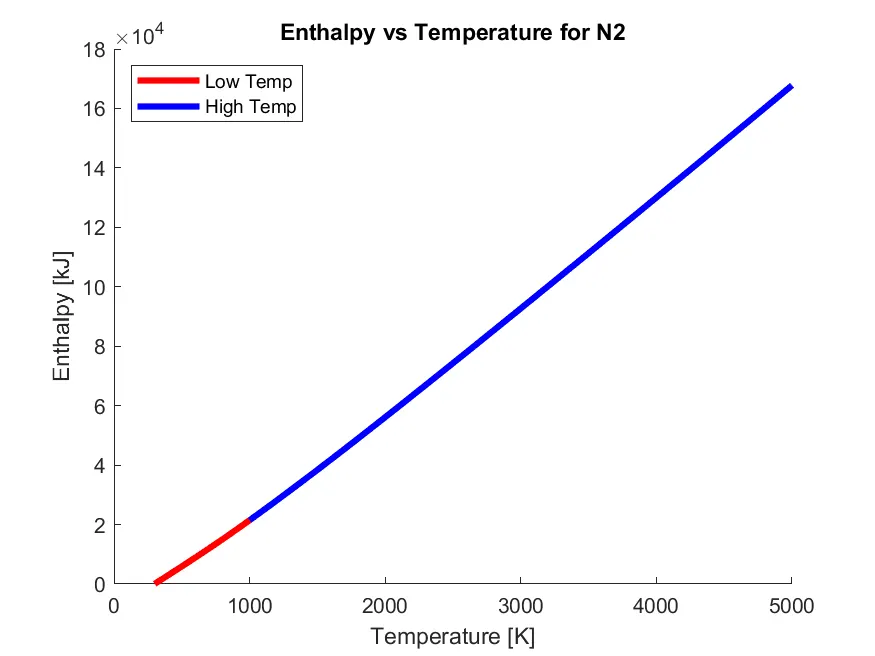
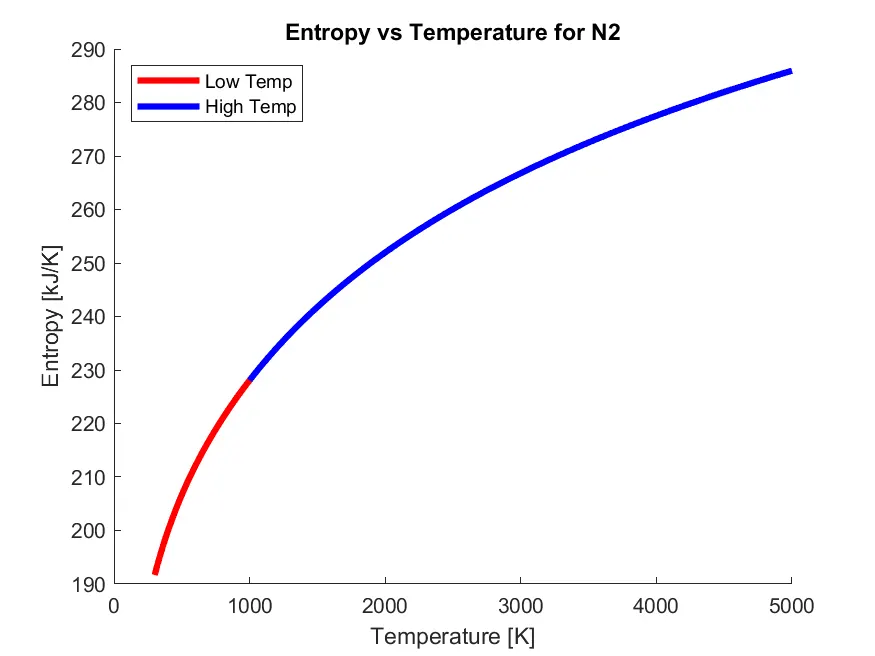
- Nitrogen(`N_2`):
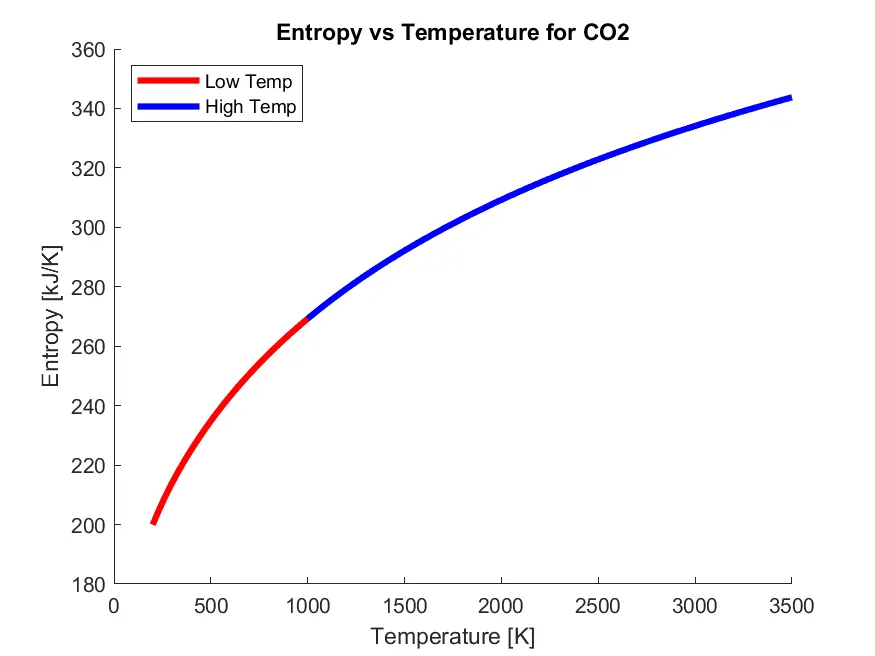
- Carbon Dioxide(`CO_2`):
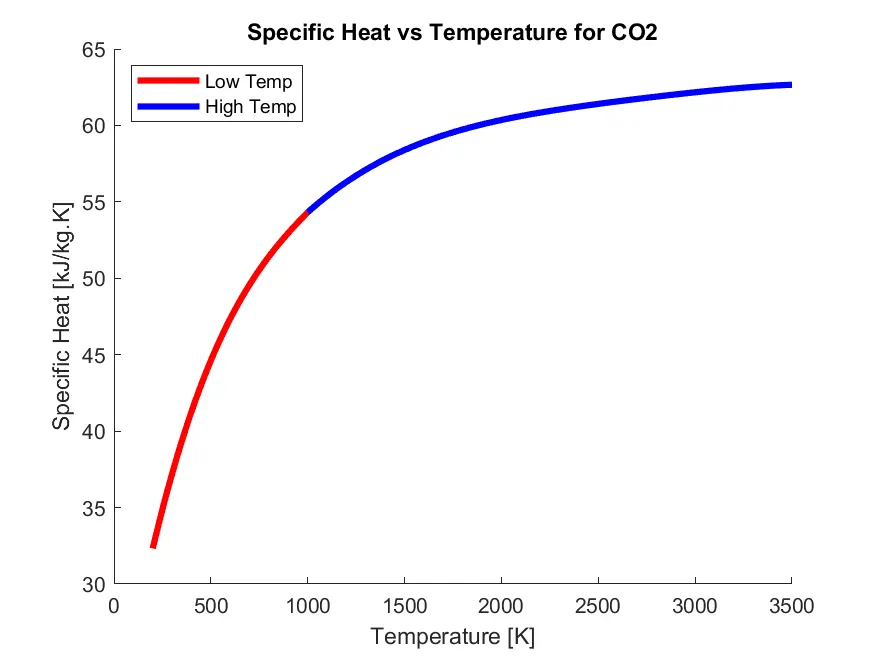
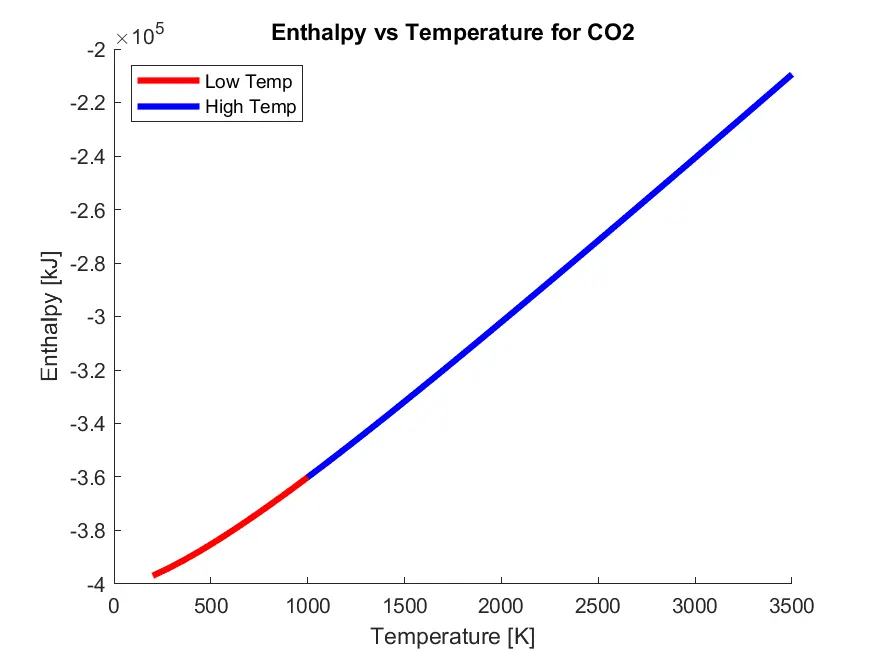
- FOLDER CREATED:
- MOLECULAR WEIGHT IN COMMAND WINDOW:
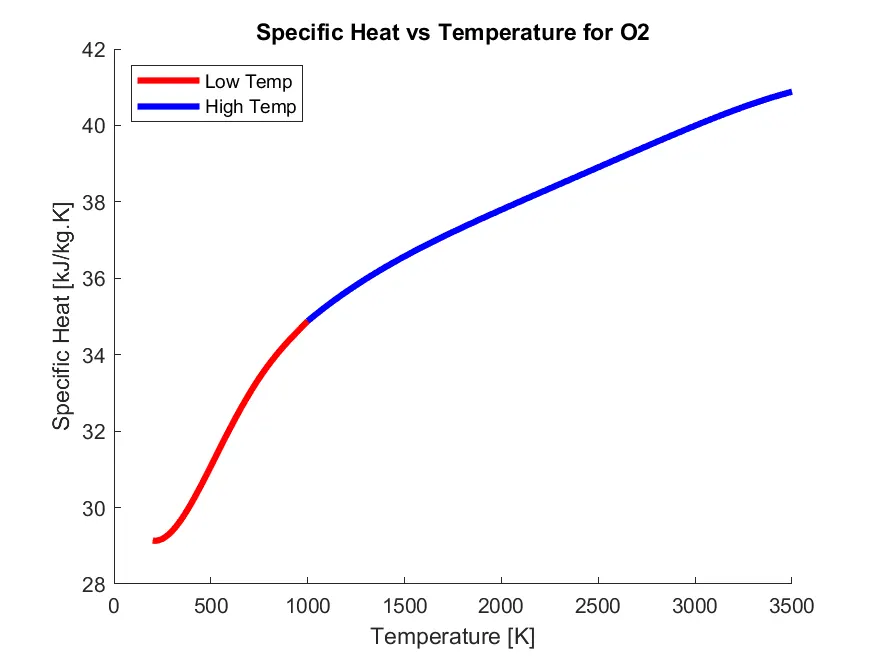
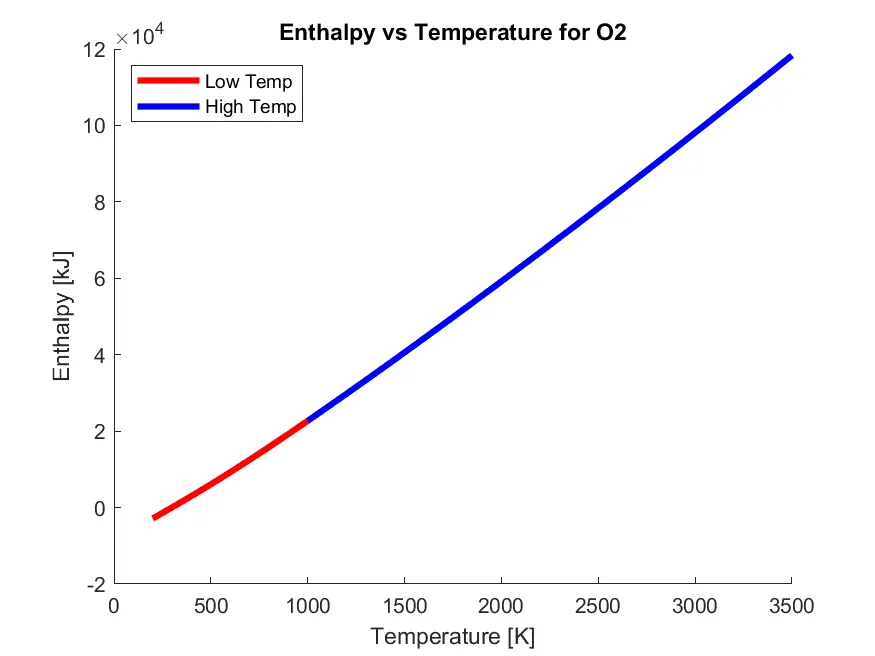
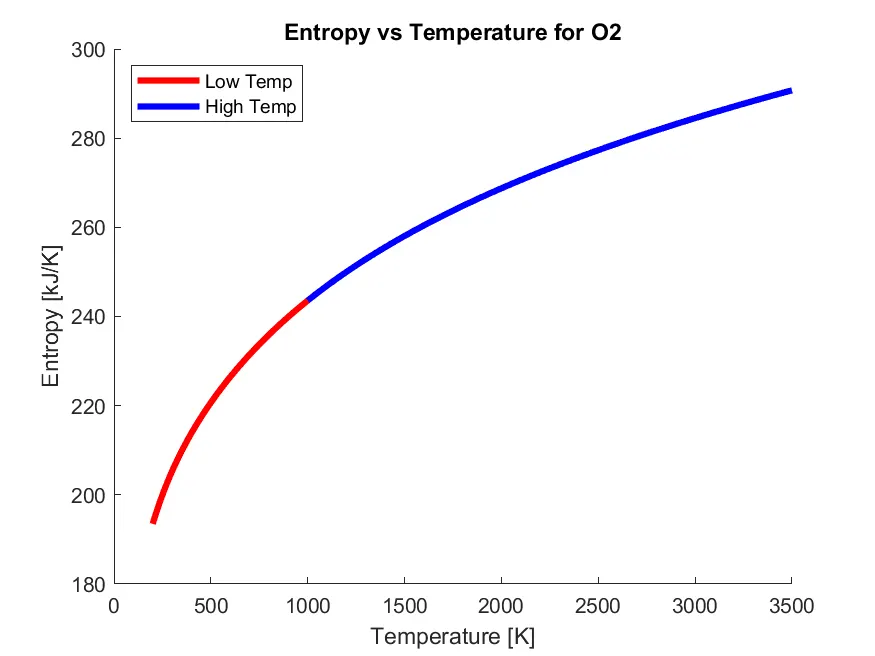
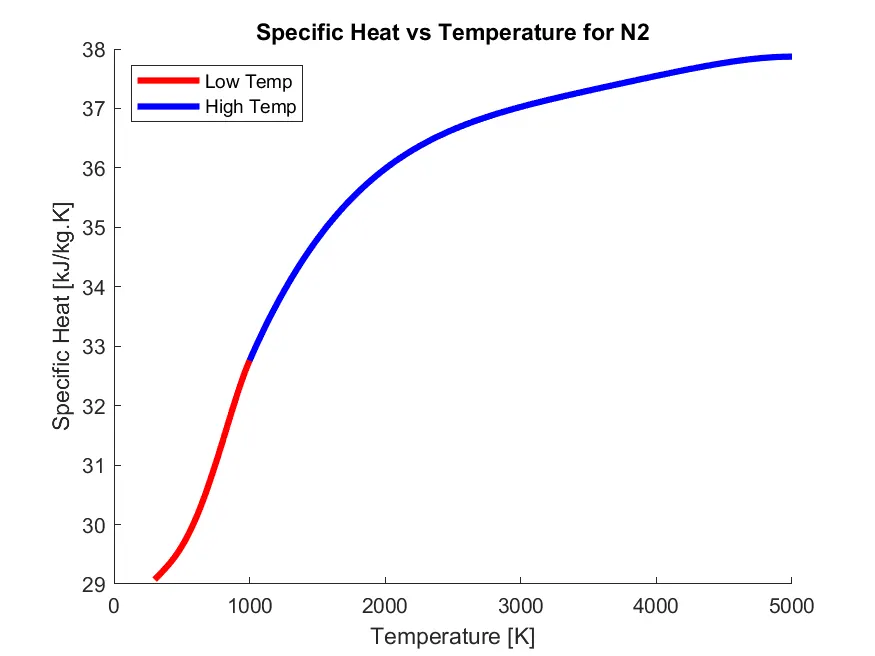
- The output of the above compounds are plotted, and the variation in the Cp,H and S with temperature can be observed.
- ERRORS:
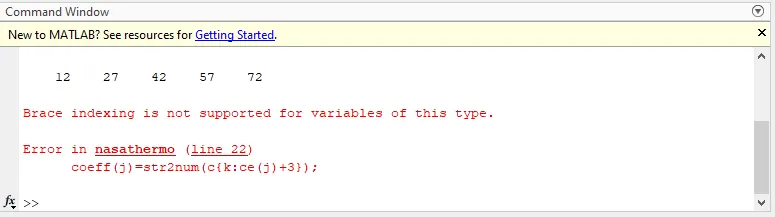
- The coeff matrix being created is 2D. Therefore, indexing the matrix as coeff(i,j) is the right way to assign values.
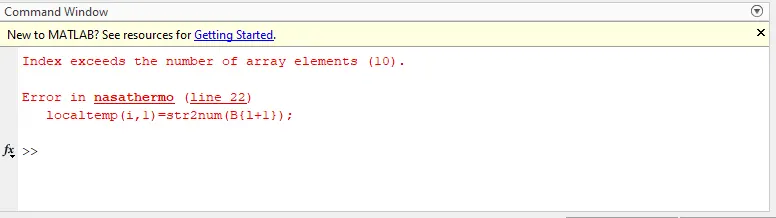
- The 1st line of each compound, where the compound name, local temperatures were given is not consistent in the positioning of the local temperature values. This was solved by considering that the 2nd last,3rd last and 4th last values of the character array are local temperatures. Therefore, localtemp(i,1)=str2num(B{end-x}) was used where 'x' is 1,2, and 3 for local mid,local high,local low temperatures respectively.
RESULTS AND CONCLUSIONS:
- The thermodynamic data is succesfully parsed, the desired quantities calculated and plotted.
- The data clearly shows that the specific heat, enthalpy and entropy vary differently in various temperature zones for each compound
- The project gives a good exposure to parsing techniques, and basic linux commands.