Wide Open Throttle Condition for EV Reference Model in Simulink
Week 4 WOT Challenge II
1. What is the difference between mapped and dynamic model of engine, motor and generator? How can you change model type?
A.
(a)
| MAPPED | DYNAMIC |
| Mapped models show the bird's eye view of the model (Macro) using look up table. These models are used for understanding the behaviour of the subsystem. | Dynamic models show the discrete component performance in each substem based on real-time perfomance. |
| Emperical data is input to get the results. | Real time performance of the components is extracted to guage the performance. |
| Easy modeling and faster time to simulate the model. | Complex modeling and high simulation run time as each component's performance characterstic is mapped. |
(b)
Go the Respective Motor/Generator model you wish to convert.
Following the below path:

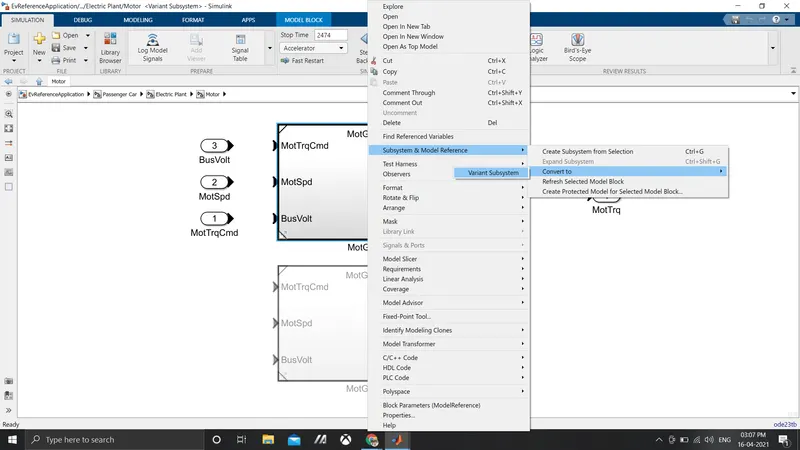
Right Click on the activated model and navigate through "Subsytem and Model Reference"->"Convert to"->"Variant Subsytem".
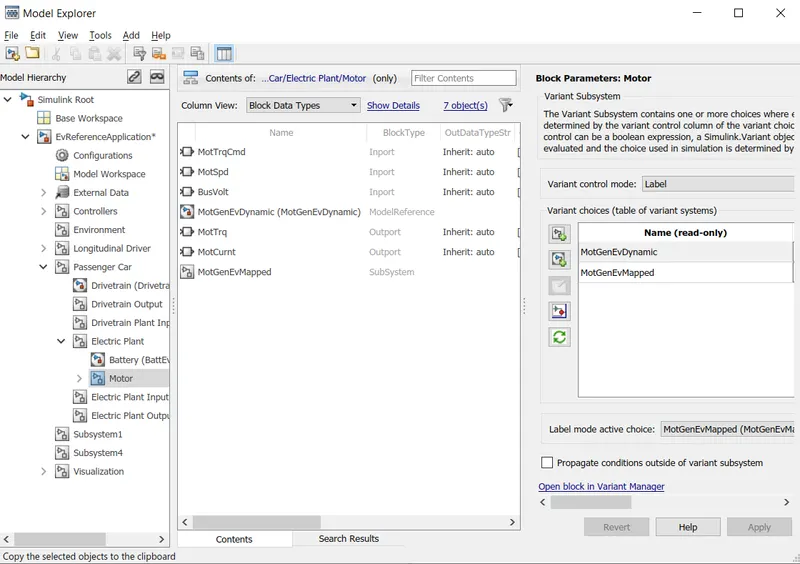
Using "Ctrl+H" open Model Explorer, and on the Block Parameter Panel you can select Mapped or Dynamic Variant Subsystem.
2. How does the model calculate miles per gallon? Which factors are considered to model fuel flow?
A.
(a)
The Miles per gallon is the fuel economy statement used to compare the performance of IC Engines. In EVs, the amount of electrical energy required to travel 100km is calculated as fuel economy. Since engines that use an alternative source of fuel can’t be measured by liquid gallons of fuel, the MPGe rating is calculated by figuring out the number of miles a vehicle can go using the same energy content as a gallon of gas. The EPA calculates that 33.7 kilowatt-hours of electricity is the equivalent to one gallon of gas, so an electric or hybrid vehicle that uses 29 kWh per 100 miles would get a combined 115 MPGe rating.
The following path includes the Performance Calculation parameters and output for EV:
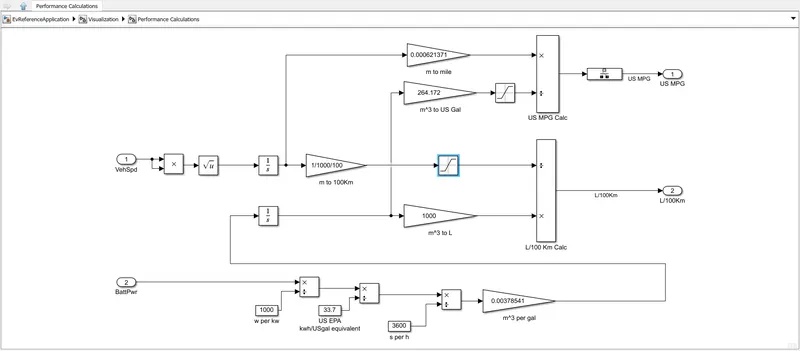
The model extracts drive cycle and battery power consumption as a function of time. The battery power is converted to amount of heat generated in terms of gasoline. This is converted to amount of fuel consumed in real time. Using the velocity of vechicle input in real time, the distance is calculated and the amount of fuel consumed per 100kms in captured.
(b)
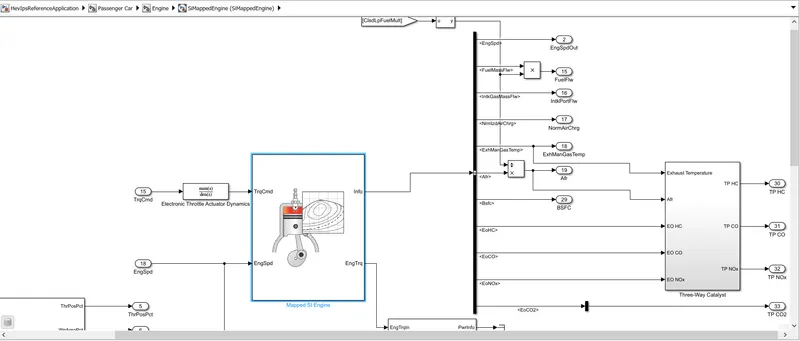
In the SI Mapped Engine Calculations, the output parameters extracted from the Engine Info includes Fuel Flow. The Input parameters sent into the SI Engine includes Motor Torque, Engine Speed and Velocity of Vehicle to meet the demands.
3. Run the HEV ReferenceApplication with WOT drive cycle. Change the grade and wind velocity in the environment block. Comment on the results.
A.
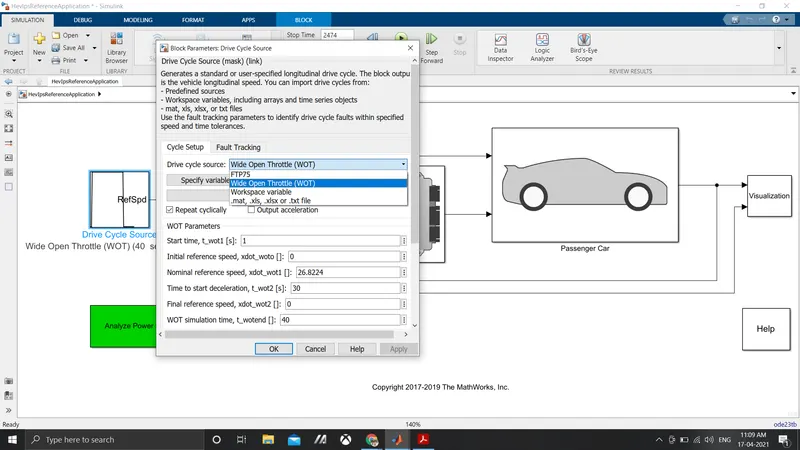
The following path was used to set up the Input Drive Cycle:
In Environment Block, the Grade and Wind Velocity were changed:
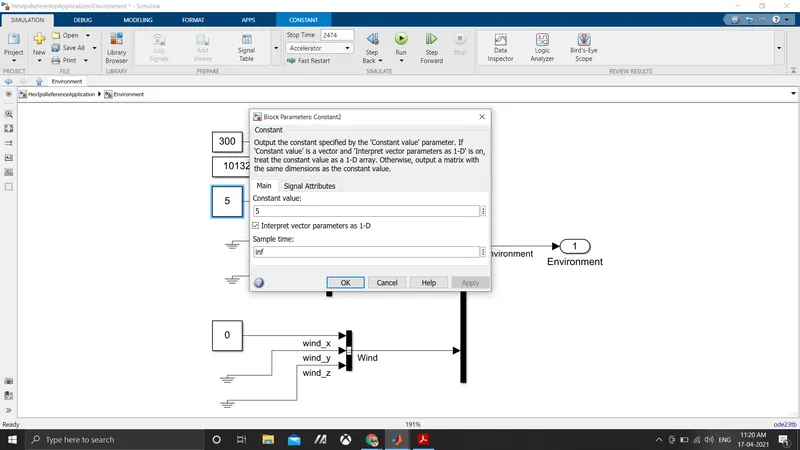
Similarly, the constant value for Wind Velocity X direction was given a value of 10.
OUTPUT:
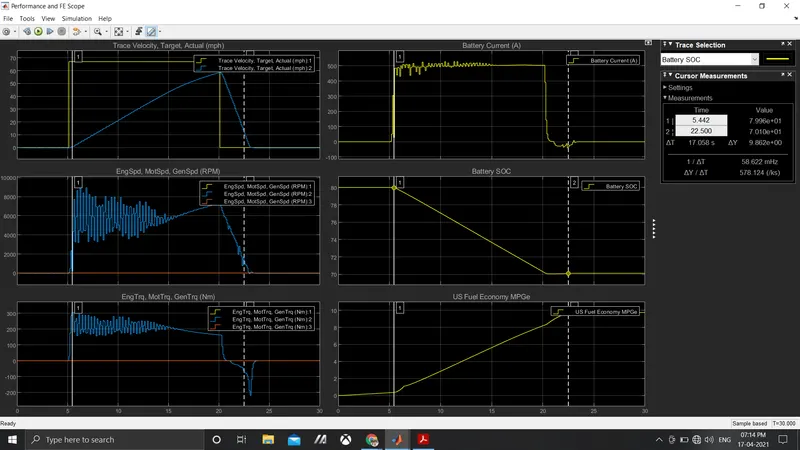
COMMENTS:
The Trace Velocity of the vehicle in the 1st diagram shows how the IC and Electric motor are functioning together to reach the desired velocity.
Since the battery alone couldn't handle the Power demand, the IC was also used to contribute to the demand. This is seen by the increased Engine Speed and RPM.
The Battery's State of Charge was observed to dropfrom 80% to 70%. It stabilized after that, as the whole load was taken by IC Engine.
Battery current is observed to go negative near the end of WOT cycle, as regenerative breaking was charging the battery and the current was pushed in the reverse direction.
4. Keeping all other parameters same, compare the simulated results of hybrid and pure electric powertrains.
A.
Running the simulation for pure EV with same grade and wind velocity as HEV, the following results were obtained:
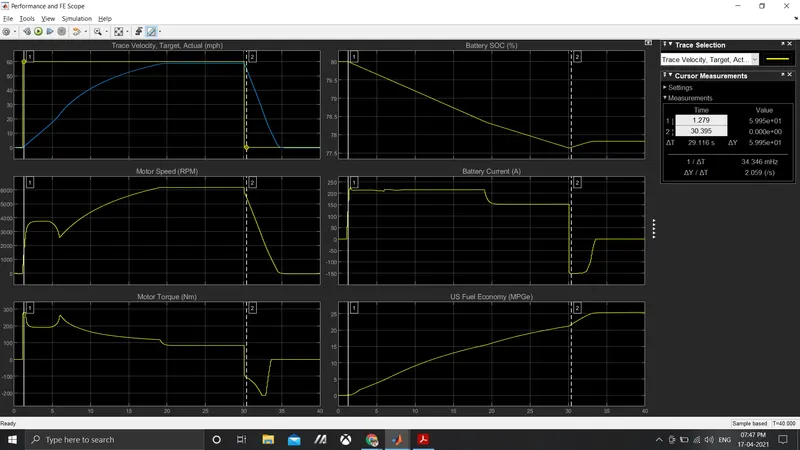
COMMENTS:
The WOT cycle for EV module is 10 secs longer but the desired peak velocity was achieved well before the drop in WOT cycle.
The Motor Speed and Torque are more uniform and pickup to the desired power output faster.
Negative motor torque and Batteru Current at Pointer 2 suggests that Regenerative Braking was in action leading to slight increase in Battery SOC.
Tabulated Comparison of HEV and EV for WOT Cycle with Grade 5 and Wind Velocity 10 mph:
| HEV | For 5s to 20s | EV | For 1s to 30s | |
| Trace Velocity Expected (mph) | 67.1 | -0.28 | 59.95 | 0 |
| Trace Velocity Actual (mph) | 0 | 58.7 | 0.377 | 55.34 |
| Engine, Motor Speed (rpm) | 90 | 7196.3 | 1325 | 5531 |
| Engine, Motor Torque (Nm) | 29.55 | 162.9 | 279.95 | -106.46 |
| Battery Current (A) | 2.78 | 503.7 | 119.18 | -152.31 |
| State of Charge (%) | 80 | 70.2 | 80 | 77.65 |
| US Fuel Economy (MPGe) | 0.337 | 8.24 | 0.096 | 21.61 |
RESULTS:
It can be observed that Pure EV provides a better economy, SOC and speed pickup when compared to HEV WOT Cycle analysis.
Better Regenerative Braking Power generation was observed in Pure EV, as the Battery current was not gradually came down in HEV module.