Data analysis- File Parsing of IC Engine Simulation Data using PYTHON
FILE PARSING AND PLOTTING OF IC ENGINE SIMULATION DATA
AIM:
- Write a program in PYTHON to parse a thermodynamic file and plot the desired results.
- The program should automatically ask the user for column numbers, print and save the plots.
OBJECTIVES OF THE PROJECT:
- A set of commands were used to access the file and extract the desired column names and simulation values.
- A function was created for the computation of power output and specific fuel consumption.
- The desired column plots and PV graph was plotted and saved.
- The area under the PV curve was computed using a function.
BODY OF THE CONTENT:
- Code:
-
import math import matplotlib.pyplot as plt import numpy as np """ Program to parse IC Engine simulation data and plot the output of desired parameters """ #Function for Area under the PV Curve and Power Output of Simulation Cycle def powerfunc(rpm,x_data,y_data): area=np.trapz(y_data,x_data) #unit=MJ workdone=area*1000 #unit=kJ power=2*math.pi*rpm*(workdone/60) #unit=kW return (workdone,power) #Function to compute specific fuel consumption def bsfccomp(fuel_per_stroke,power,rpm): fuel_per_sec=fuel_per_stroke*rpm*(0.5/60) #unit=gm/sec fuel_per_hour=fuel_per_sec*3600 #unit=gm/hr bsfc=fuel_per_hour/power #g/kWhr return bsfc #Asking user for filename filename=input("Enter filename: ") filename=filename+'.out' try: f = open(filename) # Do something with the file except IOError: print("File not recognized. Please provide a valid CONVERGE output file") else: with open(filename, "r") as file: first_line = file.readline() if '# CONVERGE Release Build 2.3.29/' not in first_line: print('Please provide a valid CONVERGE output file') else: #Asking user to input desired column numbers x, y = input("Enter two values for columns: ").split() #Converting strings into integers x=int(x) y=int(y) #Initializing null vectors name=[] units=[] array_x=[] array_y=[] pressure=[] volume=[] #Running a loop through each line of data file to extract the respective columns for line in open('engine_data.out'): if '# Crank' in line: name=line.split( ) if '# (DEG)' in line: units=line.split( ) if '#' not in line: array_x.append(float(line.split()[x-1])) array_y.append(float(line.split()[y-1])) pressure.append(float(line.split()[1])) volume.append(float(line.split()[7])) plt.figure(1) plt.plot(array_x,array_y,linewidth=3) xlabel=name[x]+units[x] ylabel=name[y]+units[y] plt.xlabel(xlabel) plt.ylabel(ylabel) title='Plot of '+name[y]+' vs '+name[x] plt.title(title) plt.savefig(title) plt.show() plt.figure(2) plt.plot(volume,pressure,linewidth=3) xlabel=name[8]+units[8] ylabel=name[2]+units[2] plt.xlabel(xlabel) plt.ylabel(ylabel) plt.title('Plot of Pressure vs Volume') plt.savefig('p vs v') plt.show() rpm=1500 area_PV,power=powerfunc(rpm,volume,pressure) bsfc=bsfccomp(20*1e-6,power,rpm) print('Area under the PV diagram: ',area_PV,'kJn') print('Power Output of the Engine: ',power,'kWn') print('Specific Fuel Consumption: ',bsfc,'g/kWhrn') - Explanation of code algorithm:
- Initially the functions are defined for the computation of power output (`powerfunc`) and Specific Fuel Consumption (`text(bsfccomp)`). The inputs for the respective parameters are given and the outputs are printed. The filename is input by the user and checked whether it exists in the directory. If it exists, the file is opened and the column names, units, and desired column data are extracted. The extracted data is appended into the respective vectors. The desired plots are plotted and the pressure vs volume diagram is also plotted. The initially defiend function's outputs for the specific fuel consumption and power output are printed.
- OUTPUT:
- Output for wrong filename/non-existing filename:
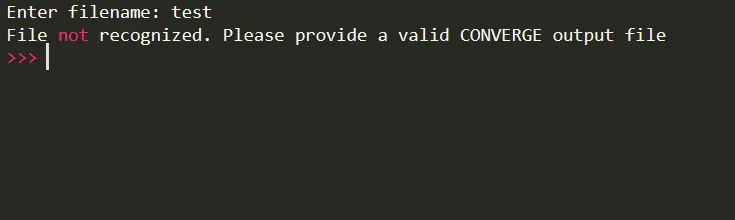
- Fig. 1 Output for non-existing filename
Output for correct filename:
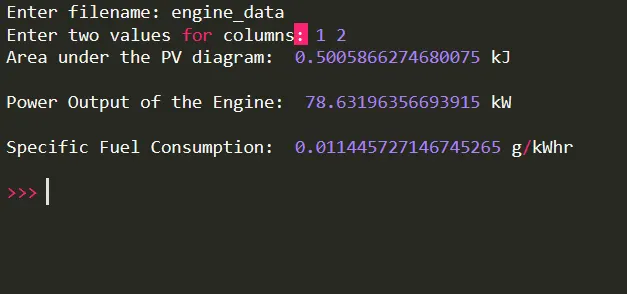
Fig. 2 Output for correct filename and plot between Crank angle and pressure
Plot for the given input columns:
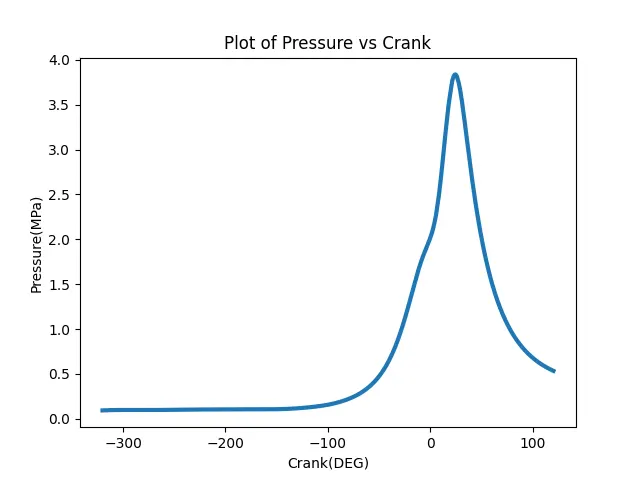
Fig. 3 Variation of Pressure for Crank angle
Pressure vs Volume Plot:
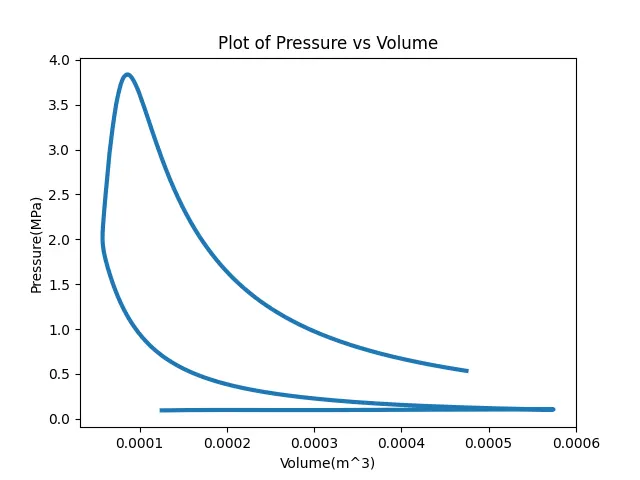
Fig. 4 Variation of pressure with volume
RESULTS AND CONCLUSIONS:
The desired graphs were succesfully plotted. The code shows a pre-written statement for ono-existing filename input.
Area under the pressure-volume curve is: 0.5006 kJ
Power Output of the Engine: 78.632 kW
Specific Fuel Consumption: 0.0114 g/kWhr