Week 1: Channel flow simulation using CONVERGE CFD
AIM:
to stimulate the flow of air through a channel using converge CFD.
OBJECTIVE:
- To setup and run the simulation for three different grid size and compare the results.
- To plot velocity contour,pressure contour,mass flow rate and total cell count for all 3base mesh sizes.
INTRODUCTION:
CHANNEL FLOW:
Flow in conduits or channels arew of intrest in science ,engineering, and everyday life.
There are 2different types of flows,
- Open channel flow
- closed channel flow.
OPEN CHANNEL FLOW:
Flow in open channel flow ,the boundaries are not entirely a solid and rigid material;the other part of the boundary of such flows maybe anotherfluid or nothing.importaant open channel flow are rivers,irrigationcanals,or a sheet of water running along the ground surface after a rain.
types of open channel flow are:
- steady and unsteady flow
- uniform and non-uniform flow
- laminar and turbulent flow.
CLOSED CHANNEL FLOW:
flow in closed channnels like pipes or air ducts are entirely in contact with rigid boundaries.most closed channels in engineering applications are either circular or rectangular in cross section.
case setup:
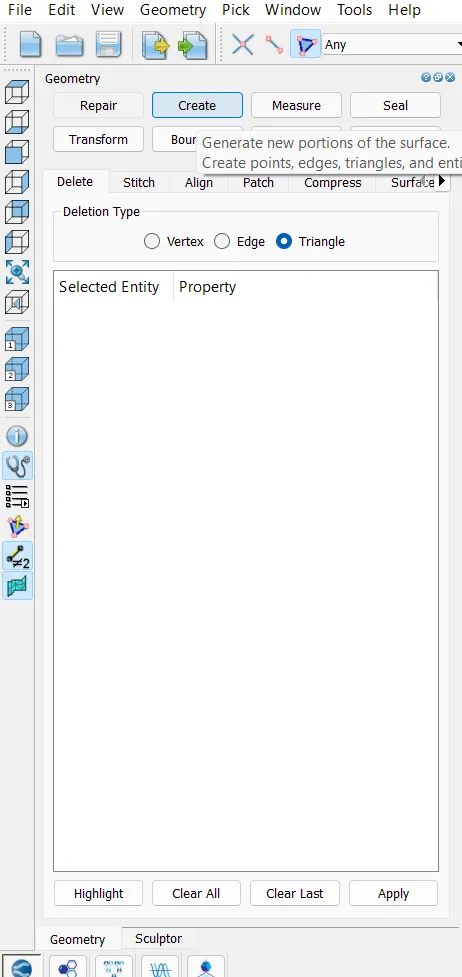
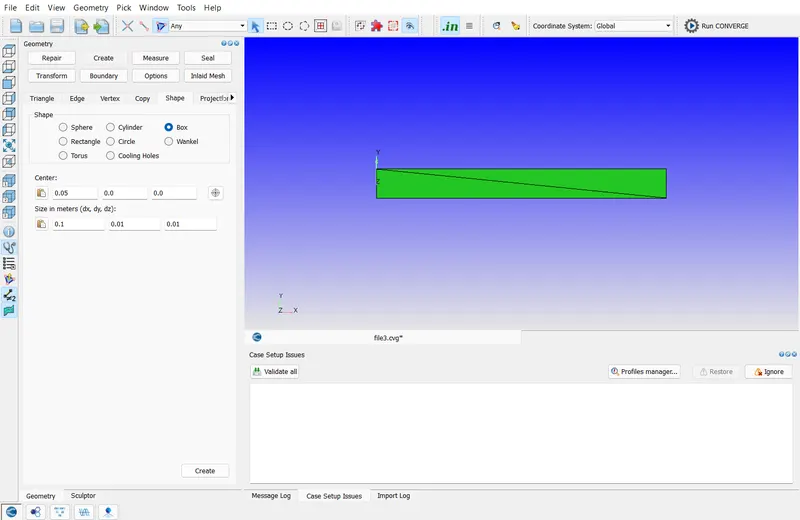
geomentry is created using geomentry editing tool box under create tab.
The dimensions are filled and the geomentry is created.
the boundary are created for the geomentry under boundary flag tab.
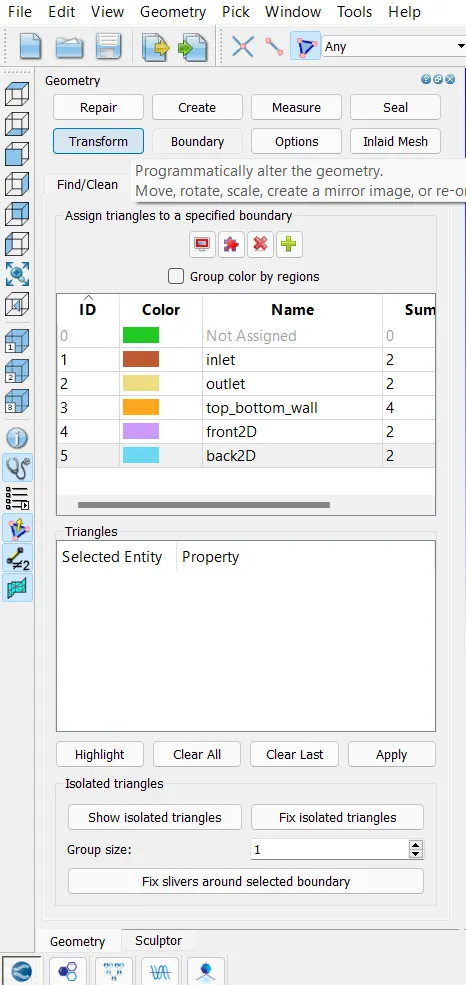
- The boundaries are assigned to the faces and the name of the boundaries are edited and click apply.
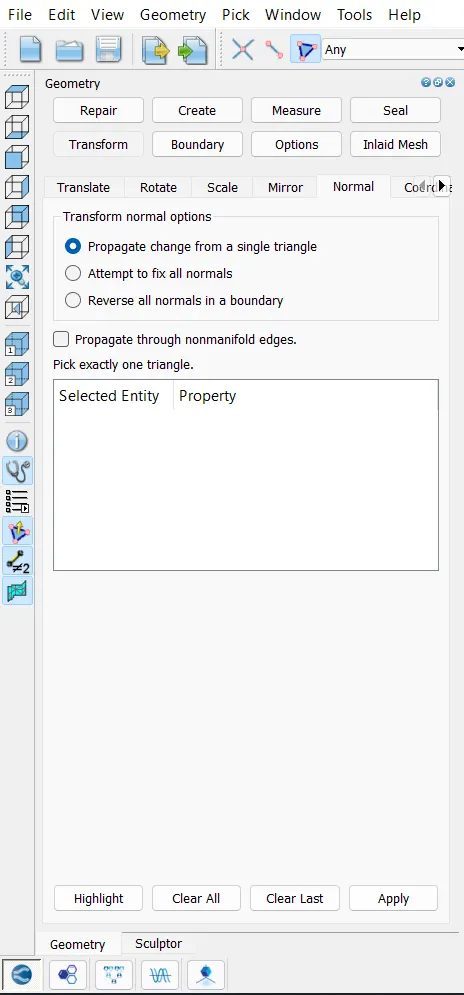
- The orientation of normal are checked and its changes such that the normal points inwards by going to transform -normal-and click apply.
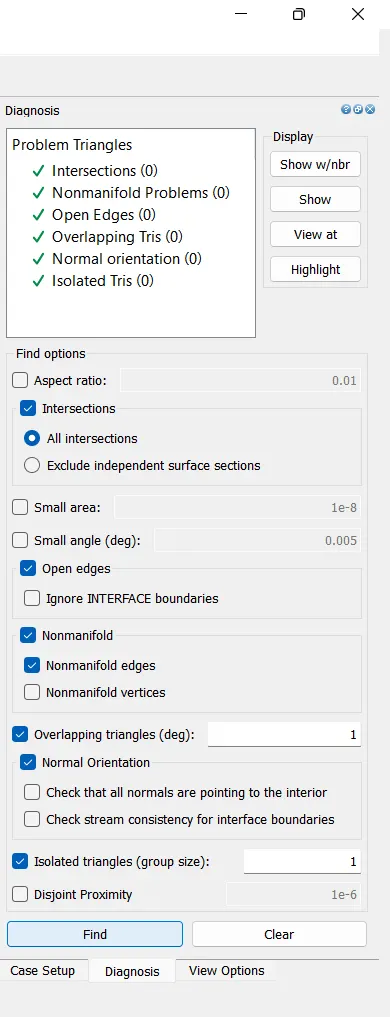
- The diagonsis is runned and checked for errors for the geomentry.
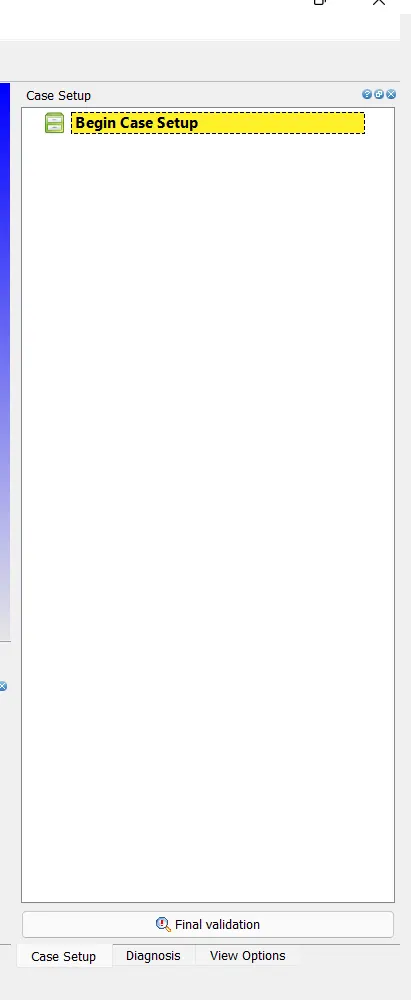
- Begin case setup.
- application type.
- on the right down panel go to the case setup tab,select and begin the case setup.
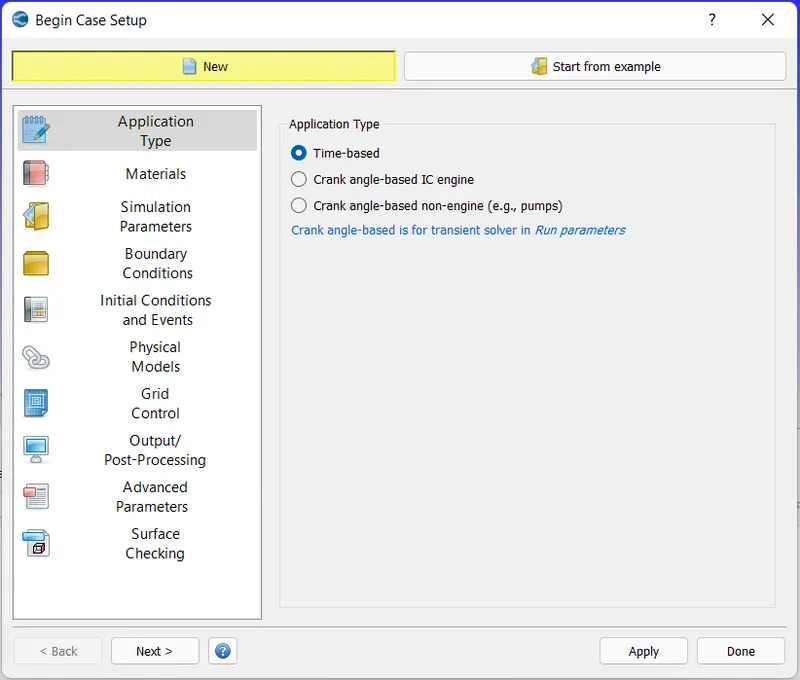
- Select the application type as time based and select apply and done.
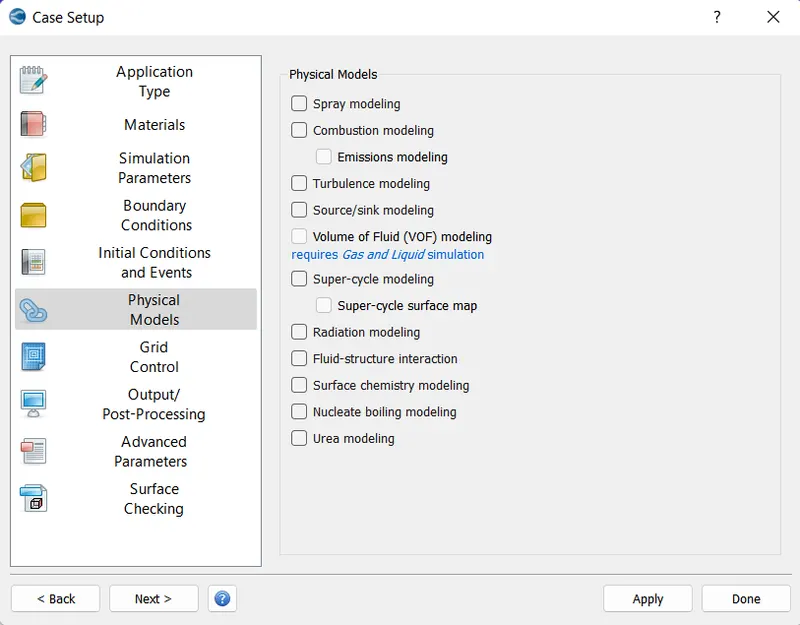
Physical models:
- Select physical models and uncheck the turbulance modelling then press apply and done.
- Materials
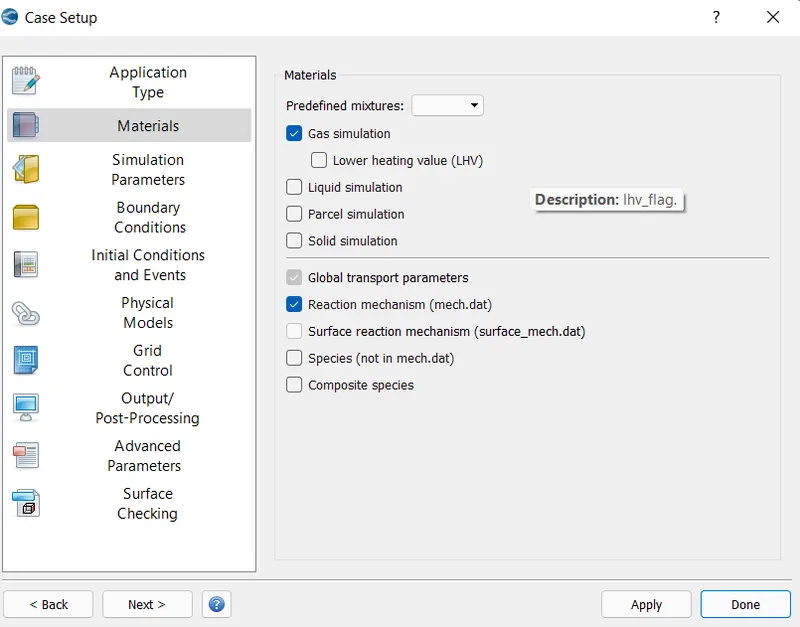
Select materials and uncheck the checkbox any reactions the select the predifined mixture as air,and also select the spicies then click apply and done.
- Species
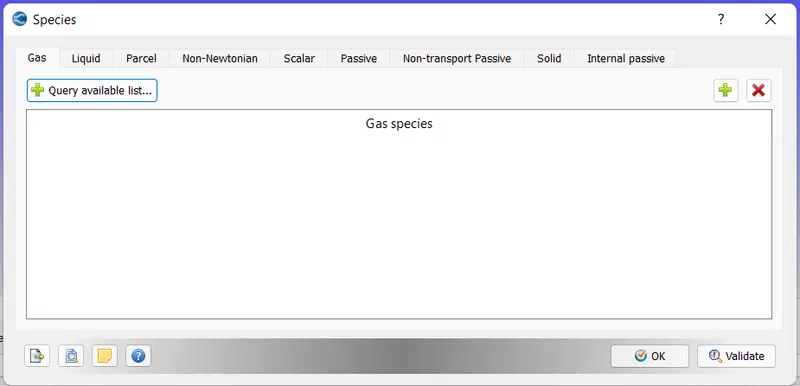
In species add O2 and N2 and press ok.
- Global transport properties
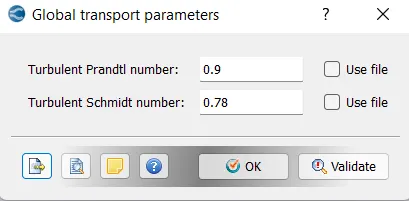
Select the global transport property ,keep the default values and press ok.
Simulation parameters
- Run parameters
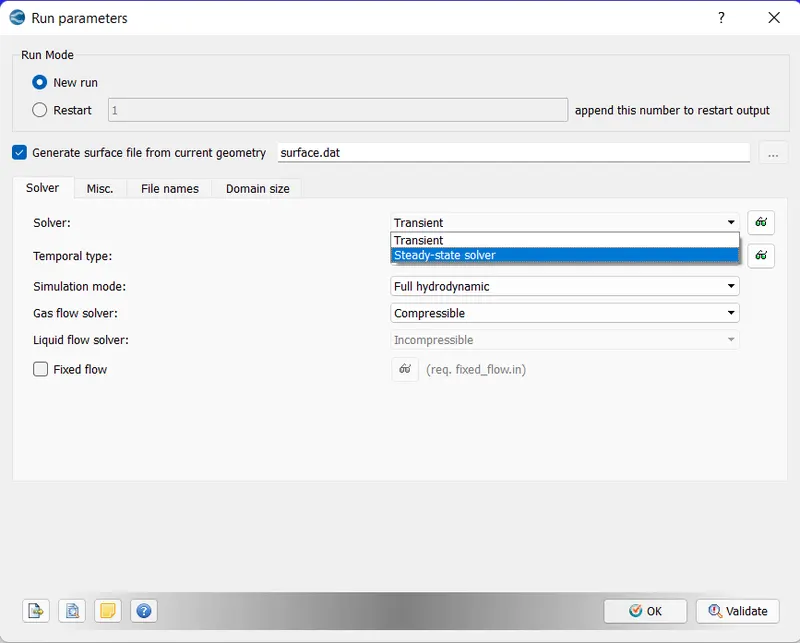
under run parapeters tab select solver as steady state solver.
Same in run parameters select the misc tab select the steady state monitor and uncheck the used shared memory.
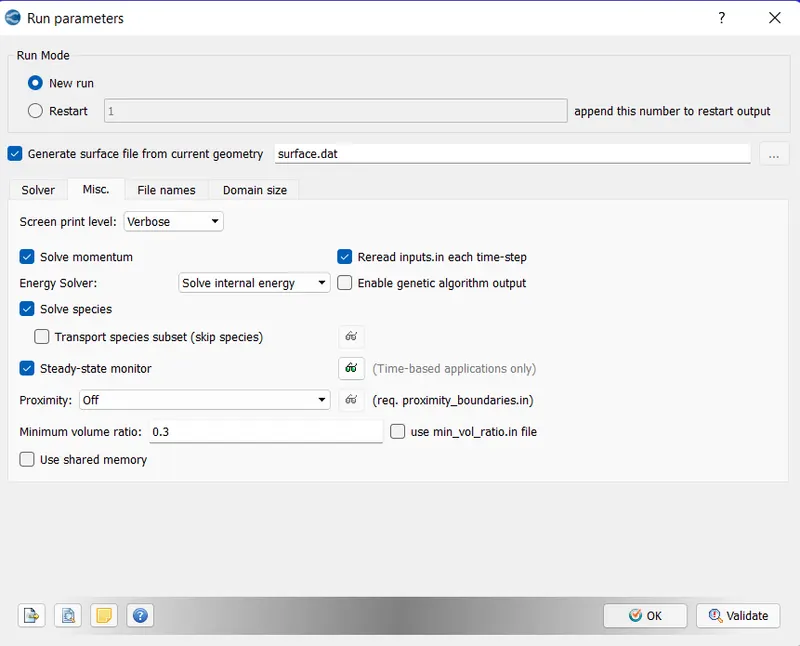
After the slection and unselection in misc tab click ok.
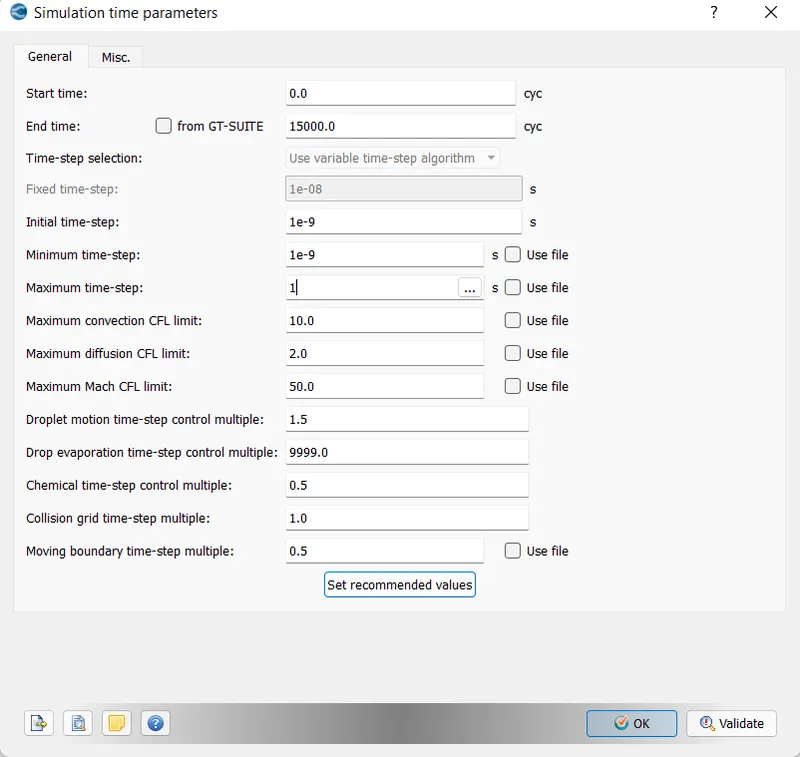
- simulation time parameter
Set the start time,end time,initial,minimum and maximum time steps as shown below.
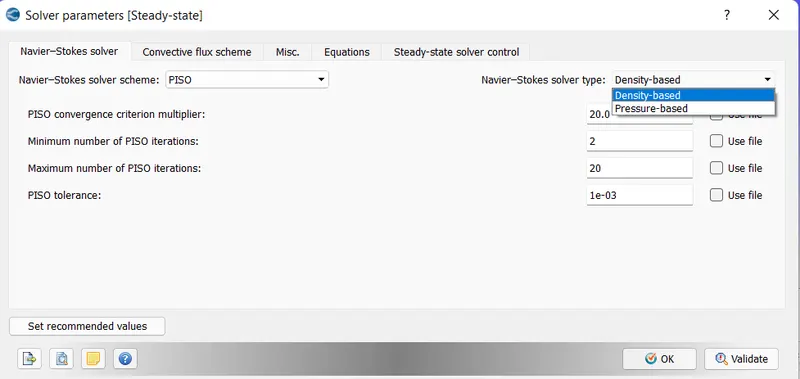
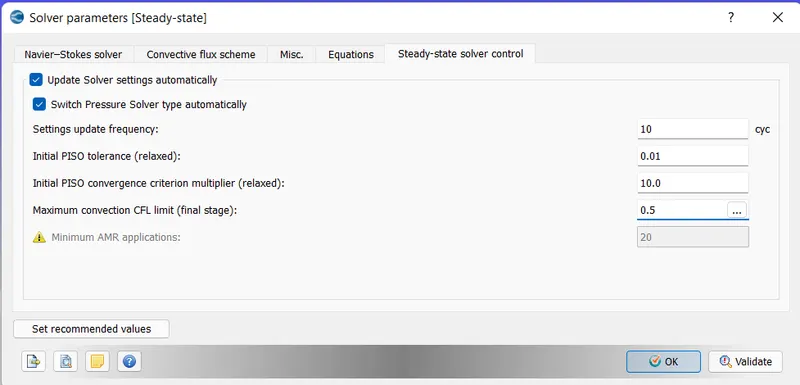
- Solver parametersselect the Navier-strokes solver type as density based.
select the Naviers_storkes solver type as density based.
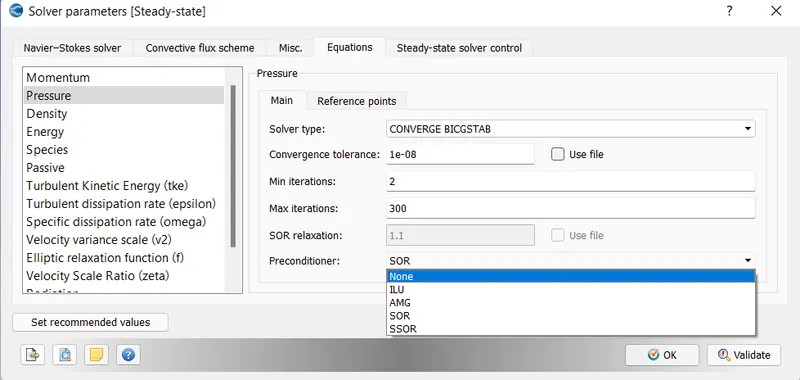
Select the equation tab in that tab select the pressure set the preconditioners to none.
In steady state solver tab the maximum convection CFL limit should be less than 1 so set it to 0.5.
- Regions and initialisations
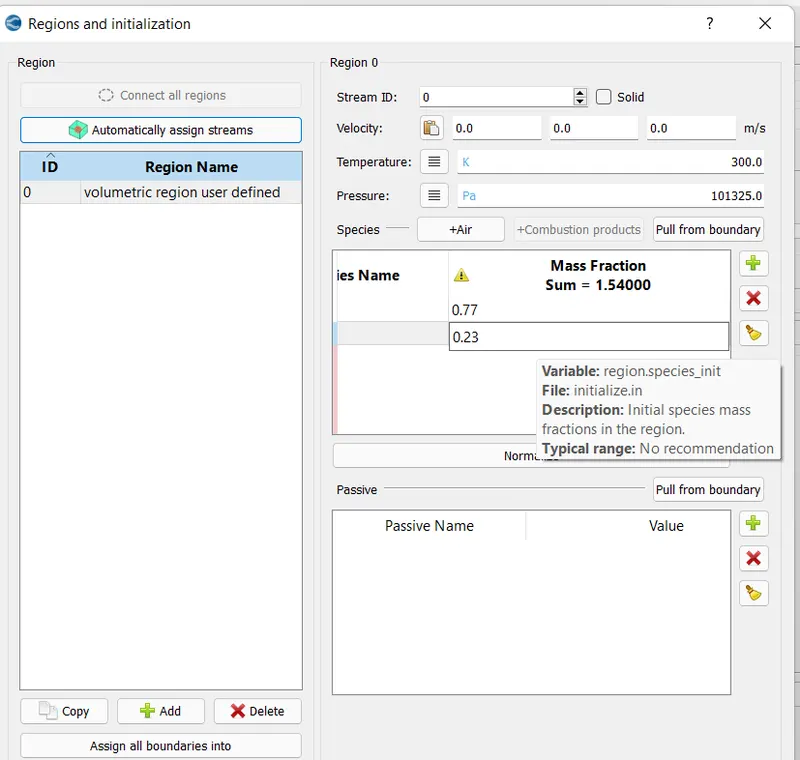
the regions are created and the air is added as the species and the mass fractions are changed to
- O2-0.77
- N2-0.23.
- Boundary condition
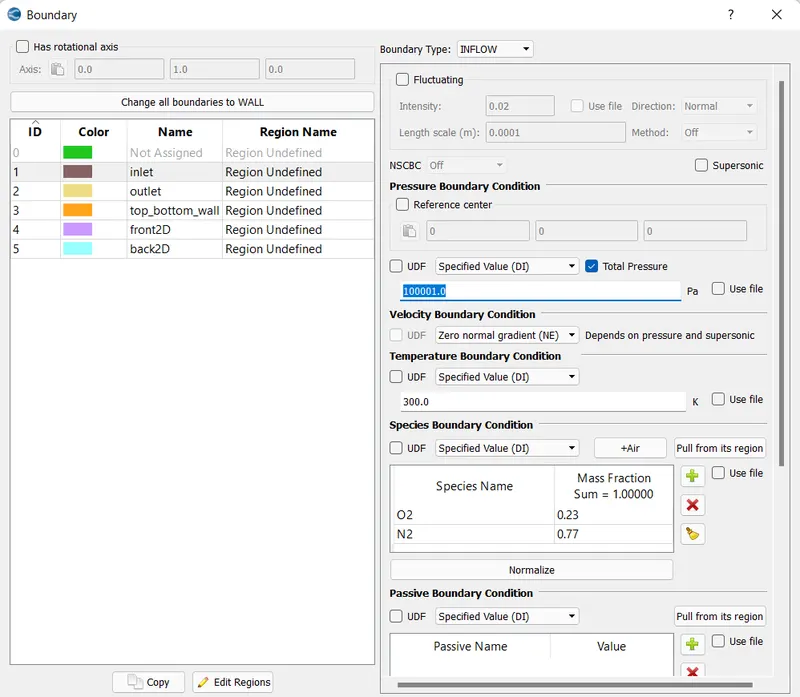
Inlet
For inlet ,set the pressure boundary condition as specified value of 100001 pa and select air for species boundary condition.
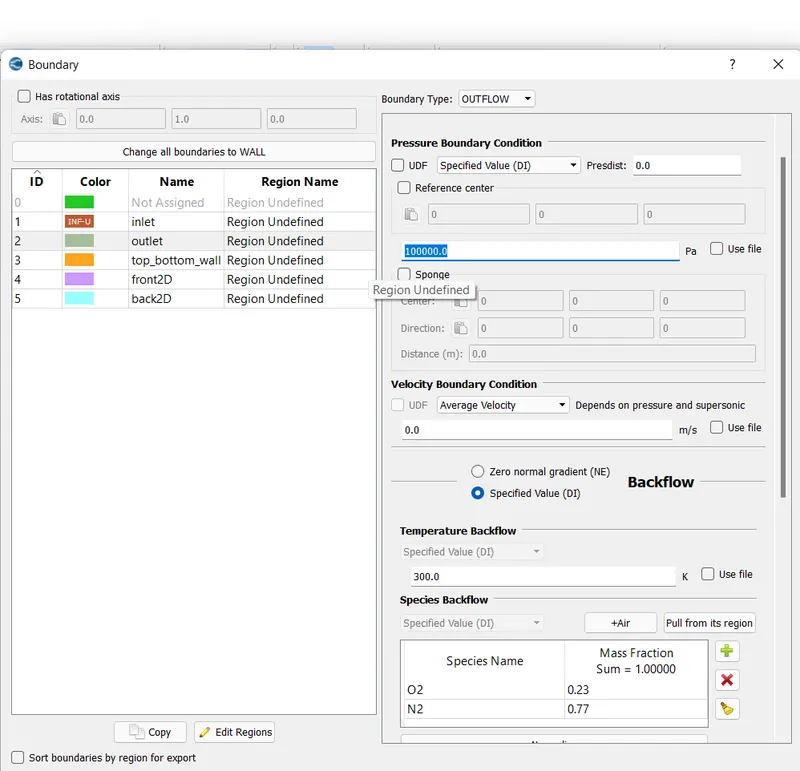
Outlet
Set the output pressure boundary conditions as specified value of 100000 pa and for the species backflow select air.
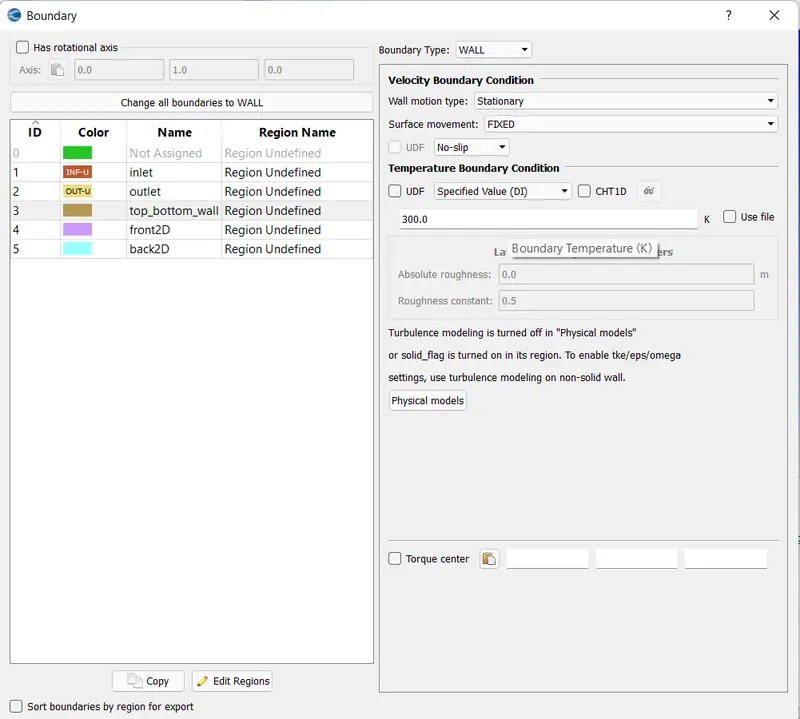
Top and bottom walls
Select the top and bottom booundary as wall type with no slip boundary conditions ,and the tempeerature as specified values of 300k.
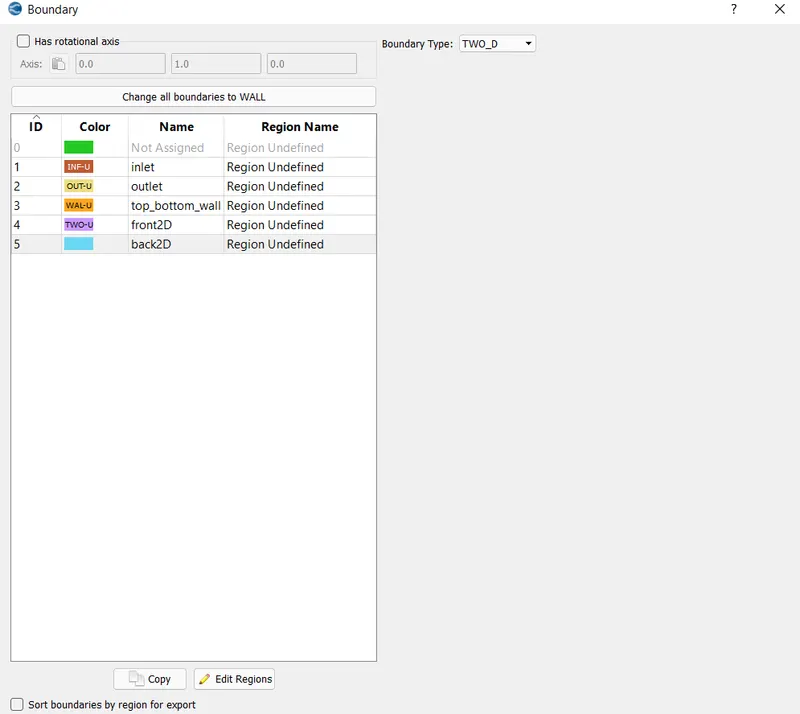
Front and back
the boundary conditions for front and back is set as 2D.
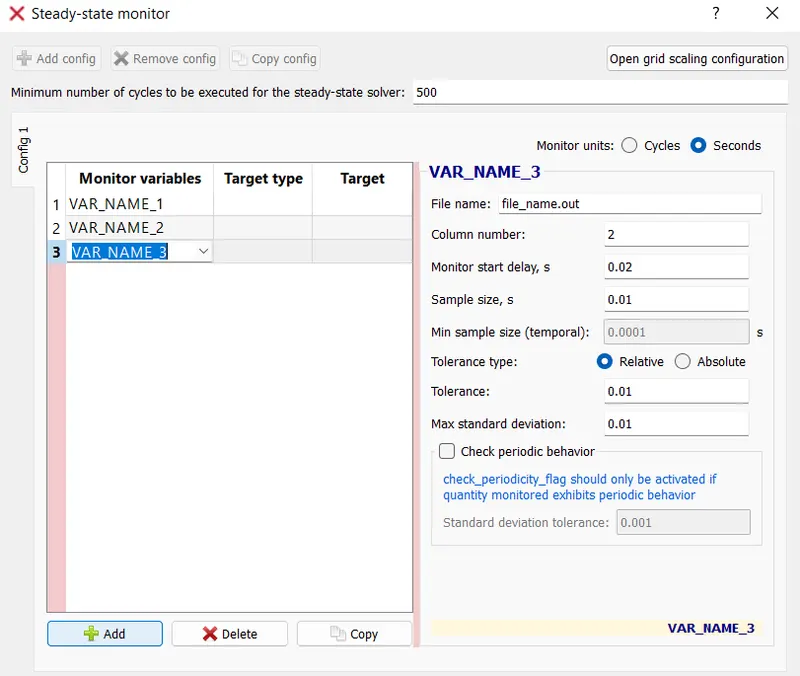
- Steady state monitor
The monitor variables are aaded and the minimum number of cycles ,monitor start delay and sample size are defined.
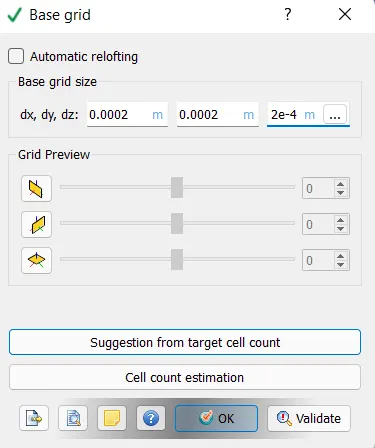
- Base grid
The three different base grid are defined for three different cases and press ok.
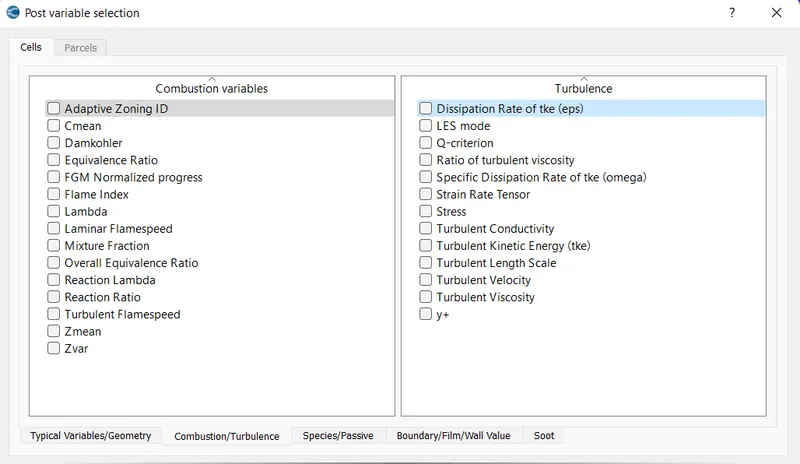
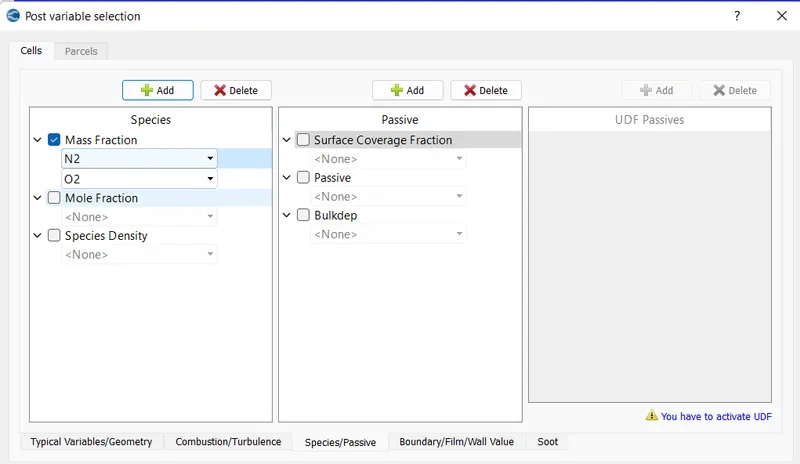
- Post variable selection
- Keep the default values in typical variable tab.
- In the turbulance tab un check all the values.
- In species mark mass fraction and add O2 and N2 ,and click on ok.
- Output files
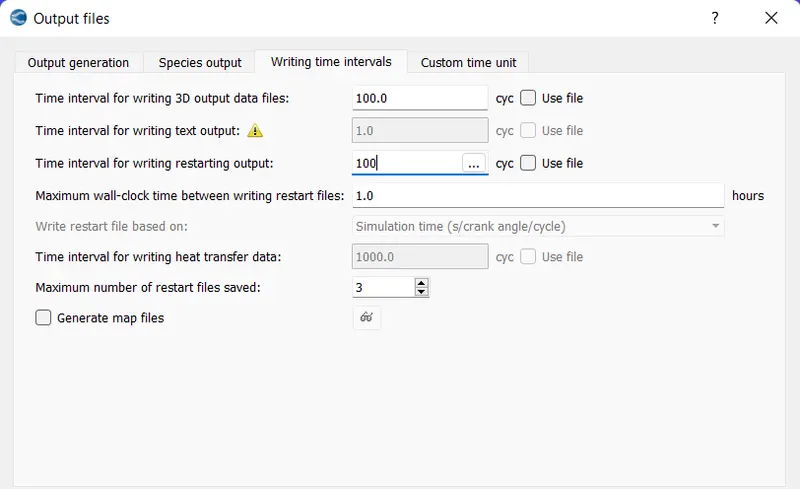
The interval for writting 3d output data files and restarting outputs are defined.
- Exporting the input files to a folder .
- Then the executables is pasted inside the folder.
- The stimulation is run in cygwin for three different base mesh grid sizes.
- The post convert executable is pasted in the output folder (or) the out put file is converted using the converge studio.
- The post conversion is done on cygwin and converted into the type that the paraview reads ie,in vtm format.\
- The results are then post processed using paraview.
- Results:
- case 1:
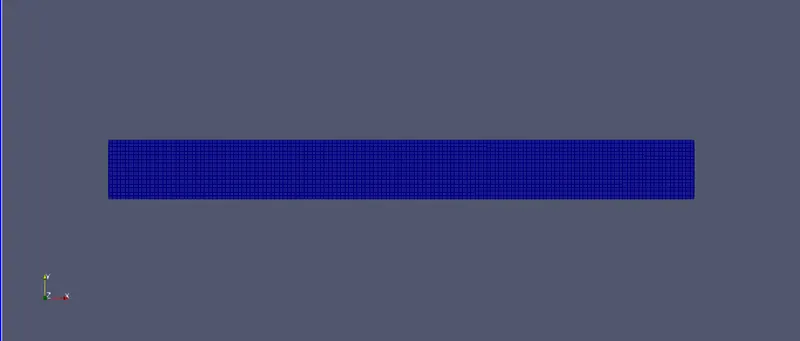
mesh :
Velocity contour:
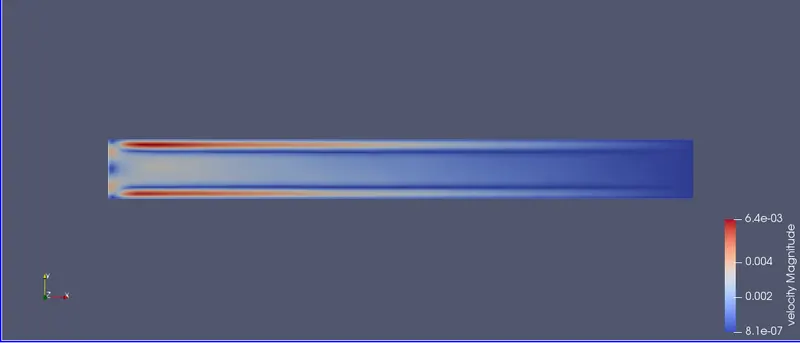
from the above plot we can say that the velocity is high at the starting and keeps on dcreasing and lower near the wall or at the end.
Pressure contour:
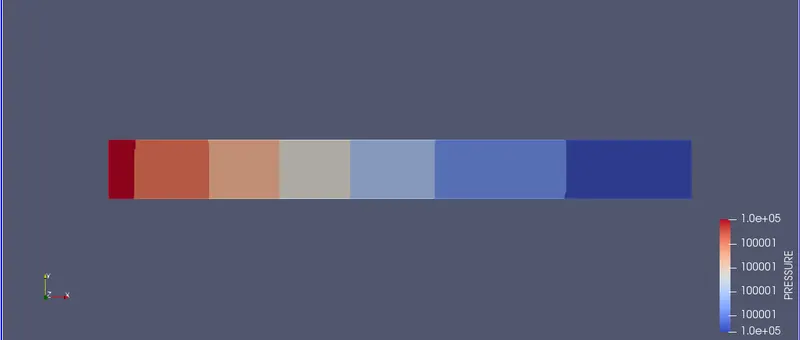
From the above plot ,the pressure is higher at inlet and lower at outlet.due to this pressure difference the flow takes place in the channel.
Velocity profile:
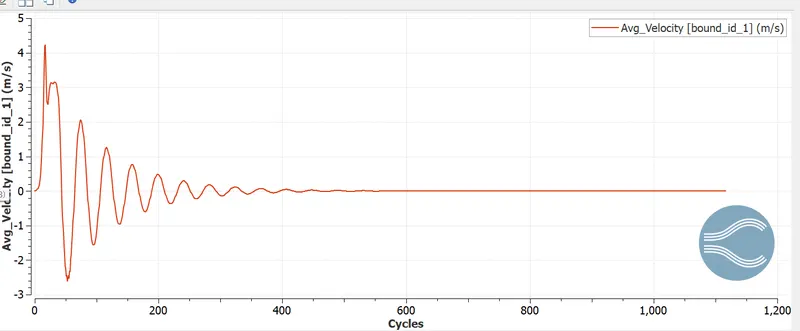
From the plot we can say that the velocity is high at the starting and it gradually decreases and at ceter the velocity is constant.The maximum velocity at inlet is 4.2 m/s.
Pressure profile:
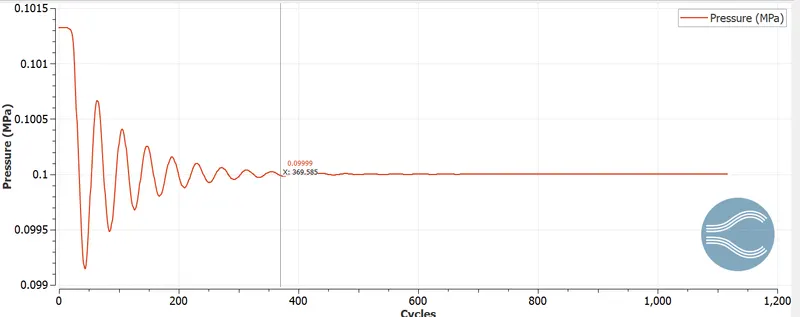
From this plot we can say that the pressure decreases from inlet to outlet.
Cell count:
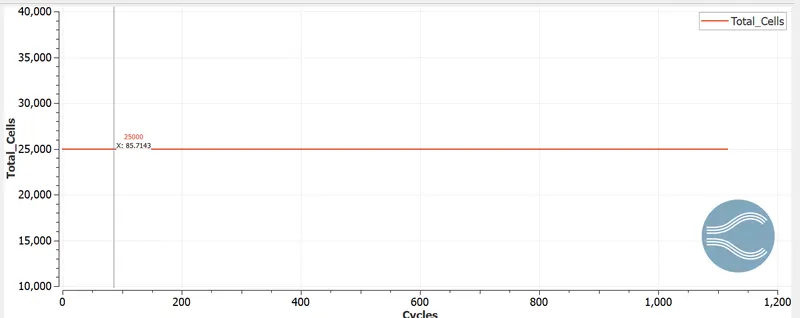
Number of cell count is 25000.
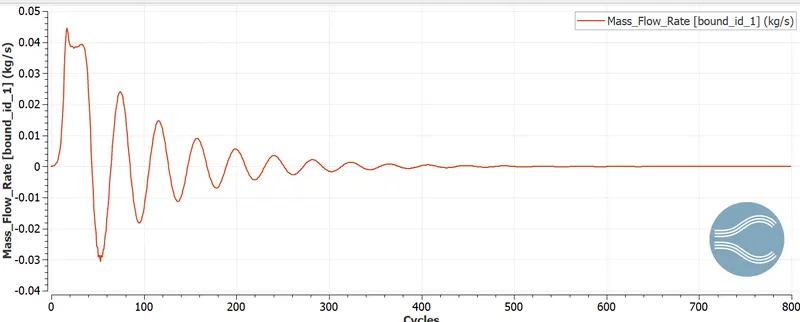
Mass flow rate:
At inlet:
At outlet:
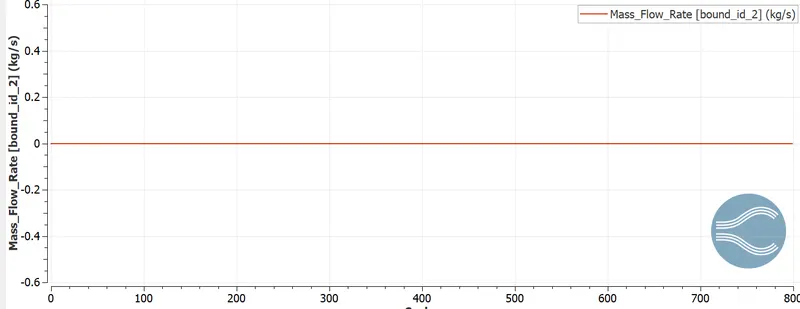
Mass flow rate at inlet and the outlet are equal and the value at initial and end are same 0.01kg/s.
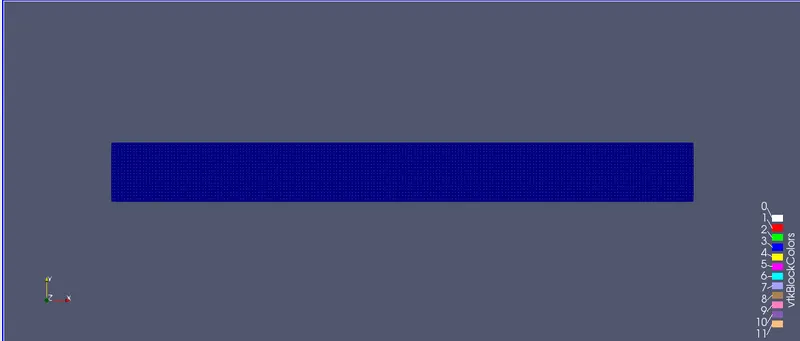
Case 2:
Mesh:
Velocity contour:
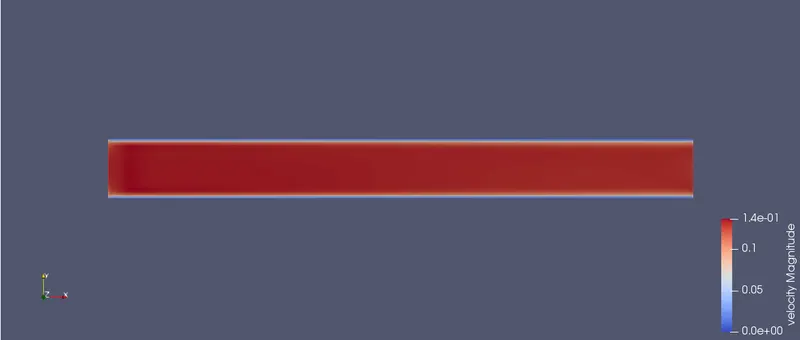
From the plot we can say that the velocity is high at the centre and keeps on decreasing and the lower near the walls.
Pressure contour:
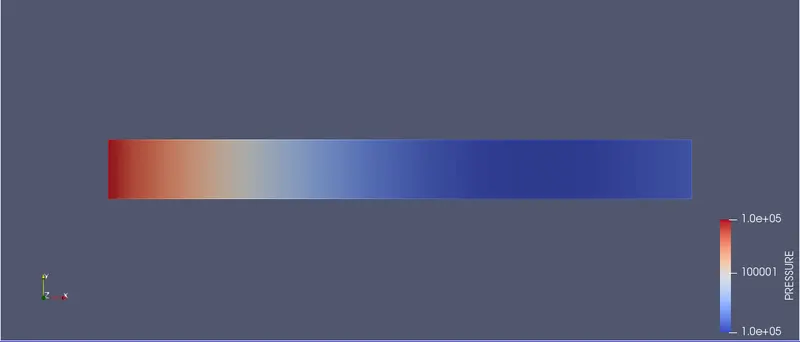
From the above plot ,the pressure is higher at inlet and lower at outlet.due to this pressure difference the flow takes place in the channel.
Velocity profile:
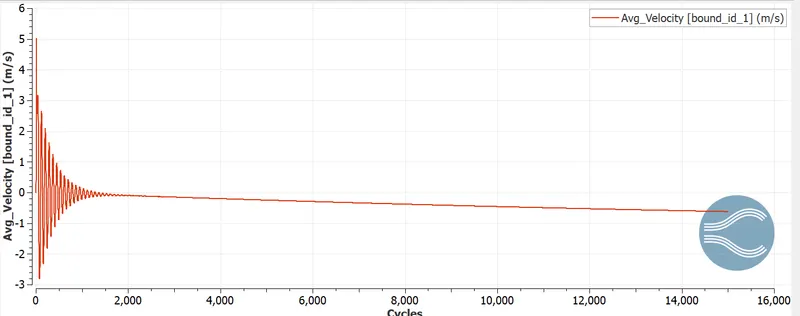
From the plot we can say that the velocity is high at the starting and it gradually decreases and at ceter the velocity is constant.The maximum velocity at inlet is 5m/s.
Pressure profile:
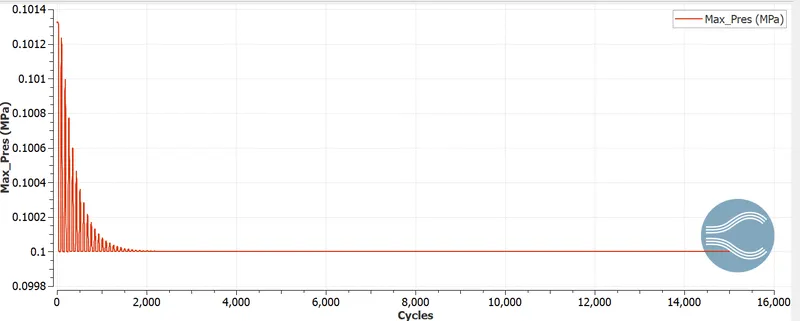
From this plot we can say that the pressure decreases from inlet to outlet.
Cell count:
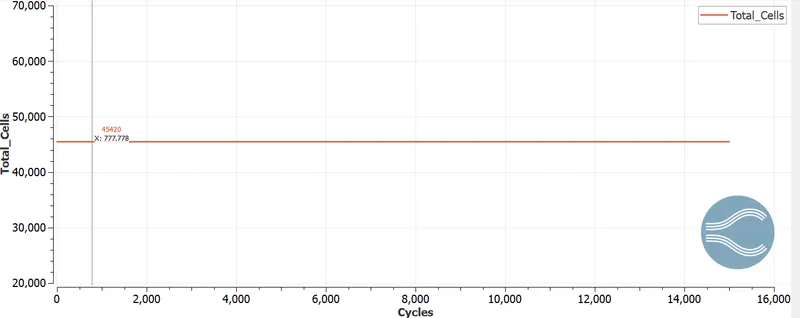
Number of cell count is 45420.
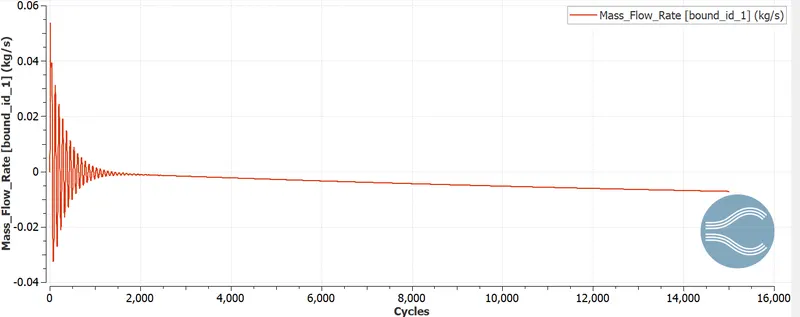
Mass flow rate:
At inlet:
At outlet:
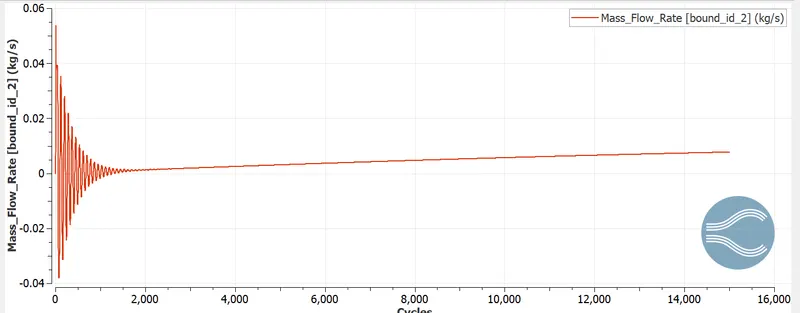
The mass flow rate at inlet and outlet are equal and the value is 0.005kg/s.At inlet the mass flow rate is negative because it flows from inlet boundary.Mass flow rate converges after some number of cycles.
Case 3:
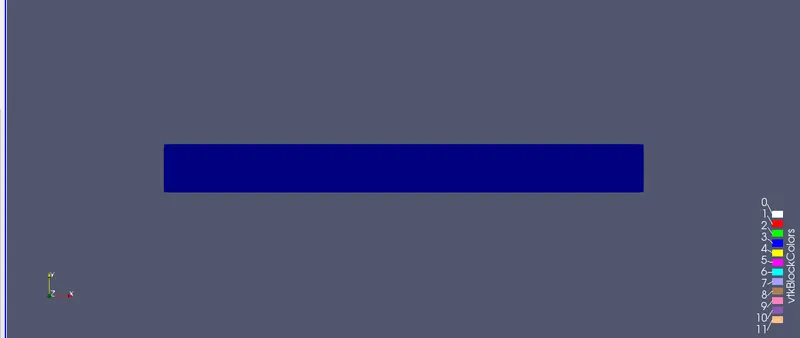
Mesh:
Velocity contour:
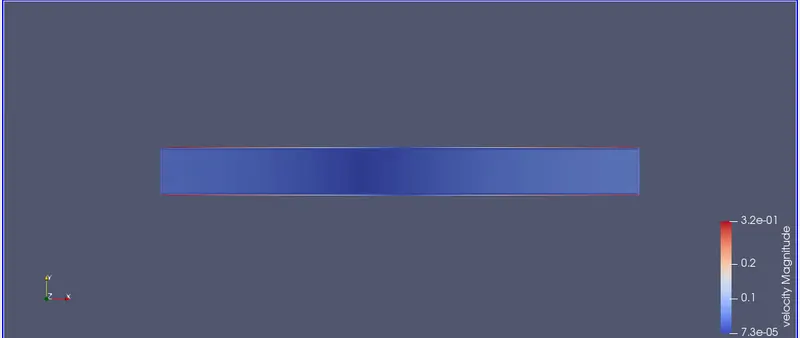
from the above plot we can say that velocity is high at hte centre and keeps on decresing and lower near the walls.
Pressure contour:
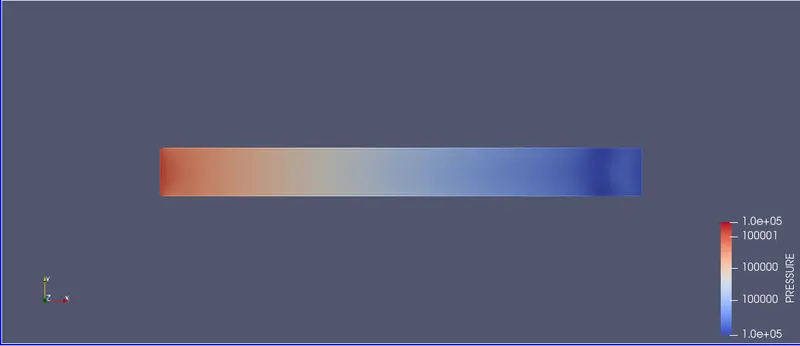
From the above plot ,the pressure is higher at inlet and lower at outlet.due to this pressure difference the flow takes place in the channel.
Velocity profile:
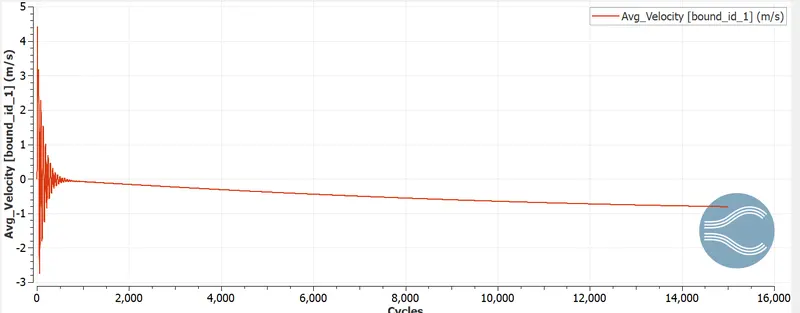
From the plot we can say that the velocity is high at the starting and it gradually decreases and at ceter the velocity is constant.The maximum velocity at inlet is 4.2m/s
Pressure profile:
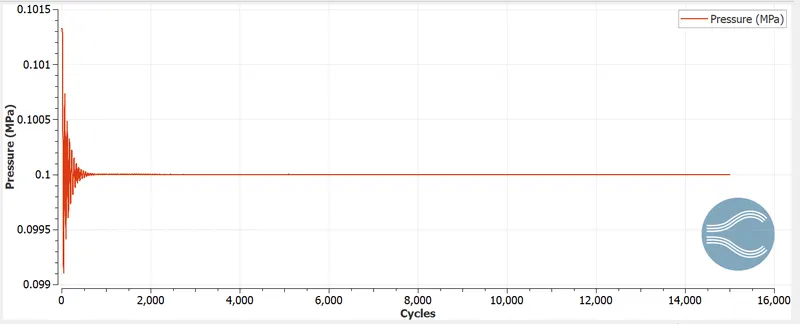
From this plot we can say that the pressure decreases from inlet to outlet.
Cell count:
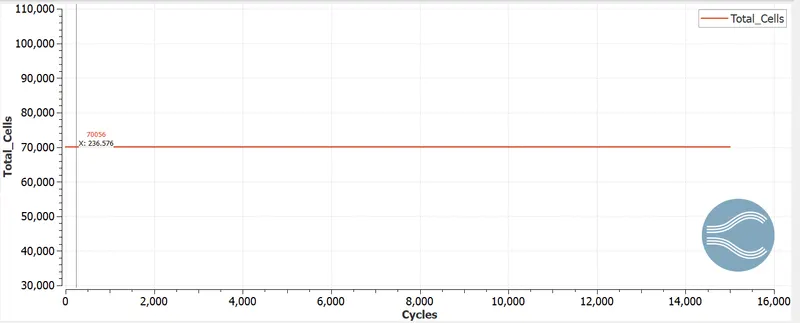
Number of cell count is 70056.
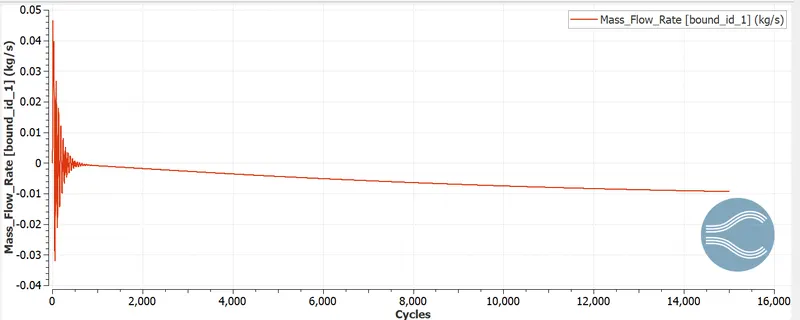
Mass flow rate:
At inlet:
At outlet:
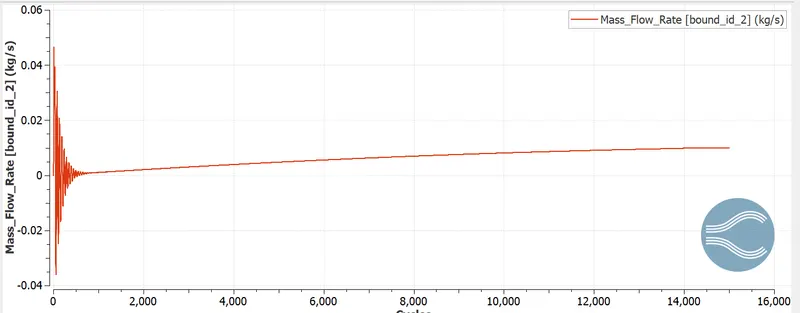
The mass flow rate at inlet and outlet are equal and the value is 0.008kg/s.At inlet the mass flow rate is negative because it flows from inlet boundary.Mass flow rate converges after some number of cycles.
Animation of velocity contour plot:
The animation shows how the velocity changes with respective to time.
Conclusion:
From all the plots we can say that as the mesh size decreases the results are more accurate and it also increases the computational time.