Week 4.2: Project - Transient simulation of flow over a throttle body
Aim:
Setup and run the transient simulation for flow over throttle body.
Objectives:
- Post process the results and show pressure and velocity contours.
- Show the mesh.
- Show the plots of pressure,velocity,mass flow rate,and total cell count.
- Create an animation.
Theory:
In this transient simulation,the throttle is rotating and we are intrested to stimulate the flow at a different opening angle of the throttle.
The main function of a throttle body assembly is to control the air flow into the engine based on vehicle demand.The throttle body is mounted between the air cleaner and the intake manifold.Following the angle of the throttle valve changes,it restricts the amount of airflow into the engine cylinder.
It has a venturi to reduce the pressure of the air flowing through it.The intake flow is throttled by reducing the flow area.This is done by providing a circular shaft known as throttle shaft and is mounted with a butterfly valveat the downstream of the ventures.The position during transient operation of the engine,which introduces additional problems as the buerfly position frequently changed as per driver demand.
The airflow can be considerd as unaffected by the fuel flow.However ,the the reverse is not true and fuel flow strongly depends upon the airflow.The schematic of a throttle body asemmbly describing the airflow path.
Governing equations:
Gain of mass in X-direction = - (∂ / ∂x) (ρ u dx.dy.dz)
Similarly, we will have following equations for mass gain in Y-direction and Z-direction
Gain of mass in Y-direction = - (∂ / ∂y) (ρ v dx.dy.dz)
Gain of mass in Z-direction = - (∂ / ∂z) (ρ w dx.dy.dz)
Net gain of masses = - [∂ / ∂x (ρ u) + ∂ / ∂y (ρ v) + ∂ / ∂z (ρ w)] dx.dy.dz
∂ρ/∂t + ∂ / ∂x (ρ u) + ∂ / ∂y (ρ v) + ∂ / ∂z (ρ w) = 0
Above equation is the continuity equation in Cartesian co-ordinates in its most general form. This equation will be applicable to following types of fluid flow.
Boundary conditions:
In the study,three types of boundaries are there involved(inlet,outlet,wall).
- Inlet pressure boundary conditions aree used to define the fluid pressure at the flow inlet
- Outlet boundary conditions require the specification of the static pressure at the outlet boundary.
Case setup and simulation setup:
Material:
- As only air is our working medium hence uncheck the reaction mechanism.
- Predefined mixture - Air.
Global transport porperties:
- Turbulent prandti number:0.9
- Turbulent schmidti number:0.78
Simulation setup:
Run parameters:
- Solver: pressure based transient solver
- Simulation mode:full hydrodynamic
- Gas flow solver:compressible.3
Simulation time parameter:
- End time:0.01 s.
- Start time:0.
- Initial time step:1e-9.
- Minimum time step:1e-9.
- Maximum time step:1s.
Solver type:
Boundary:
- Naming :select faces and name as inlet,outlet,elbow wall,throttle wall.
- boundary conditions:
Inlet
- Boundary type:inflow.
- Total pressure:1.5e5 pa.
- Species boundary condition:air.
Outlet
- Boundary type:outflow.
- total pressure:1e5pa.
- Add spices:air.
Elbow wall:
- Boundary type:wall.
Throttle wall
- Boundary type:wall.
- wall motion type:rotating.
- Velocity BT:Law of wall.
- Temperature BT:law of wall.
Region and initializations:
- Click on region and initialization.
- Add species :air.
Base grid:
- dx,dy and dz=0.002m.
Post variable selction:
- The time interval for writting 3D output files=0.001.
- The time interval for eritting restarting output file=0.001.
Results:
Contours
pressure contour:
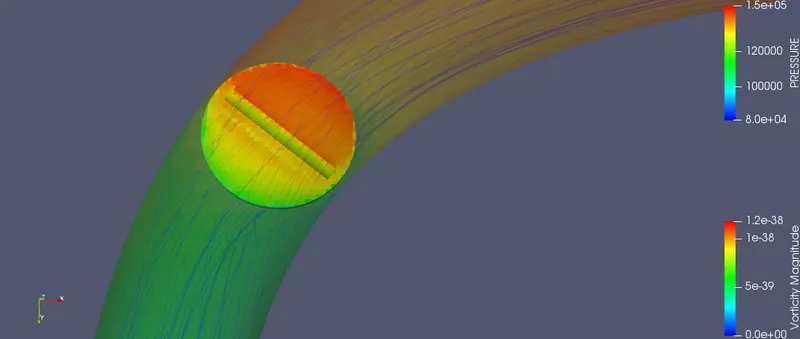
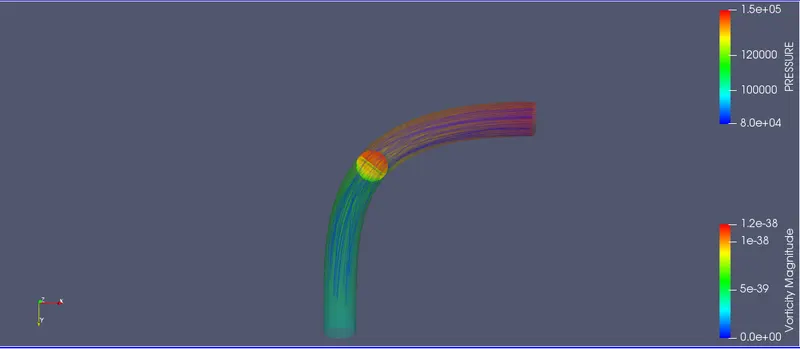
Inlet total pressure is1.5e5pa and outlet static pressure is 1e5pa.
Pressure distribution around the throttle :
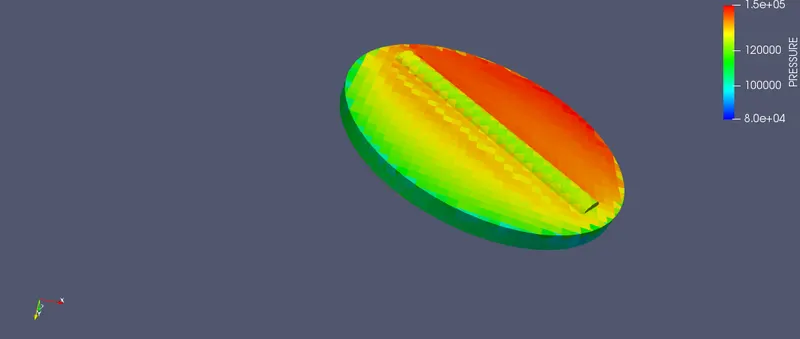
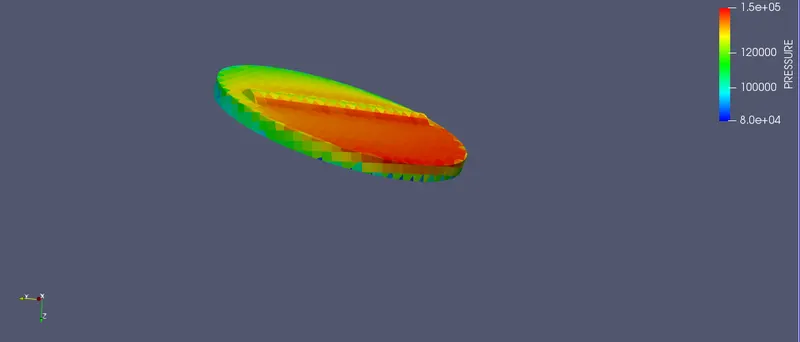
- From the above contour ,we can see the high pressure and low pressure region around the throttle.
- The upstream region area of the throttle where the flow is impinging has higher pressure and on the back portion of the throttle ,the pressure is minimum due to flow seperation and vaccum creation.
Velocity contour:
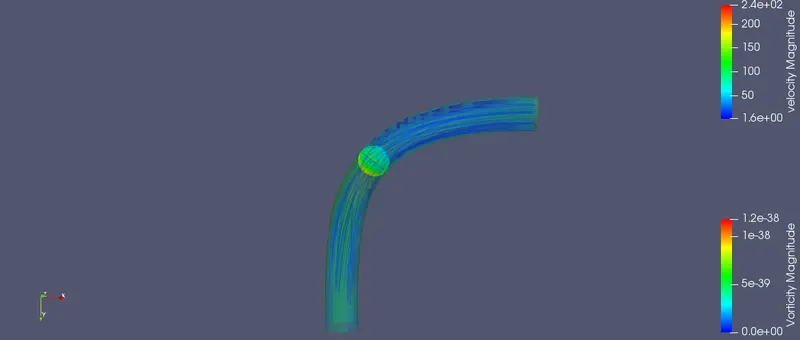
From the above velocity contour ,we can see that,as the flow progress through the elbow ,the velocity increases.
Velocity streamlines:
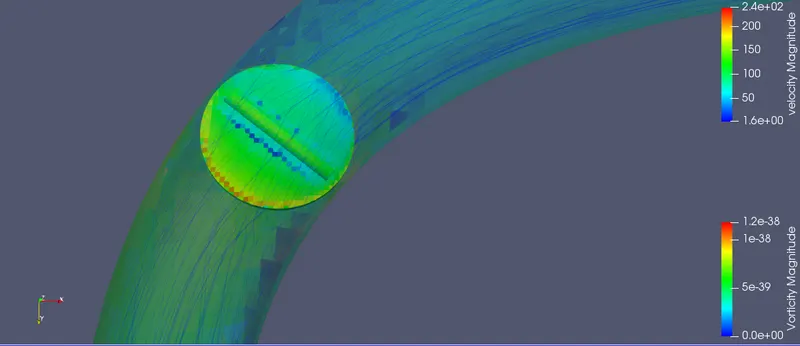
- The velocity is maximum at the side of the throttle due to creation of low area region.
- And there is a negative pressure behind the throttle due to sudden breaking of flow.
- Behind the throttle,the velocity is minimum because there is a flow seperation,leaving vaccum or low -pressure space in which air is not able to fill properly.
- This leads to the formation of vortices due to changing of velocity gradient from positive into a negative value at this point.
- This point is called a point of seperation.
Mass flow rate:
Velocity plot:
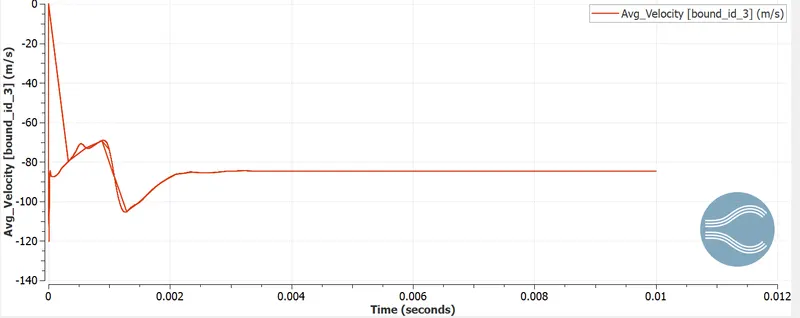
From the above plot ,we can see that the velocity of 85 m/s converges at around 0.01 seconds.
Pressure contour:
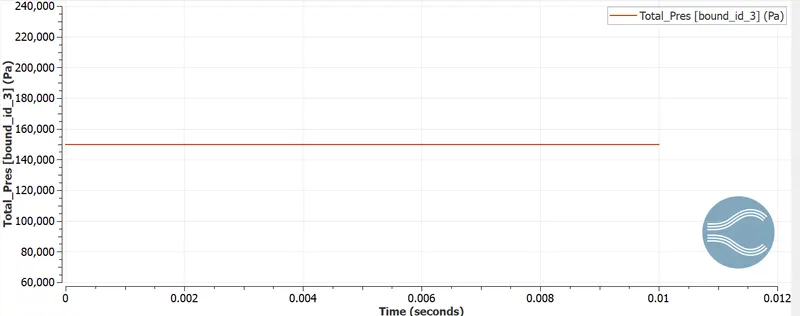
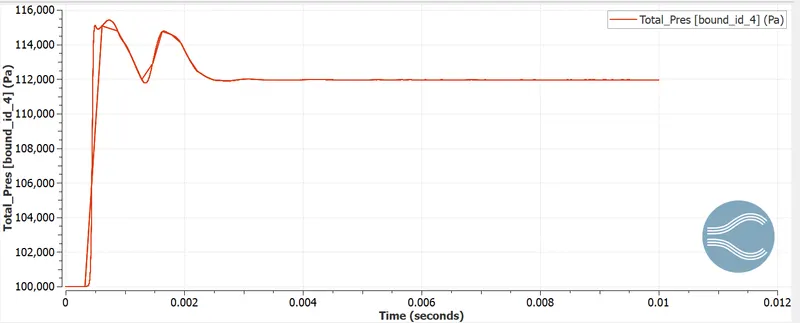
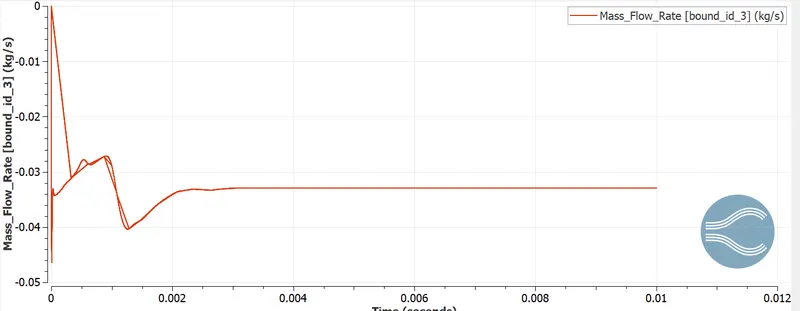
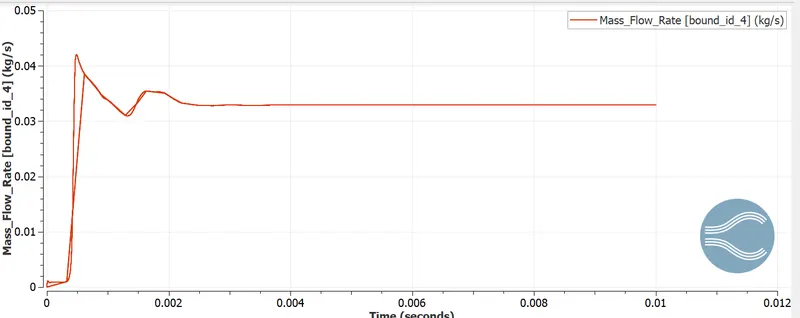
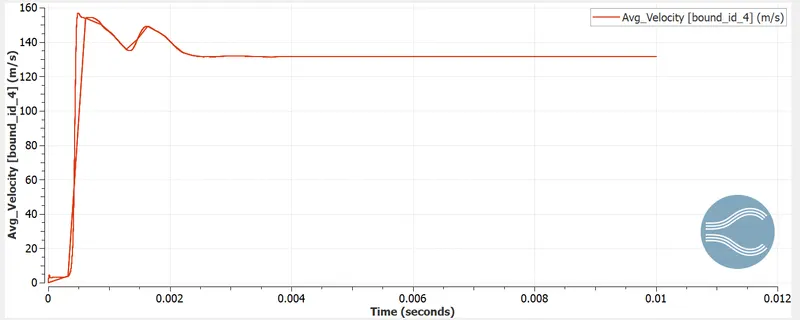
From the above plot pressure ,velocity and mass flow rate ,we can see that mass flow rate and velocity increase rapidly from the time of 0-2 millisecond for the value angle of 25 degree whereas the pressure reduces rapidly.This is due to the sudden decrease in the area which acts as a venturi or as a nozzle.Further increase in the area hence pressure reduces gradually , and velocity and mass flow rate increase gradually.After 8 milliseconds the pressure,velocity, and the mass flow rate is constant.
Total cell count:
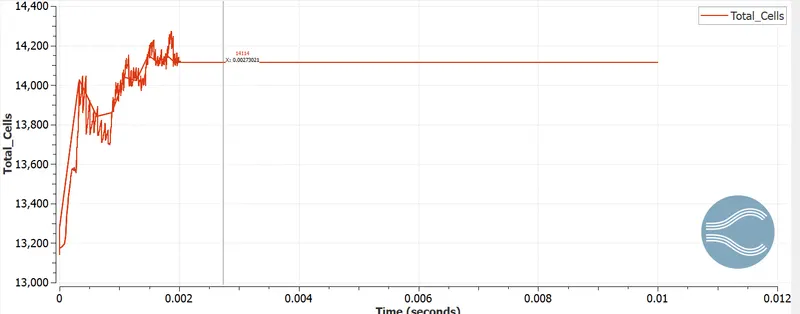
The cell count fluctuates due to the movement of the throttle . It is also called as the dynamic meshing .And it has a total cell count of 14114.
Mesh:
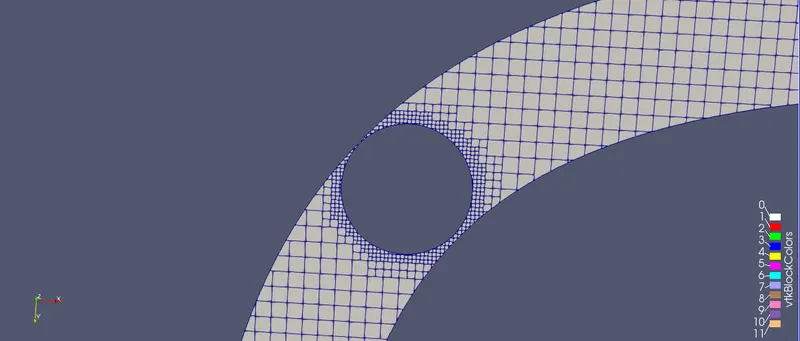
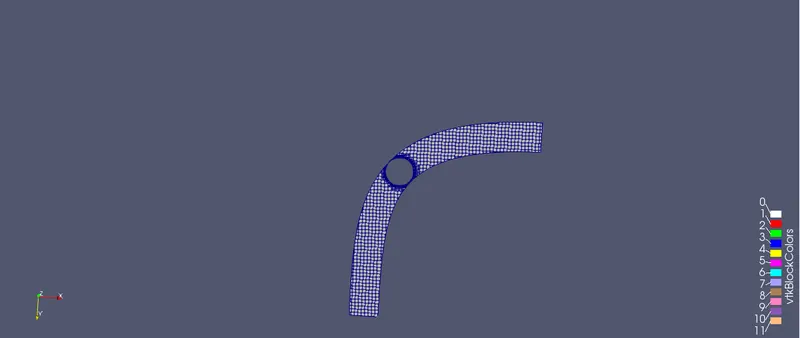
Animation:
velocity animation link
Pressure animation link
Conclusion:
- As the mass flow rate and velocity increases rapidly for the time of 0-2 ms for the value angle 25 degrees whereas the pressure reduces rapidly.This is due to sudden decrease in the area which acts as a nozzle.
- Further increases in time from 4-8ms,the value regain its original position which creates increase in the area hence pressure reduces gradually,and velocity and mass flow rate increases gradually.
- After 8 ms the mass flow rate,velocity and pressure is constant
- The cell count fluctuates due to the movement of throttle.It is also called as the dynamic meshing.
- For 0-2 ms,the area is reducing ,therefore cell count have to increase and mesh has to become finer to capture the physics accurately at the minimum region.
- After 4-8ms,the cell count have to decrease.
- After 8ms,the throttle position is constant hence no changes in the cell count.
- Behind the throttle ,the velocity is minimum because there is a flow seperation,leaving vaccum or low pressure space in which air is not able to fill properly.
- This leads to formation of vortices due to changing of velocity gradient from positive into a negative value at this point.
- This is called point of seperation.
- Boundary layer seperation beyond which a circular flow pattern is established.