Week 4.1: Project - Steady state simulation of flow over a throttle body
CONVERGE CFD- SIMULATION OF FLOW OVER A THROTTLE BODY:
OBJECTIVE :
- To perform steady-state simulation of fluid flow over a throttle body .
- To post- process results and show pressure and velocity contours for both the cases
- To show the plots for pressure,velocity,mass flow rate and total cell count.
Throttle Body:
A throttle body is essentially a large air valve that sits between the intake manifold and the air intake pipe . An engine has one throttle body, Which bolts to the intake manifold's plenum (the large air cavity in the center).A throttle body controls airflow into the engine's air and fuel ratio.Throttle bodies come in different shape,size and configuration and can performs several tasks outside of their normal air-metering duties.
Throttle bodies usually uses BUTERFLY VALVES.These valves consists of a casing with large holes in the center,which is filled with a steel plate called a buterfly or throttle plate .The throttle valve is a shaft is a rod that passes through the housing and is connected to a shaft cable on the outside and throttle plate on the inside.When the throttle valve turns ,it rotates the throttle plate ,allowing air to go around it and into the engine.
Steady state simulation:
A steady-state simulation is used to investigate the steady-state behaviour of a system,where the stimulation continues untill the system reaches the steady state.
Like steady-state model,dynamic models are based on first principles that cannot be voilated. The most significant difference between steady-state and dynamic stimulation is that steady-state assumes that variables are constant with respect to time.This means that in steady-state there is no accumulation in the system, so the overall mass and energy input matches its output.Coversly, dynamic models consider the mass and energy rate of accumalation within the system ,which allow one to determine how long it would take to reach the stable condition starting from a specified intial stage.
CONVERGE GEOMENTRY:
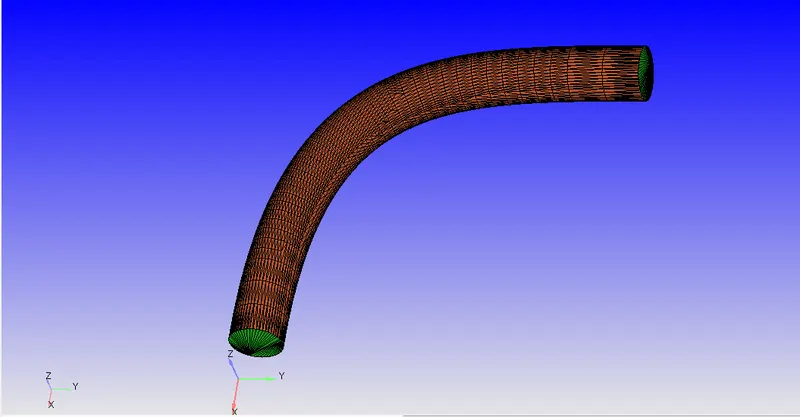
For the steady-state analysis ,the throttle body is kept in the wide-open postion as can been seen from below
Meshing technique:
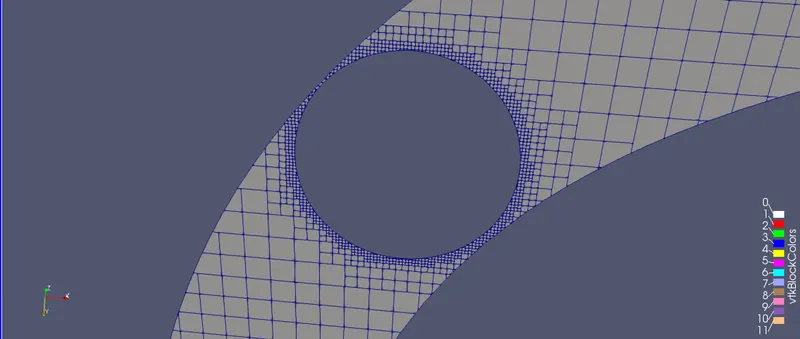
Converge CFD uses a cut-cell cartisian method.One of the most obvious benefits of the cut-cell cartisian approaches is the fact that you have a body-fitted mesh.This ultimately means that your geomentry,reducing the number of inaccuracies that propagate through the rest of the domain.Because of this,the cut-cell cartisian approach makes handling complex and moving geomentry much easier and accurate by cutting the cells rather than streching and compressing the cells to fit.The other benifits of the cut-cell cartisian method is added cell refinement at the wall,as this will have a positive impact on accuracy.Mesh refinement can performed at locations where the flow properties need to be captured accurately.A method called FIXED EMBEDDING is deployed in this case with the region near the throttle body being the region of intrest.
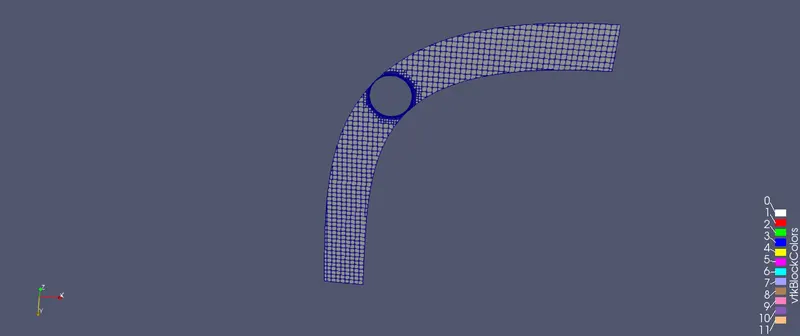
The scaling factor of 3 has been used with 2 layers of fixed embedding.The base grid used in the simulation is 2e-3 in x,y and z direction.The refined mesh near the throttle valve and the base mesh can be seen below.
Pre-processing:
case setup:General flow
Materials:
predefined mixture:Air
Simulation parameters:
Solver:pressure based steady solver
Mode:Full hydrodynamic
Start time:0
End time:15000 cycles
Initial time-step:1e-9s
Minimum time step:1e-9s
Maximum time step:2s
Region and initialization:
Added region:Air
Pressure:101325pa
Species:Air
Boundary condition:
inlet:inflow -1.5e5pa
Outlet:outflow-1e5pa
Throttle and elbow wall:wall
Velocity boundary conditions:law of wall
Wall motion:stationary
Surface movement:fixed
Temperature boundary condition:law of wall(300k)
Base grid:
Mesh in dx,dy & dz directions=2e-3
fixed embedding:
- Fixed embedding is used to refine the mesh around the desired regions
- The regions of interst are the inner wall of the channel
- The fixed embedding is applied with a scale of 3 and 2 embedded layers.
output files:
- Time interval to write 3D output data files-150
- This means that every 150 cycles 3D ouput data files will be written and saved.
- Since we are running the simulation for15000 cycles,we shall have 150 3D output data files.
Results:
1.Mass flow rate:
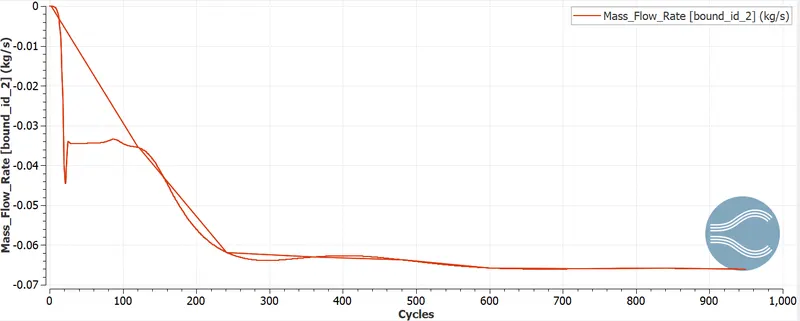
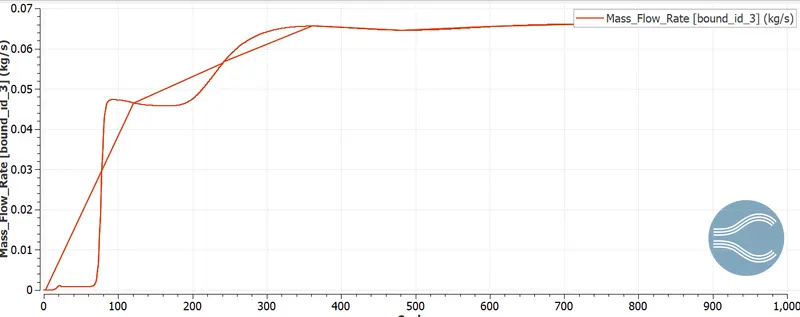
For a steady-state simulation, it is of utmost important to check if convergence has been attained.
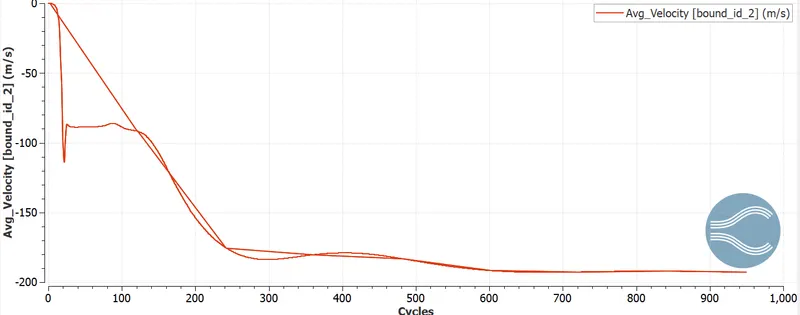
Converge of both inlet and outlet section occurs at approx 0.0065 kg/s.mass flow rate after approx 4000 cycles.The negative sign at the inlet indicates that htew flow is into the system and the positive side indicates that the flow is out of the system.
bound_id_2=inlet.
bound_id_ 3=outlet
2.Total cell count:
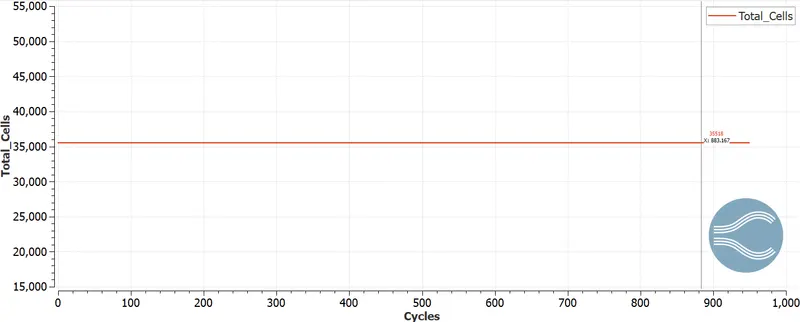
The geomentry has been diveded into around 35518 cells.
3.Velocity contour:
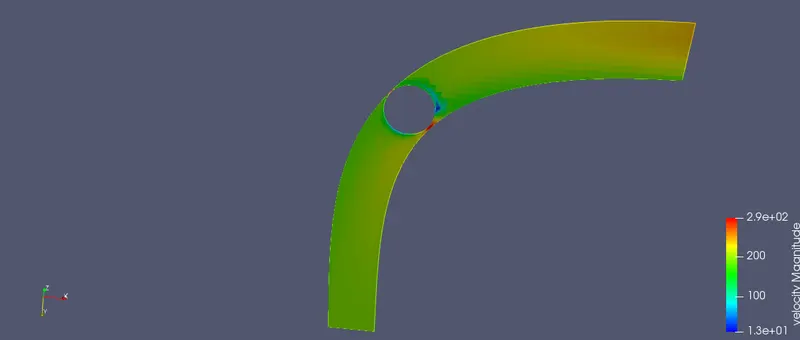
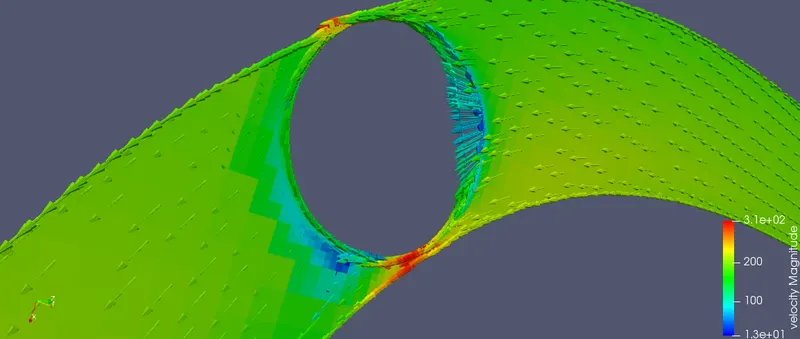
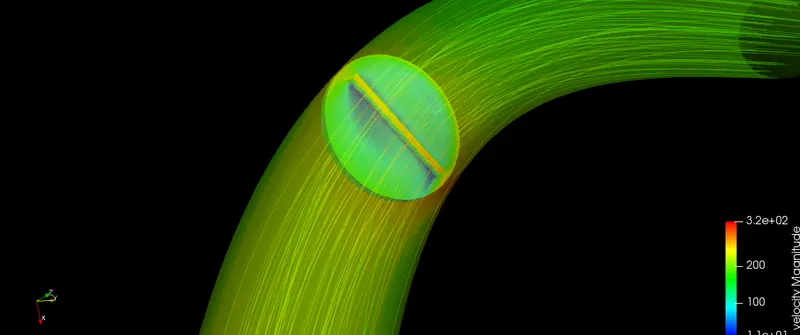
We can see that the results of the varying velocity across a throttle body.The throttle valve is in a wide-open position due to which the maximum amount of the fluid can pass through that region from inlet to outlet.
But the throttle body still creates some disturbance as the minimum area ao it is still in between the fluid path.due to this,there is a reduction in fluid velocity,the blue colour shows the sudden decrease in velocity around the throttle edges where the fluid where the fluid strikes from the inlet side.The average velocity of flowing fluid in a pipe is between 150-200 m/s with a max velocity equal to approx.300m/s and min.velocity equal to approx 30m/s around the throttle valve edges.
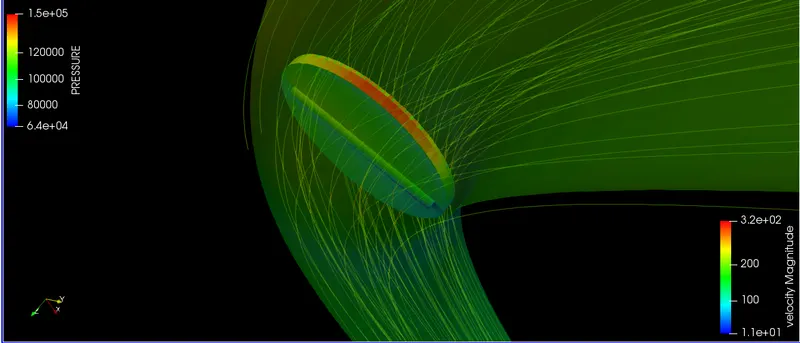
`4.Pressure contour:
Inlet side
Outlet side
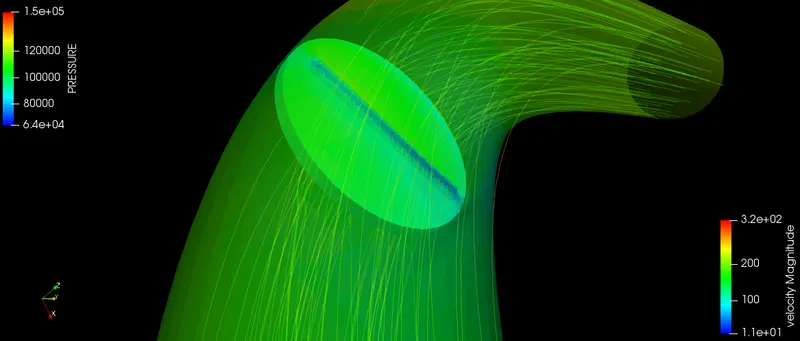
Pressure distribution profile
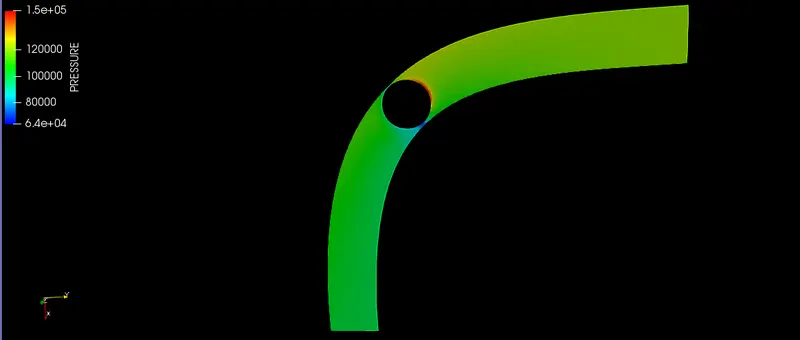
As we know from the results of velocity contour that when the fluid strikes down at the throttle body edges from the inlet side,its velocity decreases. The pressure is inversly proportional to the velocity and from above.we can see the maximum pressure at the region where the velocity becomes minimum.Simillarly ,on the outlet side,pressure dcreases with the increase in velocity.
Animation links:
velocity and pressure contour animation links: