Project 1 - Parsing NASA thermodynamic data
AIM:
Parsing NASA thermodynamic data
THEORY:
- The official record of thermodynamic values at different temperatures has been stored by NASA in the form of polynomials with specified constants ranging from one to fourteen for various species.
- In order to quantify the values, the polynomials can be solved with defined temperature values in accordance with our requirements.
- The term ‘parsing’ refers to MATLAB reading an m-file (script or function) and translating it into an internal code that it stores in memory.
- It is this ‘parsed’ file in memory that is actually run when you execute the code.
GOVERNING EQUATION:
1. Specific heat:
C_P/R =a1+a2*T+a3*T^2+a4*T^3+a5*T^4
2.Enthalpy:
H/RT = a1+a2×T/2+a3×T2/3+a4×T3/4+a5×T4/5+a6/T
3. Entropy:
S/R = a1×lnT+a2×T+a3×T2/2+a4×T3/3+a5×T4/4+a7
Where ,
cp = Specific heat
H = Enthalpy
S = Entropy
R = Universal gas constant
T = Temperature
The First 7 Coefficients are High Temperature Coefficients and the Second 7 Coefficients are Low Temperature Coefficients.
OBJECTIVE:
- Write a function that extracts the 14 co-efficients and calculates the enthalpy, entropy and specific heats for all the species in the data file. You will be reading this file NASA thermodynamic data
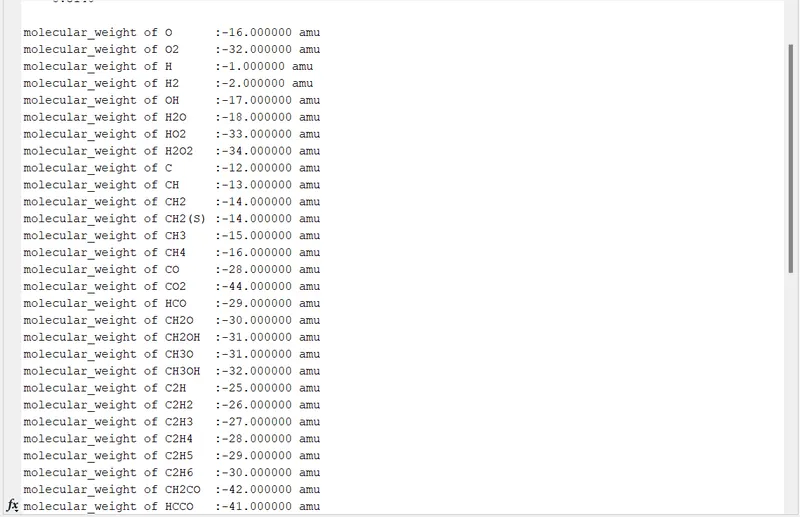
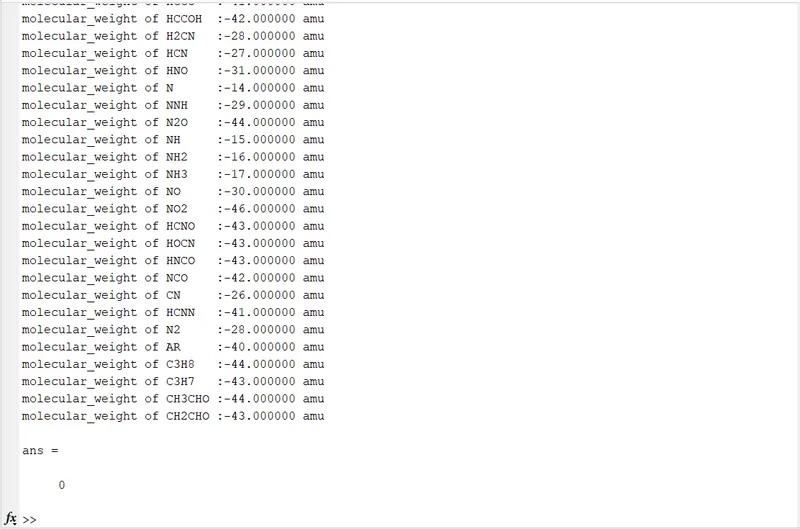
- Calculate the molecular weight of each species and display it in the command window.
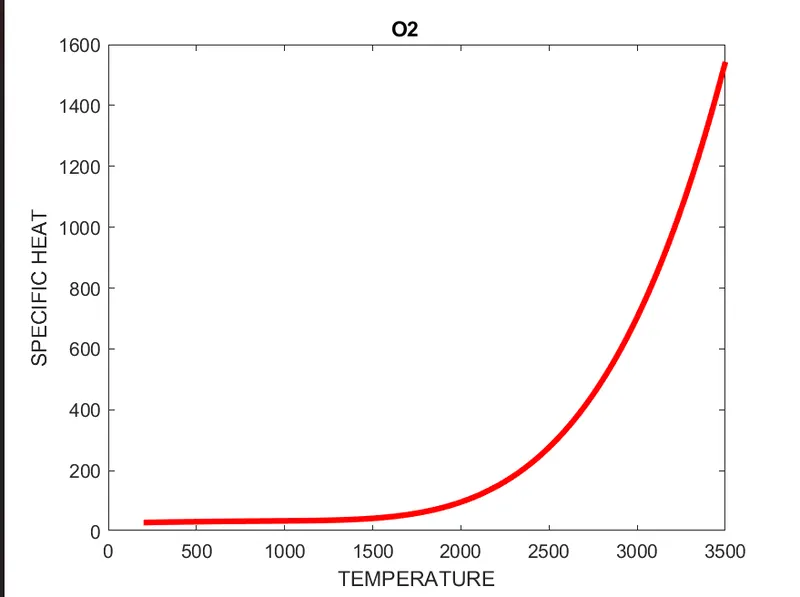
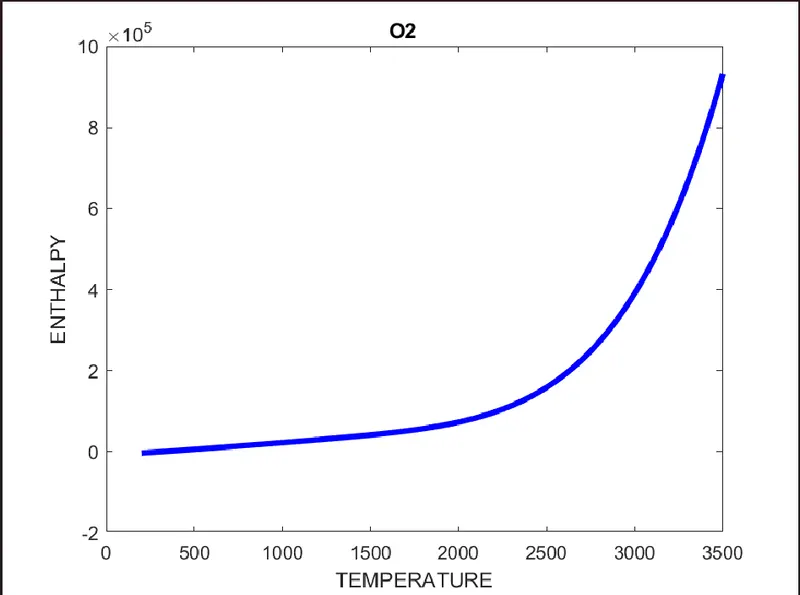
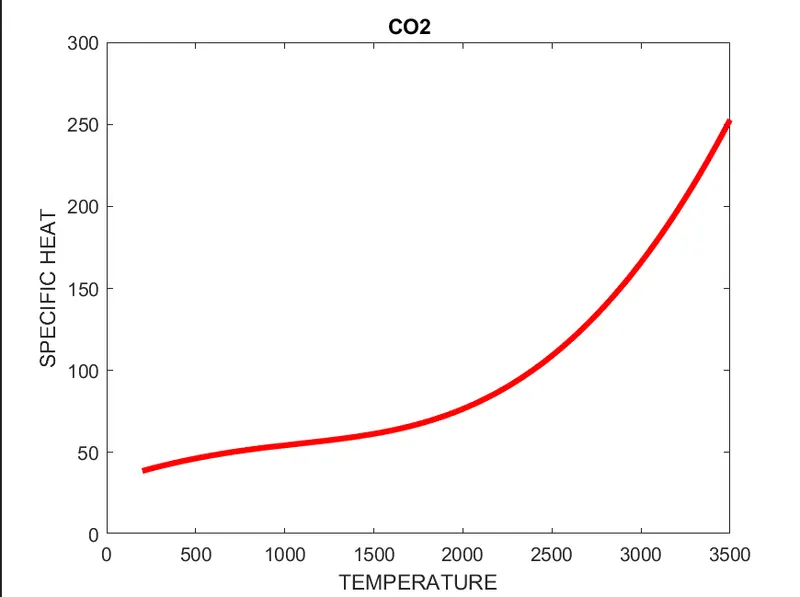
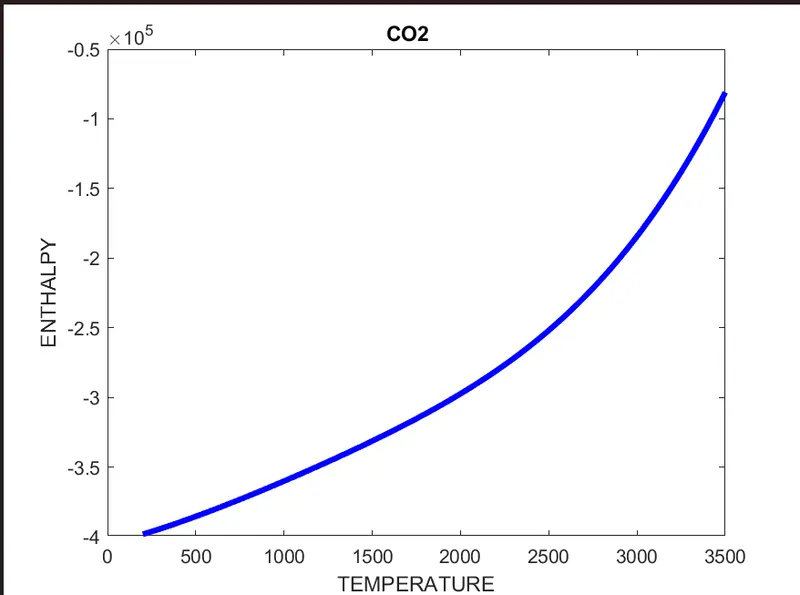
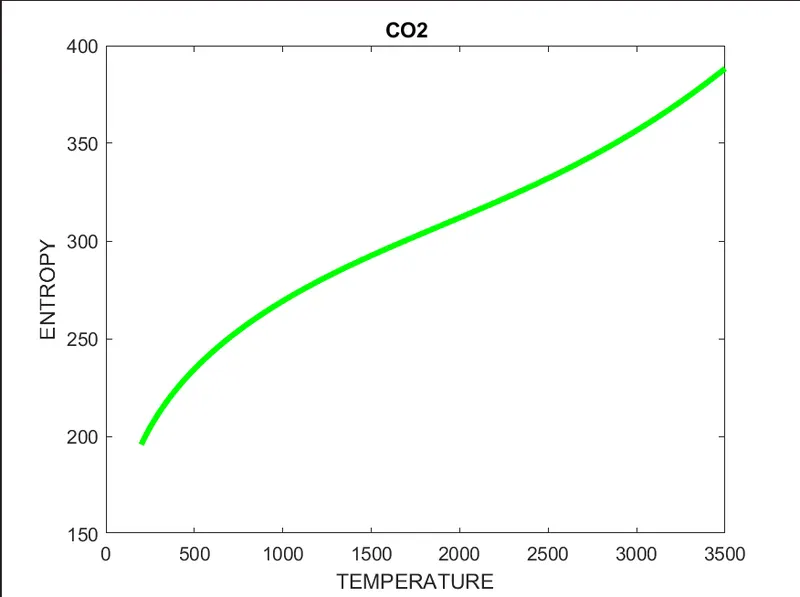
- Plot the Cp, Enthalpy and Entropy for the local temperature range (low temperature : high temperature) specific for each species.
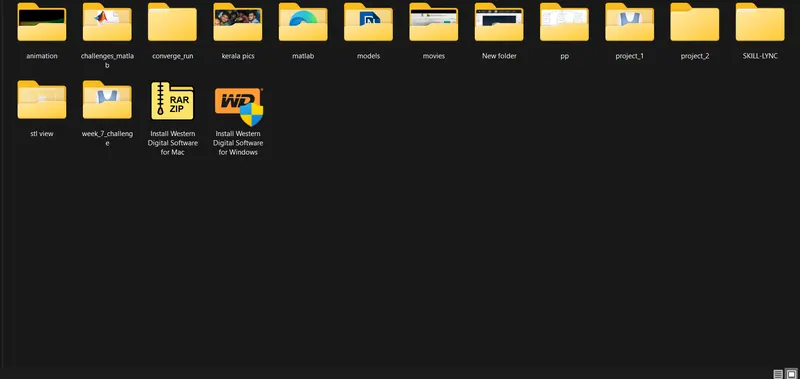
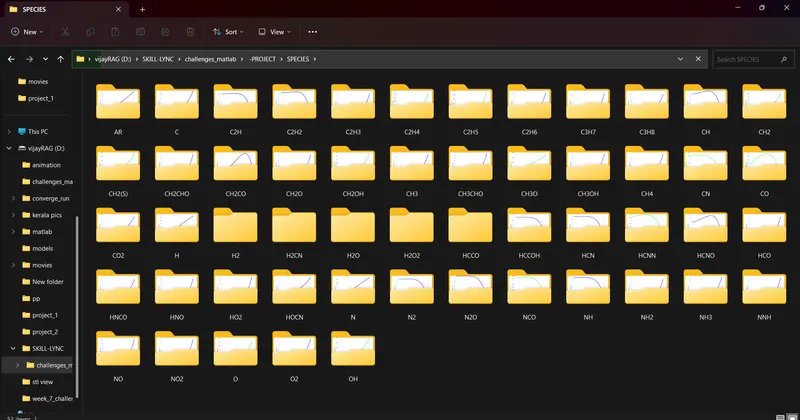
- Save the plots as images with appropriate names and dump them in separate folders for each species with suitable name. All these should be generated automatically.
FUNCTION PROGRAM_1: Calculating thermodynamic properties (specific heat, enthalpy, entropy)
function [cp,h,s] = nasa(a1,a2,a3,a4,a5,a6,a7,a8,a9,a10,a11,a12,a13,a14,R,T,l_midtemp)
for j = 1:length(T)
    if T(j)
FUNCTION PROGRAM_2: Calculating molecular weight of species mentioned in data file
function [molecular_weight] = mole_weight(species_name)

SPECIES = upper(species_name)
elements = {'H','C','N','O','A'};
atomic_weight = [1 12 14 16 40];

molecular_weight = 0;
for i = 1:length(SPECIES)
    for j = 1:length(elements)
        if strcmp(SPECIES(i),elements(j))
            molecular_weight = molecular_weight + atomic_weight(j);
            u = j;
        end
    end

    n = str2double(SPECIES(i));
    if n > 1
        molecular_weight = molecular_weight + atomic_weight(u)*(n-1);
    end
end
fprintf('molecular_weight of %s :-%f ',species_name,molecular_weight)
fprintf('amu')
fprintf('\n')

end
MAIN PROGRAM:
close all
clear all
clc

% Reading the file and opening the "THERMO.dat' file
f1 = fopen('THERMO.dat','r');
gt = fgetl(f1);

% obtaing the temperature by reading the headder information
global_temp = fgetl(f1);
s = strsplit(global_temp);
% Coverting the strings to numberusing 'str2num'
global_temp_low = str2num(s{2});
global_temp_mid = str2num(s{3});
global_temp_high = str2num(s{4});
% temperature range and gas constant \
temp = linspace(global_temp_low,global_temp_high);
R = 8.314 % gas constant
% skipping the header line
for i = 1:3
    gt = fgetl(f1);
end
% finding the local temperature
for i= 1:53
A = fgetl(f1);
species_name = A(1:6);
s = strsplit(A,' ');
l_lowtemp = str2double(s{end-3});
l_hightemp = str2double(s{end-2});
l_midtemp = str2double(s{end-1});
T = linspace(l_lowtemp,l_hightemp,1000);
% finding the 1st 7 higher and 2nd lower coefficients
% higest coeeficients
tline_1 = fgetl(f1);
pos_e = strfind(tline_1,'E');
a1 = str2double(tline_1(1:pos_e(1)+3));
a2 = str2double(tline_1(pos_e(1)+4:pos_e(2)+3));
a3 = str2double(tline_1(pos_e(2)+4:pos_e(3)+3));
a4 = str2double(tline_1(pos_e(3)+4:pos_e(4)+3));
a5 = str2double(tline_1(pos_e(4)+4:pos_e(5)+3));

tline_2 = fgetl(f1);
pos_e1 = strfind(tline_2,'E');
a6 = str2double(tline_2(1:pos_e1(1)+3));
a7 = str2double(tline_2(pos_e1(1)+4:pos_e1(2)+3));
% 2nd 7 lower coefficients
a8 = str2double(tline_2(pos_e1(2)+4:pos_e1(3)+3));
a9 = str2double(tline_2(pos_e1(3)+4:pos_e1(4)+3));
a10 = str2double(tline_2(pos_e1(4)+4:pos_e1(5)+3));

tline_3 = fgetl(f1);
pos_e2 = strfind(tline_3,'E');
a11 = str2double(tline_3(1:pos_e2(1)+3));
a12 = str2double(tline_3(pos_e2(1)+4:pos_e2(2)+3));
a13 = str2double(tline_3(pos_e2(2)+4:pos_e2(3)+3));
a14 = str2double(tline_3(pos_e2(3)+4:pos_e2(4)+3));

% creating folder 'SPECIES' TO SAVE thermodynamic plots of species
mkdir(['D:\SKILL-LYNC\challenges_matlab\ -PROJECT\SPECIES\',species_name]);

% calling the function
[cp,h,s] = nasa(a1,a2,a3,a4,a5,a6,a7,a8,a9,a10,a11,a12,a13,a14,R,T,l_midtemp);

% plotting
% plotting between temperature and specific heat
figure(1);
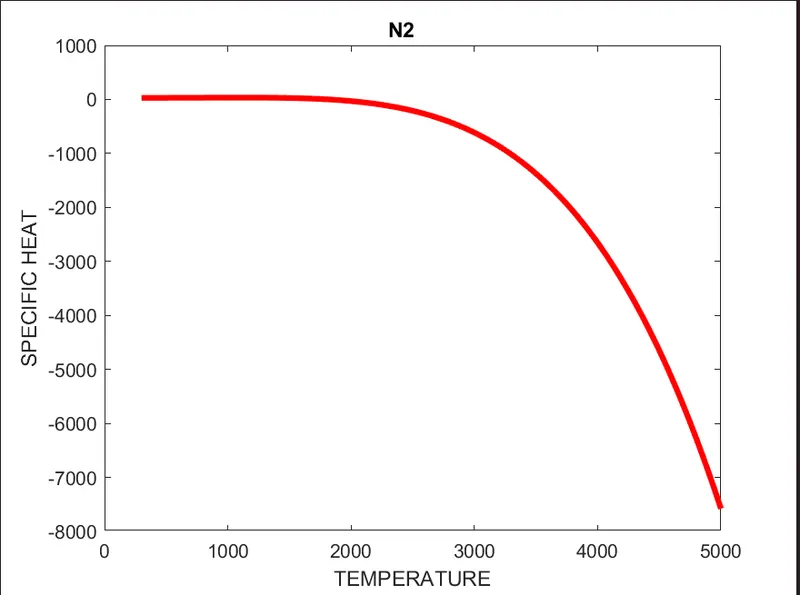
plot(T,cp,'LineWidth',3,'Color','r');
title(species_name);
xlabel('TEMPERATURE');
ylabel('SPECIFIC HEAT');

% plotting between temperature and enthalpy
figure(2);
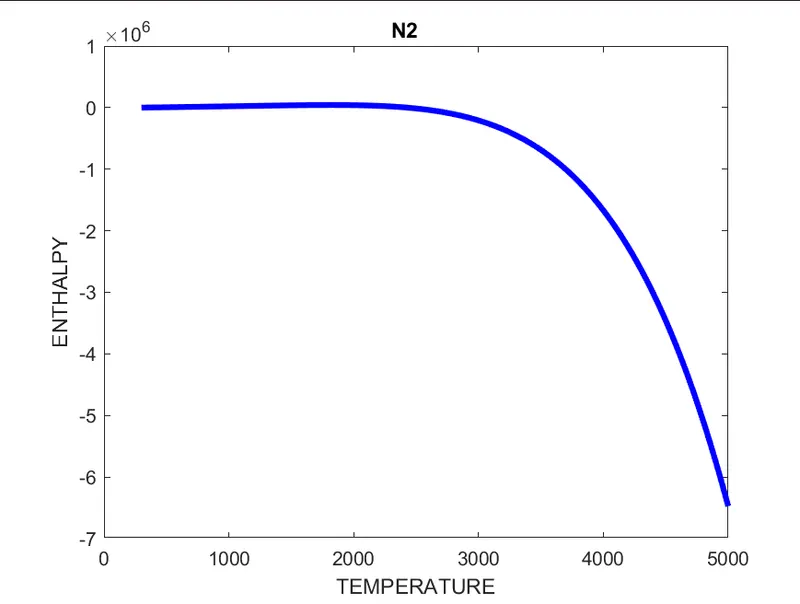
plot(T,h,'Color','b','LineWidth',3);
title(species_name);
xlabel('TEMPERATURE');
ylabel('ENTHALPY');

% plotting between temperature and entropy
figure(3);
hold on
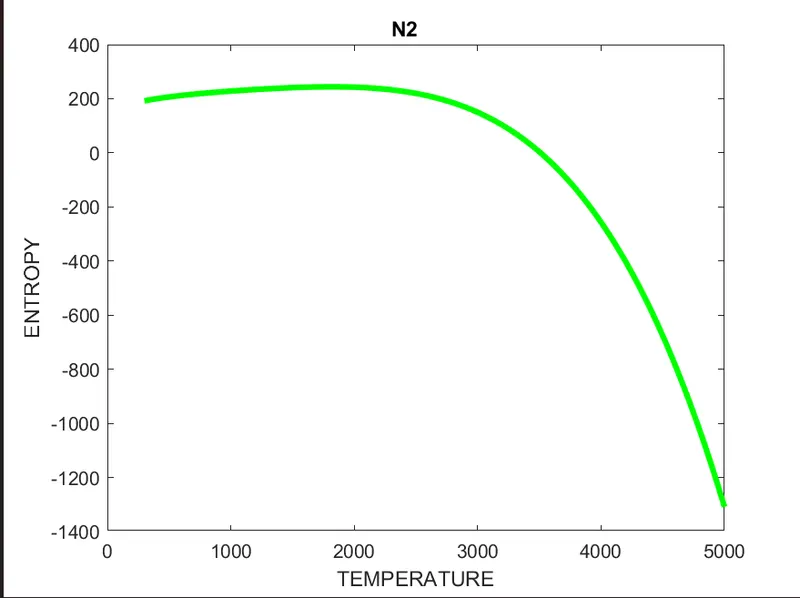
plot(T,s,'Color','g','LineWidth',3);
title(species_name);
xlabel('TEMPERATURE');
ylabel('ENTROPY');
directory = (['D:\SKILL-LYNC\challenges_matlab\ -PROJECT\SPECIES\',species_name]);
cd(directory);

% saving the plots
saveas(1,'specific_heat.png');
saveas(2,'enthalpy.png');
saveas(3,'entropy.png');
% changing the directory for calculating the molecular weight
cd('D:\SKILL-LYNC\challenges_matlab\');
% calling the function
[molecular_weight] = mole_weight(species_name)
end
fclose(f1)
CODE EXPLANATION:
- In this code the primary given data file should be opened through the fopen command and include 'r' inside the command as (data = fopen('THERMO.dat','r') so that the file is ready to read.
- Then the command fgetl is used to go to the next line in the given data file.
- After that the local temperature is assigned to a variable by going to that line using fgetl command and for storing them in the variable as a number. The string value is converted to a value by using str2double command.
- Then after that we are going to skip the unwanted lines and then the next comes is species line which is stored in a seperate variable and in this we should seperate the species in the first six places.
- . Now the next line onwards there consists a coefficients which are required in the polynomial equations to calculate the Specific heat(Cp), Enthalpy(E), Entropy(S) properties using the for loop which is written in the above code.
- So the temperature and coefficient values in the properties calculation formula will be extracted using the above for loop so that all property values will be obtained.
- After getting the values graphs should be plotted for each species between the temperatures and Cp, H, and S.
- Then the seperate directory should be created to save all the plots in that folder.
- At finally the molecular weight for each species should be calculated and should be displayed in the command window and the code for molecular weight is written above.
OUTPUTS:
The outputs of the above code can be seen in the workspace and the molecular weights of each species can be seen in the command window as shown in the below image.The molecular weights of some of the species which are printed in the command window were shown in the below image :
PLOTS:
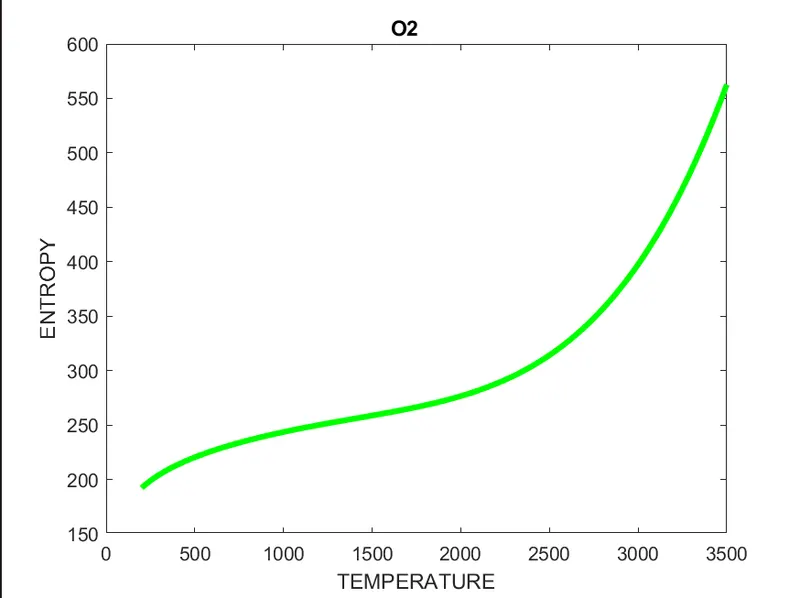
TEMPERATURE VS SPECIFIC HEAT FOR O2:
TEMPERATURE VS ENTHALPY:
TEMPERATURE VS ENTROPY:
TEMPERATURE VS SPECIFIC HEAT FOR N2:
TEMPERATURE VS ENTHALPY:
TEMPERATURE VS ENTROPY:
TEMPERATURE VS SPECIFIC HEAT FOR CO2:
TEMPERATURE VS ENTHALPY:
TEMPERATURE VS ENTROPY:
SCREENSHOTS OF SAVED DIRECTORIES :
ERRORS:
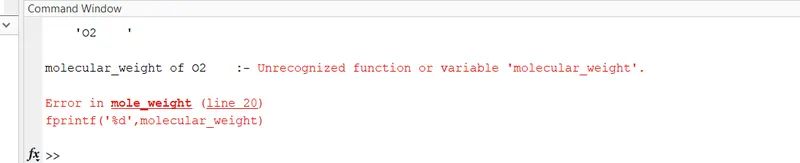
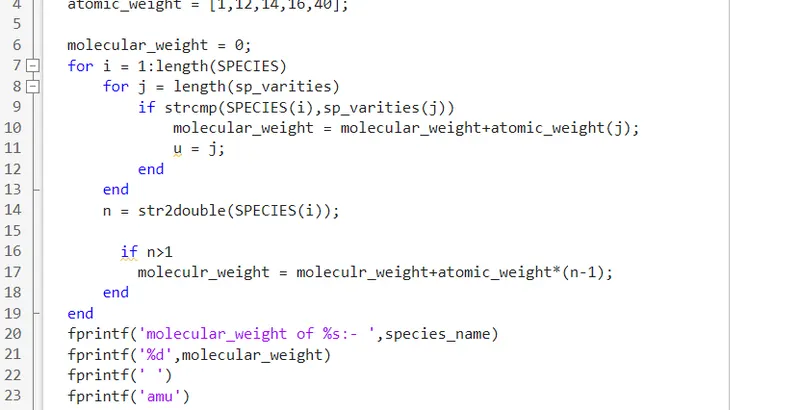
- Here instead of molecular i typed 'molculr'.After changing the splling the error got fixed\
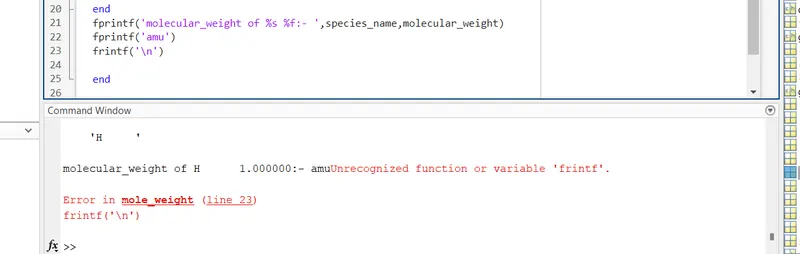
- Here instead of 'fprintf' i typed in as 'frintf'.After changing the error got fixed.
CONCLUSION:
- The parsing of thermodynamic data file by NASA is done using certain commands in MATLAB.
- Also, the plots of thermodynamic properties v/s temperature are saved in a separate folder created by writing a specific code.
- Moreover, a function has been coded to calculate the molecular weight of the species mentioned in the given data file.
- From the above program, it can be exerted that new folders with desired information can be created and the files can be easily saved for further use.
REFERENCES: