Assignment 5-RADIOSS Interfaces & Study of Effect of Notches Challenge
- Create the mesh for bumper assembly,mesh size should be 6mm.
- Run the crash tube model as it is.
- Change the Inacti=6 and run.
- Create the type 11 contact and run.
- Remove both notches and remove boundary condition on rigid body node then run.
- Create a new notch in the middle ,select the whole section and run.
- Create a new notch with nodes only from opposing 2 faces and run.
Note:
- Plot RWALL forces ,contact forces,internal energy and Create TH/PART for all parts and compare results for all cases.
- Comment your thought on why there is a change in the internal energies.
- How does the notch affect the results?
- Plot energies and note any difference.
Module 1:
objective
Create the mesh for bumper assembly,mesh size should be 6mm.
import the the .hm file from the drive
procedure to import
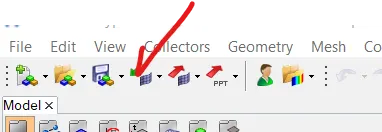
click on import>select option 'import model'>select .hm file bumber model>click on import
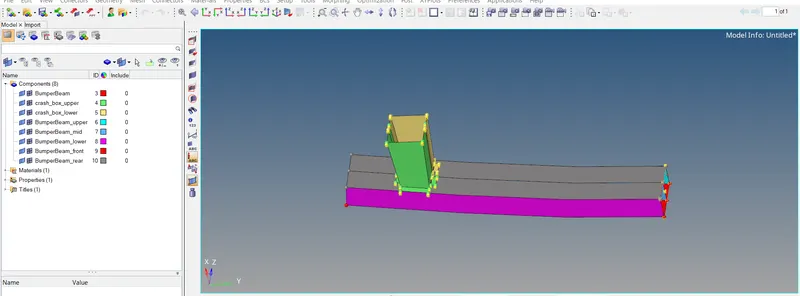
we have succesfully import the model into the hypermesh GUI
now we need to check free edges and defected surfaces.first of all we are going to set the model in topo mode
from the tool bar click on the drop down arrow and set to by topo

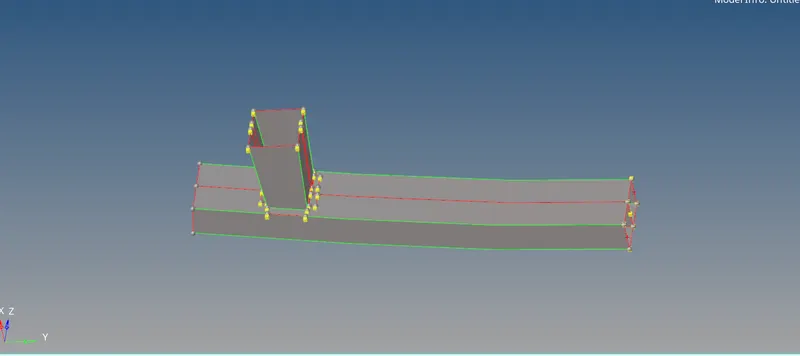
there are some nodes that needs to be clear from the model so that our mesh flow will be good
to clear the nodes, press shift+f2 and select the nodes and click on clear
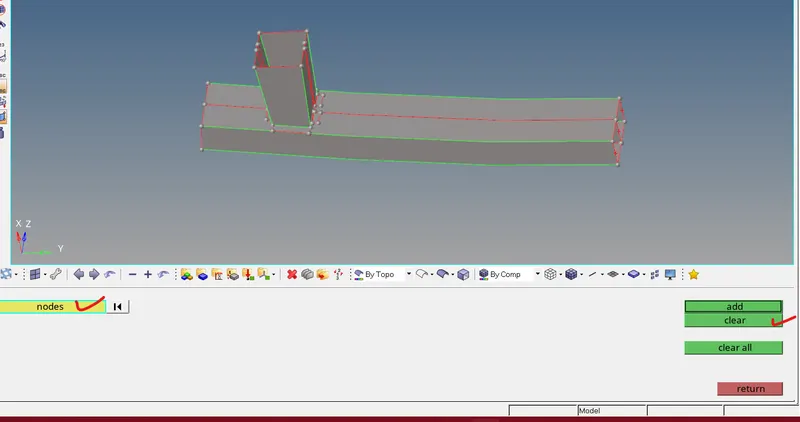
now the nodes has been cleared from the geometry
the below surfaces needs to be clear we have different tools to fix them
we are going to use two methods
1: trim surface with plane
2: toggle
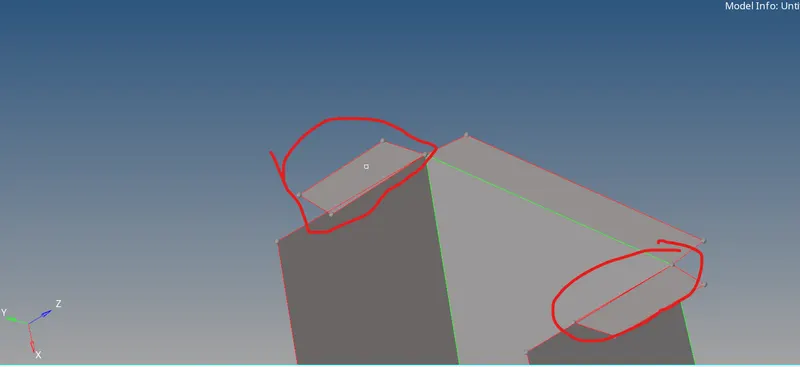
1: trim surface with plan
press shift +f9
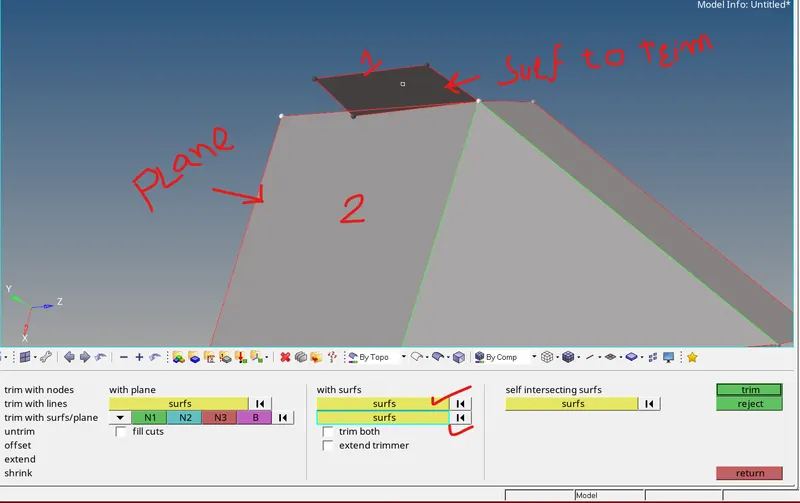
now the surface got trimed now we can delet the small portion of the trimed surface
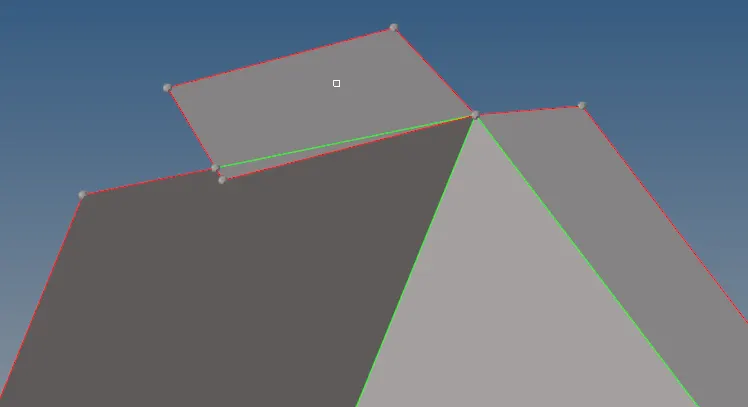
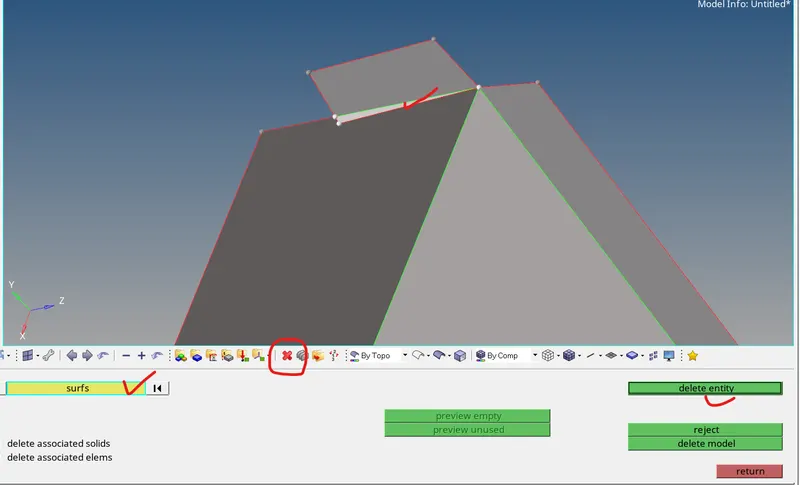
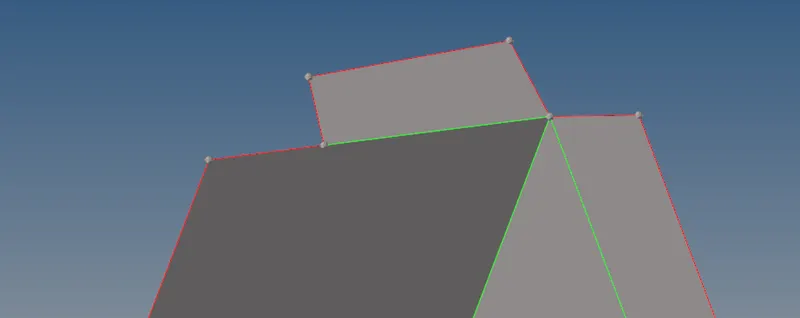
toggle option
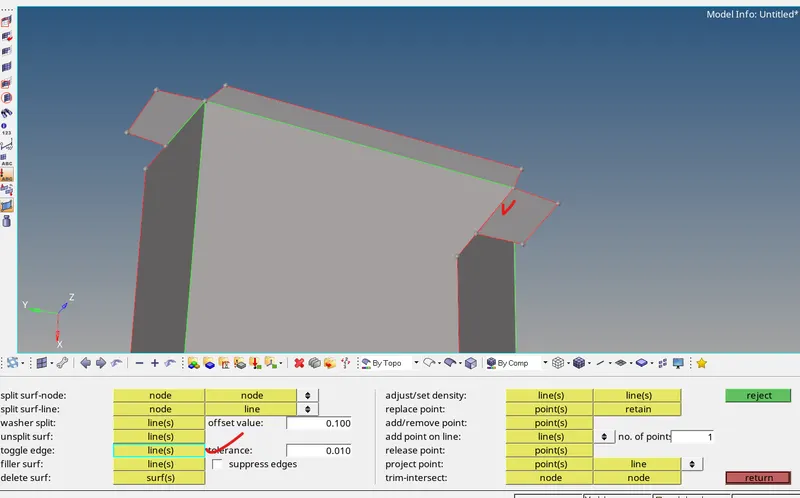
now both the surface got fix
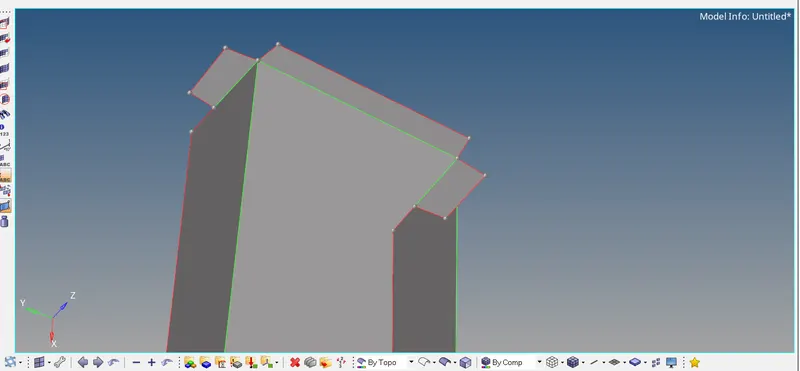
simillary we can apply the same method to other surface as well
Meshing
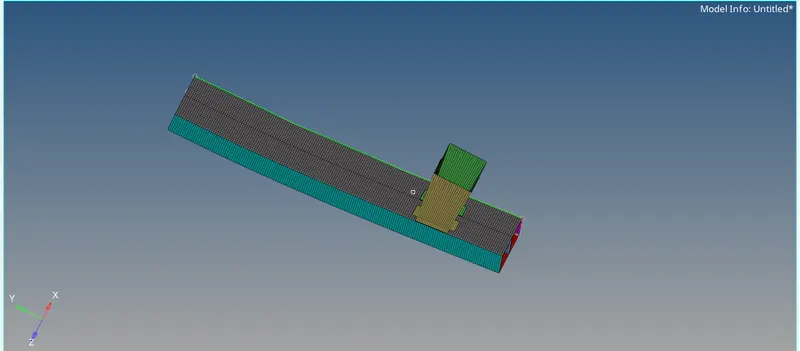
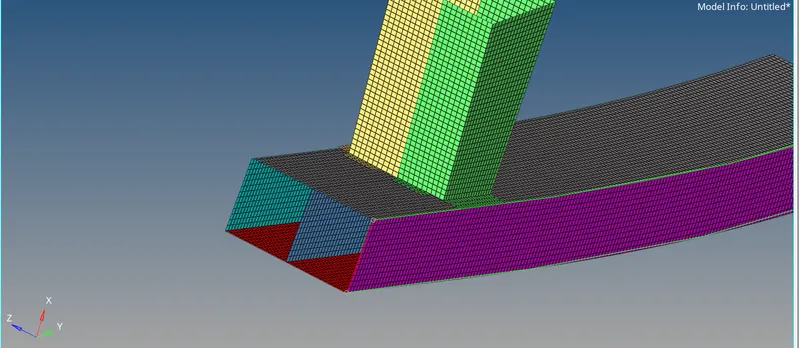
the geometry clean up has been done now we have to do meshing operation taking element size =5mm
click on f12 for automesh >set element size=6mm>set element type mixed and click on mesh
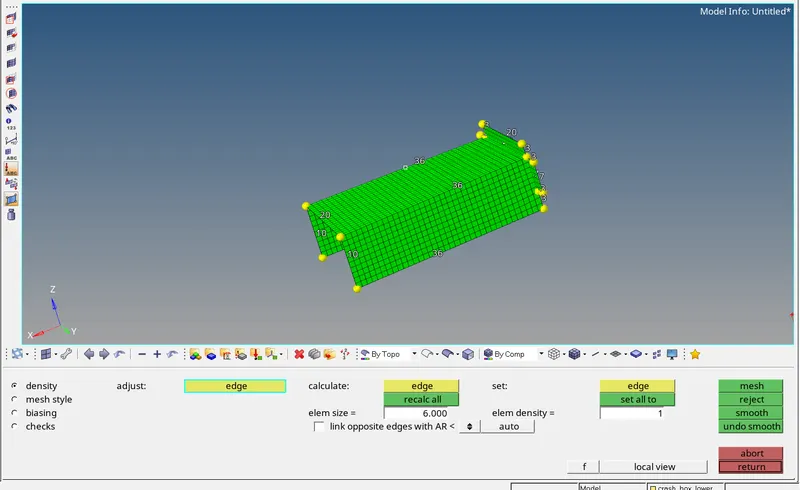
similar way meshing will be sone to all the components one by one with the same element size
Module 2
Run the crash tube model on default parameters
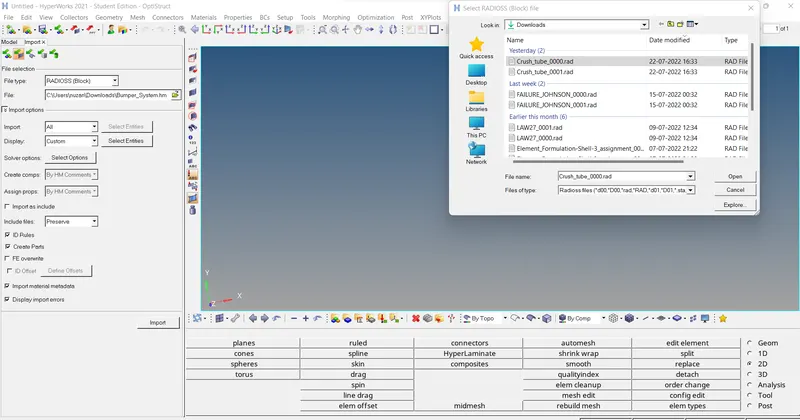
import the solver deck file into the hypermesh the stater file is named as crash_tube_0000.rad we need to import this
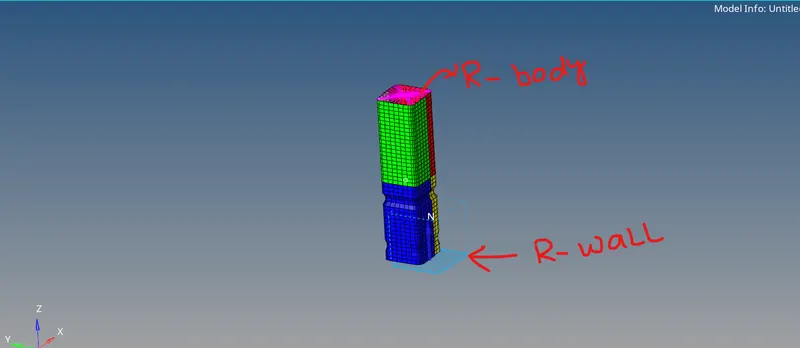
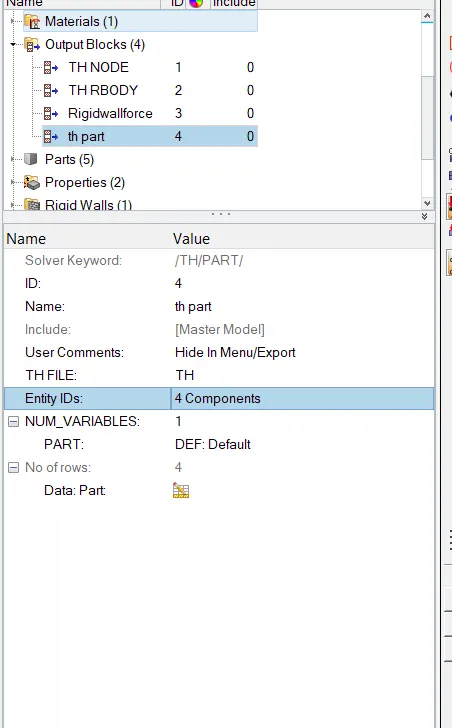
once we import the crash tube we need to create the TH PART
From the model browser we need to click on output block >right click on it to create the TH part thus the TH part will be created ,now we need to click on it
from the entity IDs select the component instead of nodes and select all the 4 components as shown below
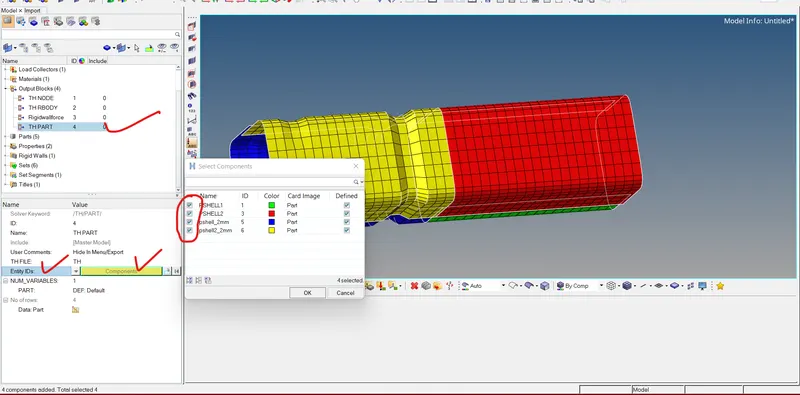
we have to run the model on defaulted parameters
defaulted material card
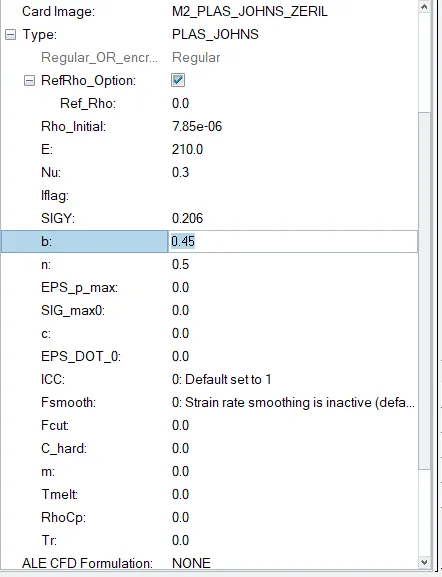
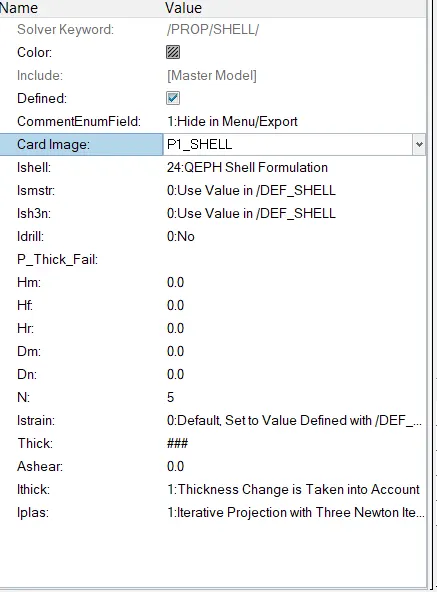
DEFAULTED PROPERTIES
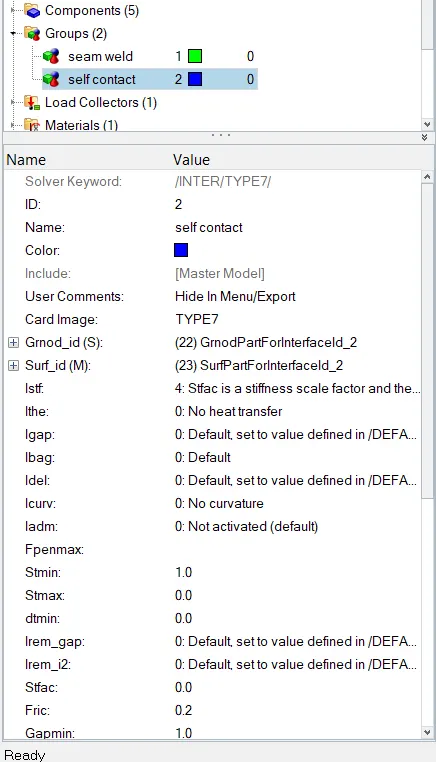
INTERFACE PARAMETERS (DEFAULTED)
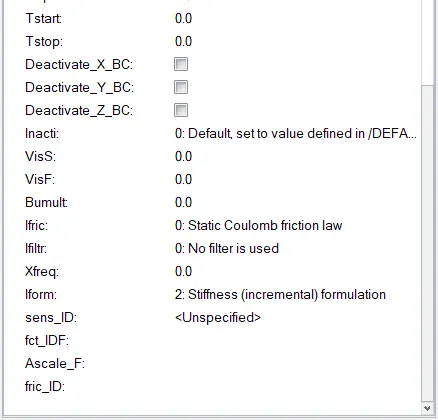
now we are going to run the model on defaulted parameters and will see the results
procedure to run the analysis
click on analysis from the pannel click on radioss set -nt 4 (for 4 core processor) save the model in different directory and click on radioss to run the analysis
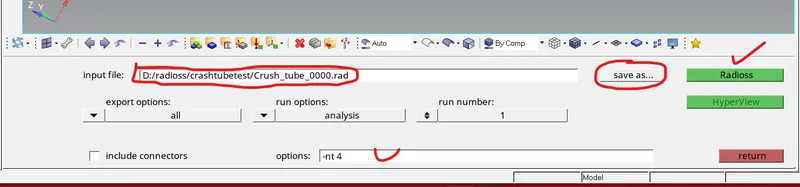
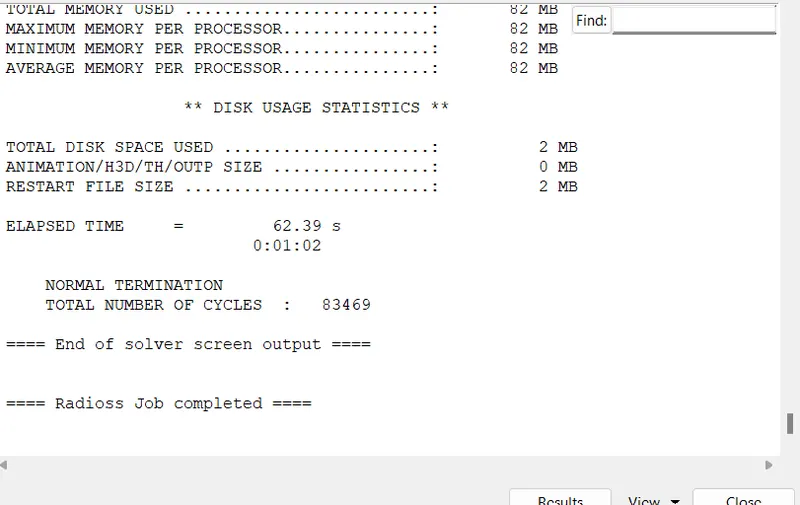
once you hit the radioss a consol window will open and the operation /calculation goes start and it will take few seconds to complete the job
in order to see whether our analysis is acceptable or not we need to open crash_tube_0001.out file in notepad to check the energy and mass errors, the acceptable range for energy error is -15% to+5% and for mass error the range is 0-2%
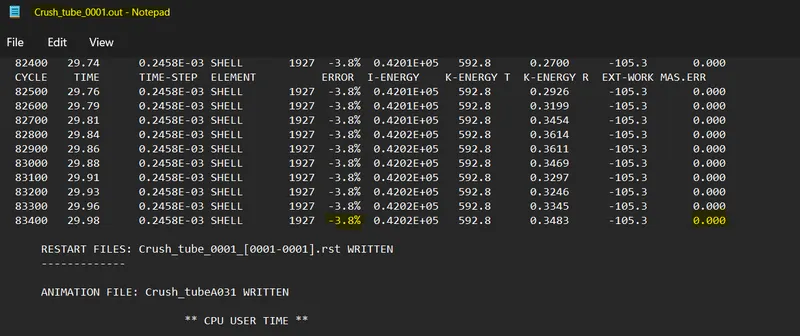
from the above snap the energy error and mass error are within acceptable range we are good to go for checking the results in hyperview
procedure to check the results in hyperview
click on client selector >select hyperview this will take us to the hyperview window ,once the hyperview window will open we need to input the h3d file that has been generated by the radioss and the location of this file will be in the d drive

once you input the file click on apply
now to check the results we need to click on result type ,we want to see the displacement and von mises stress ,in result type select displacement and click on contour
MAX Displacement 2.800E+02
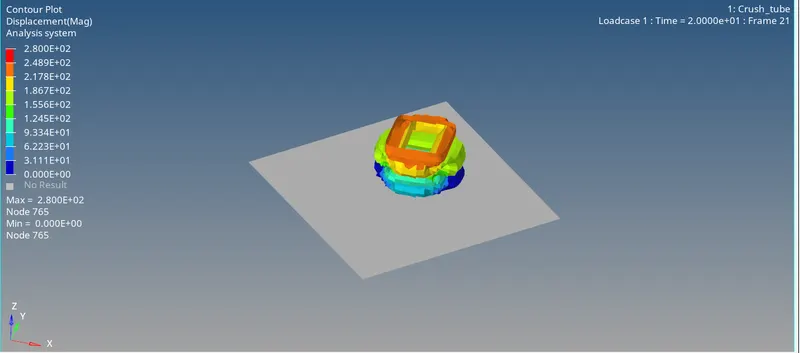
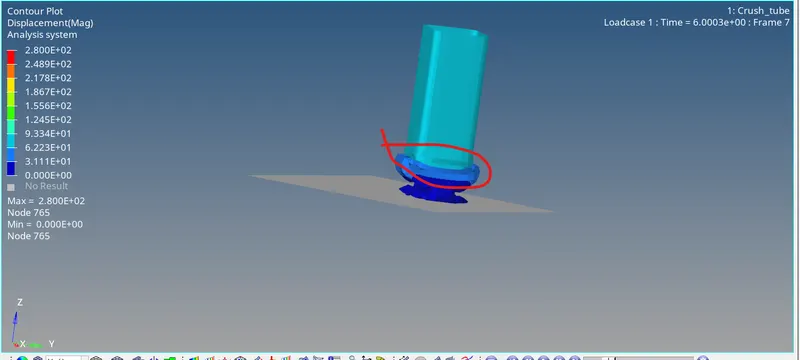
the deformation of the component takes place from the notch as shown below , the area just below the notch gets completely crushed first and their will be small rise in rigid wall forces(reaction forces) at that time ,once the area below the notch gets crushed the deformation will take place to the upper portion of the crush tube (area just above the notch) the maximum displacement occurs in the component is, with the increase in displacement the internal energy also increases and it is maximum at the end of the simulation because the component gets fully crushed ,max displacement occours= 2.800E+02
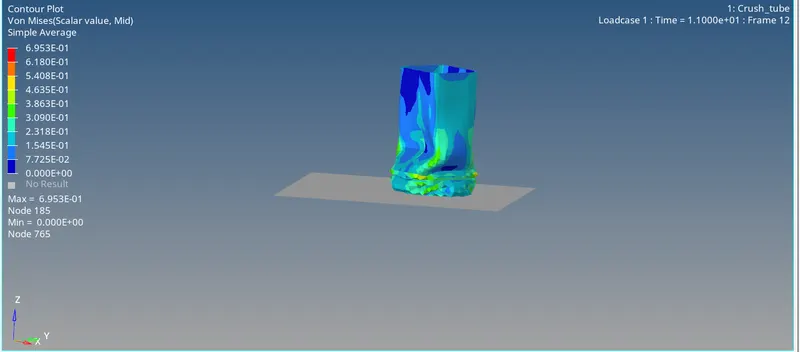
VON MISES STRESS
MAX Stress=6.953E-01
the maximum stress occurs in the component was recorded to 6.953E-01
hypergraph 2D
in order to view the results in hypergraph 2d we need to select the hypergraph 2d from the client selector ,once the hypergraph window will open we need to input the data file (T01 FILE ) as shown below
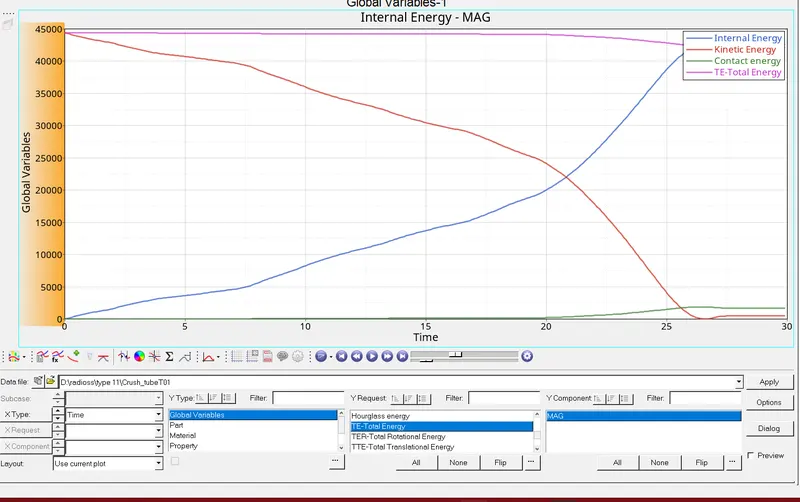
inorder to view the results we need to click on global variables in Y-TYPE section and in Y-REQUEST we need to select the variables internal, kinetic energy and contact energy and in Y component we need to select the magnitude and click on apply

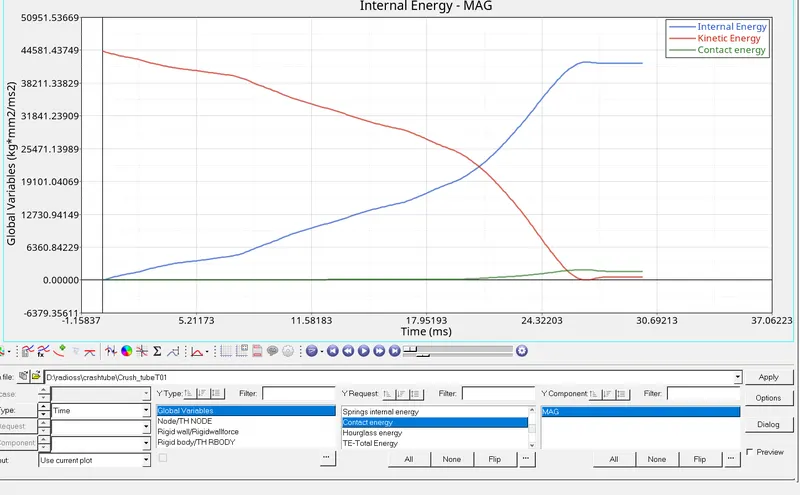
the internal, kinetic and contact energy has been ploted below
Internal Energy
at the begning of the simuation the internal energy is 0 shows that the component is not under any kind of deformation ,once the rigid body is going to apply some load on the crush tube the internal energy is going to start increasing annd is maximum at 25ms and after that a steady state region is taking place.the steady state indicates that the component has crushed fully and after that no deformation is going to take place thats why their is constant line after 25ms in the internal energy .
kinetic energy
AT begning the load is being applied to the crush tube and is high at the start of the simulation because there is no deformation in the component at the intial stage once the deformation is taking place the kinetic energy is going to start decreasing and it is minimum at the ened of the simulation where the deformation is higher as shown in the snap below.
CONTACT ENERGY
Contact energy is coming due to penetrations in the model. So the solver applies a force to remove penetration and this work done results into contact energy.from the results of the contact energy below it is very clear that the contact energy remains constant upto 20th milli sec indicates there is no penetration in the model upto 2oth milli sec and after that penetration occurs in the model to remove the penetration from the model some resistive forces should be applied on the penetration area and solver need to work on that portion and solver need some energy to do that work in order to remove the penetration.
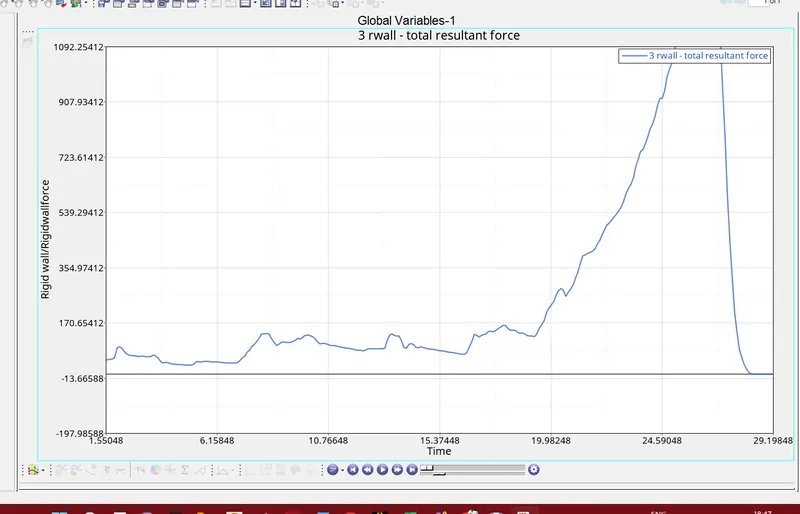
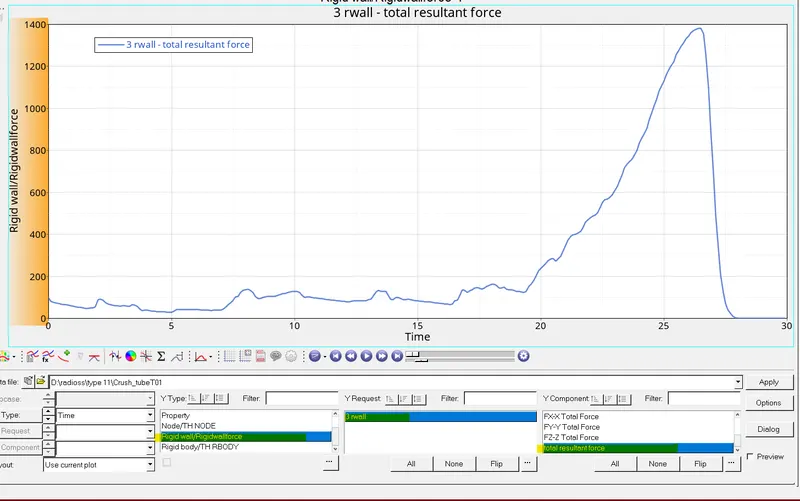
Rigid Wall Forces:
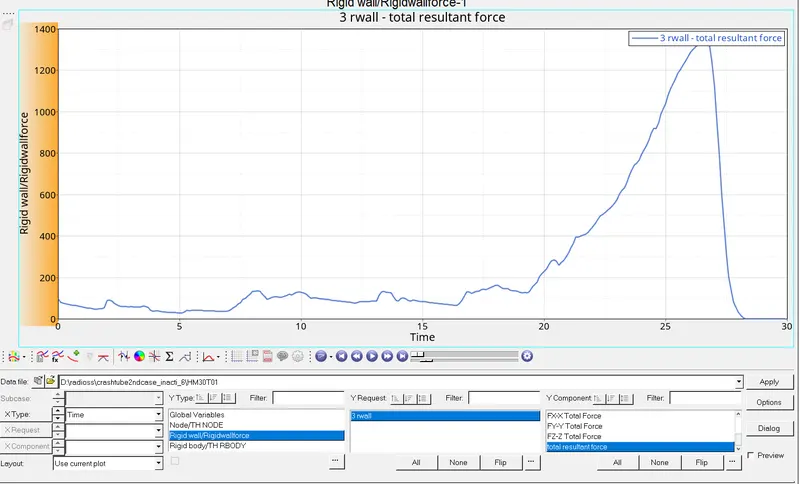
at the start of the simulation there is no rigid wall forces acting on the component because no load is applied to the component intially this can be seen in the graph below ,but after 2milli sec there are some small peaks in the rigid wall force indicates that deformation is taking place in the component and some resistive force is being appid by the rigid wall to the component, the maximum peak in the rigid wall is taking place at 26 mili sec indicates that the component has been crushed fully and lot of resistive force has been devloped upto the full deformation and the component in not going for further crush and hence the rigid wall force comes to 0
Case 2
Change the Inacti=6 and run
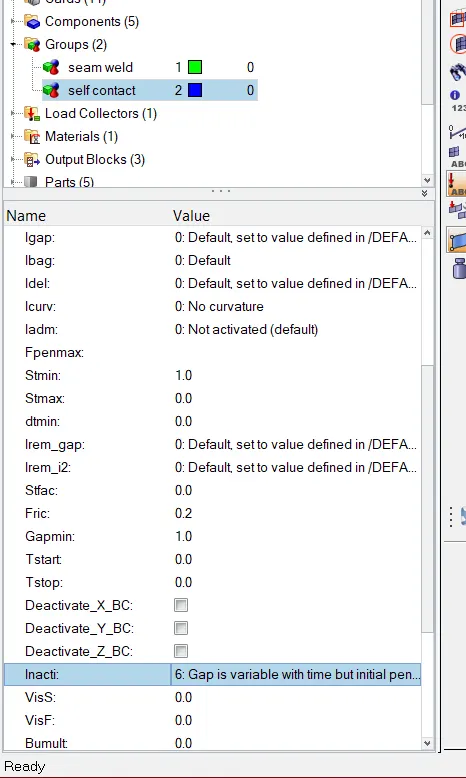
inacti=6 it removes intial penetration where possible
inacti=6 option is going to take care of the initial penetrations during the run. It is always advisable to remove the penetrations in the model as it may lead to high energy error and finally run termination.
to change the inacti click on groups in the model browser >click on the self contact and change the inacti to 6
in this case we dont need to change all other parameters
procedure to run the analysis
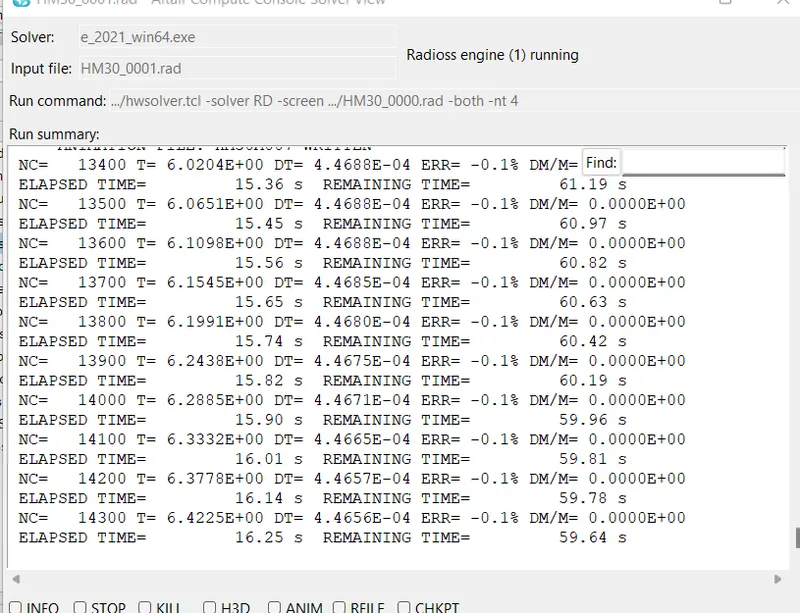
click on analysis from the pannel click on radioss set -nt 4 (for 4 core processor) save the model in different directory and click on radioss to run the analysis
once you hit the radioss a consol window will open and the operation /calculation goes start and it will take few seconds to complete the job
Energy and mass error check
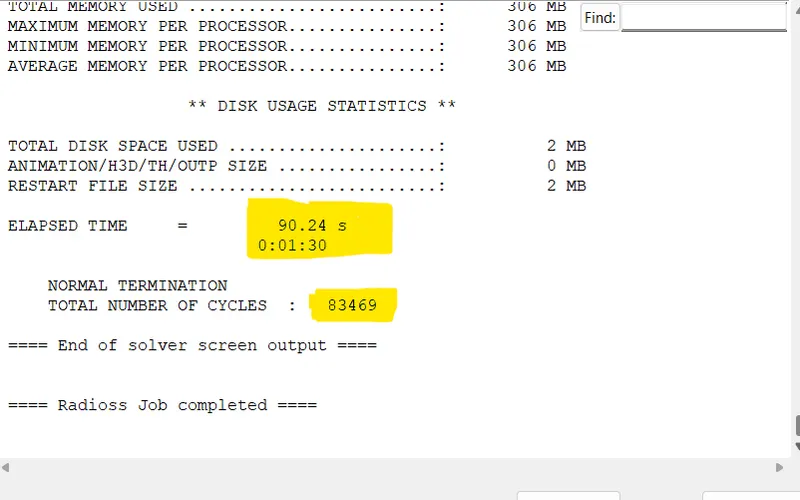
in order to see whether our analysis is acceptable or not we need to open crash_tube_0001.out file in notepad to check the energy and mass errors, the acceptable range for energy error is -15% to+5% and for mass error the range is 0-2%
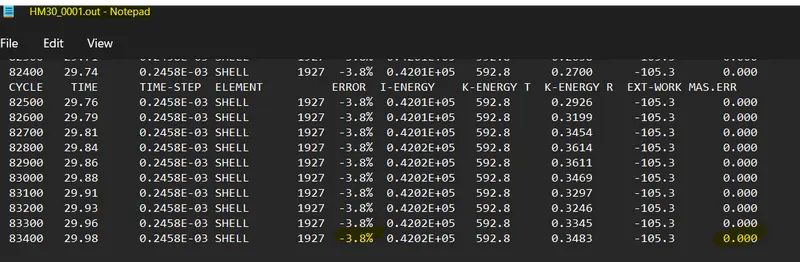
from the above snap the energy error and mass error are within acceptable range we are good to go for checking the results in hyperview
procedure to check the results in hyperview
click on client selector >select hyperview this will take us to the hyperview window ,once the hyperview window will open we need to input the h3d file that has been generated by the radioss and the location of this file will be in the d drive
results from Hyperview
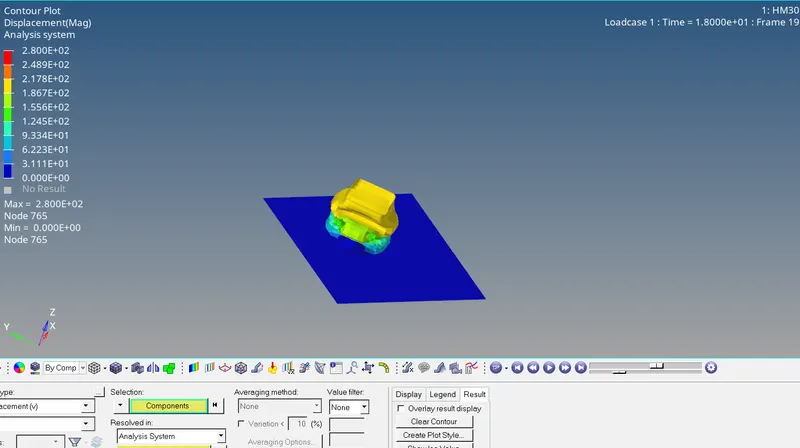
MAX Displacement 2.800E+02
the deformation of the component takes place from the notch as shown below , the area just below the notch gets completely crushed first and their will be small rise in rigid wall forces(reaction forces) at that time ,once the area below the notch gets crushed the deformation will take place to the upper portion of the crush tube (area just above the notch) the maximum displacement occurs in the component is, with the increase in displacement the internal energy also increases and it is maximum at the end of the simulation because the component gets fully crushed ,max displacement occours= 2.800E+02
VON MISES STRESS
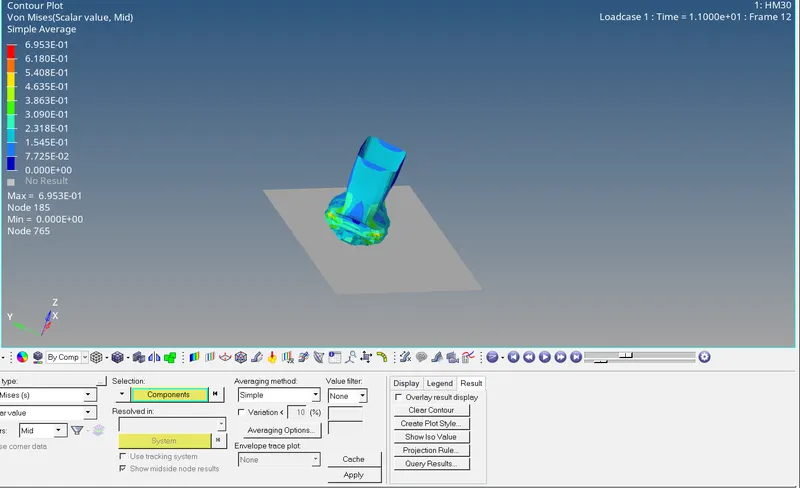
MAX Stress=6.953E-01
the maximum stress occurs in the component was recorded to 6.953E-01
hypergraph 2D
in order to view the results in hypergraph 2d we need to select the hypergraph 2d from the client selector ,once the hypergraph window will open we need to input the data file (T01 FILE ) as shown below
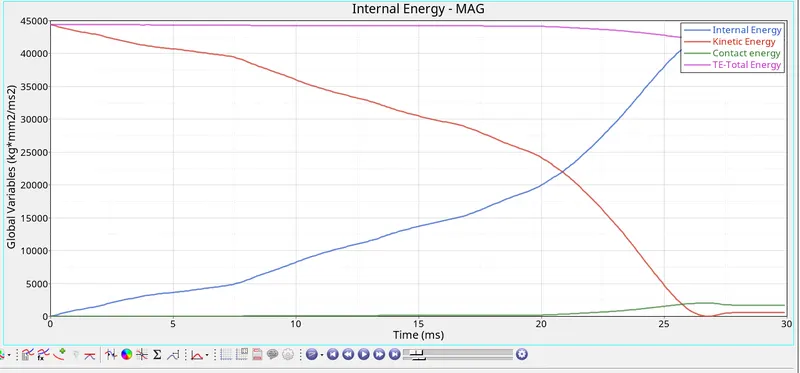
inorder to view the results we need to click on global variables in Y-TYPE section and in Y-REQUEST we need to select the variables internal, kinetic energy and contact energy and in Y component we need to select the magnitude and click on apply
the internal, kinetic and contact energy has been ploted below
Internal Energy
at the begning of the simuation the internal energy is 0 shows that the component is not under any kind of deformation ,once the rigid body is going to apply some load on the crush tube the internal energy is going to start increasing annd is maximum at 25ms and after that a steady state region is taking place.the steady state indicates that the component has crushed fully and after that no deformation is going to take place thats why their is constant line after 25ms in the internal energy .
kinetic energy
AT begning the load is being applied to the crush tube and is high at the start of the simulation because there is no deformation in the component at the intial stage once the deformation is taking place the kinetic energy is going to start decreasing and it is minimum at the ened of the simulation where the deformation is higher as shown in the snap below.
CONTACT ENERGY
Contact energy is coming due to penetrations in the model. So the solver applies a force to remove penetration and this work done results into contact energy.from the results of the contact energy below it is very clear that the contact energy remains constant upto 20th milli sec indicates there is no penetration in the model upto 2oth milli sec and after that penetration occurs in the model to remove the penetration from the model some resistive forces should be applied on the penetration area and solver need to work on that portion and solver need some energy to do that work in order to remove the penetration.
Rigid Wall Forces:
at the start of the simulation there is no rigid wall forces acting on the component because no load is applied to the component intially this can be seen in the graph below ,but after 2milli sec there are some small peaks in the rigid wall force indicates that deformation is taking place in the component and some resistive force is being appid by the rigid wall to the component, the maximum peak in the rigid wall is taking place at 26 mili sec indicates that the component has been crushed fully and lot of resistive force has been devloped upto the full deformation and the component in not going for further crush and hence the rigid wall force comes to 0
case 3
Create the type 11 contact and run.
import the solver deck file into the hypermesh the stater file is named as crash_tube_0000.rad we need to import this
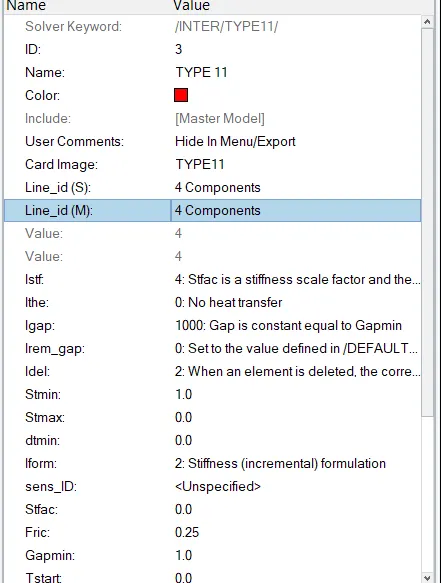
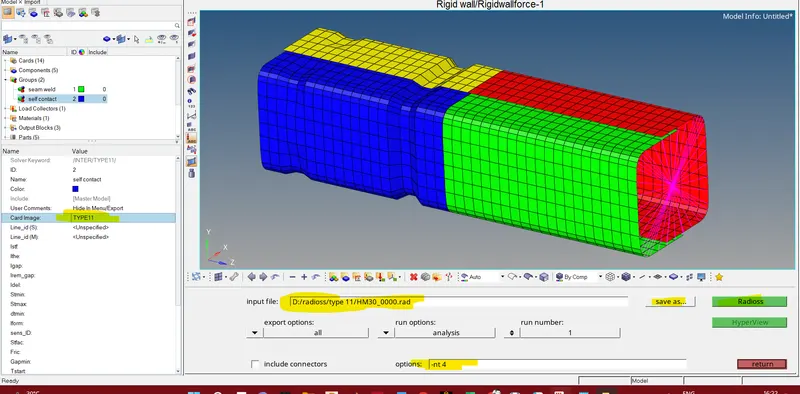
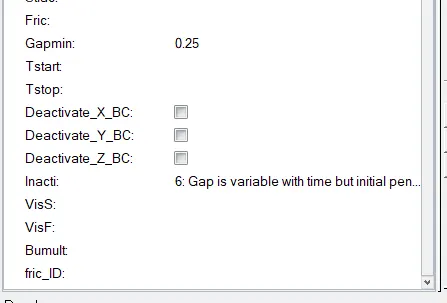
in this case we need to create contact type 11 and all other parameters will be same as type 7
Type 11 interfaces are used to simulate impact between lines for 1D mesh, or edges in shell and solid meshes. When two surfaces contact, a stiffness is introduced to reduce the penetration's nodes of the other surface into the surface. The nature of the stiffness depends on the type of interface and the elements involved. The introduction of this stiffness may have consequences on the time step, depending on the interface type used.
create TH PART
procedure to run the analysis
click on analysis from the pannel click on radioss set -nt 4 (for 4 core processor) save the model in different directory and click on radioss to run the analysis
once you hit the radioss a consol window will open and the operation /calculation goes start and it will take few seconds to complete the job
CHECK ENERGY AND MASS ERRORS
in order to see whether our analysis is acceptable or not we need to open crash_tube_0001.out file in notepad to check the energy and mass errors, the acceptable range for energy error is -15% to+5% and for mass error the range is 0-2%
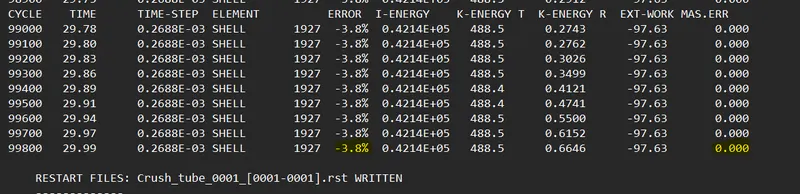
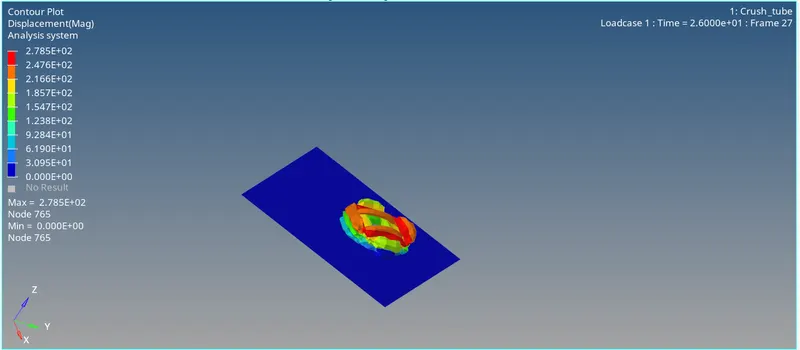
Maximum displacement =2.78E+02
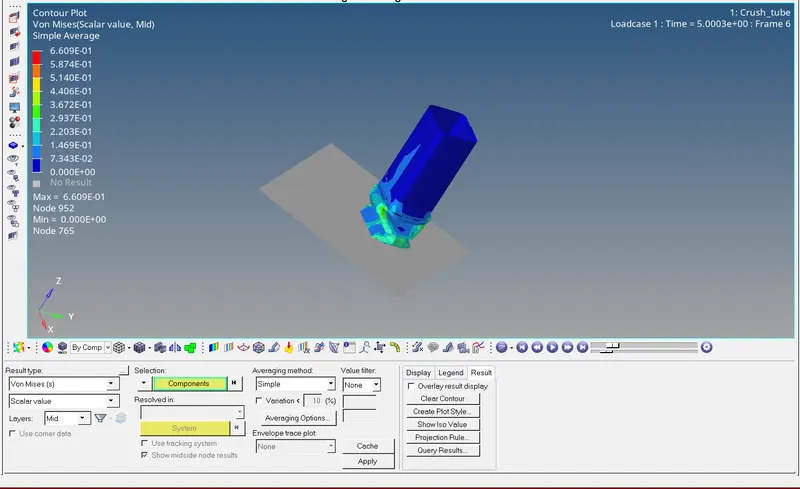
maximum stress rteached in the component 6.609E-01
hypergraph 2D
in order to view the results in hypergraph 2d we need to select the hypergraph 2d from the client selector ,once the hypergraph window will open we need to input the data file (T01 FILE ) as shown below
inorder to view the results we need to click on global variables in Y-TYPE section and in Y-REQUEST we need to select the variables internal, kinetic energy and contact energy and in Y component we need to select the magnitude and click on apply
the internal, kinetic and contact energy has been ploted below
Internal Energy
at the begning of the simuation the internal energy is 0 shows that the component is not under any kind of deformation ,once the rigid body is going to apply some load on the crush tube the internal energy is going to start increasing annd is maximum at 25ms and after that a steady state region is taking place.the steady state indicates that the component has crushed fully and after that no deformation is going to take place thats why their is constant line after 25ms in the internal energy .
kinetic energy
AT begning the load is being applied to the crush tube and is high at the start of the simulation because there is no deformation in the component at the intial stage once the deformation is taking place the kinetic energy is going to start decreasing and it is minimum at the ened of the simulation where the deformation is higher as shown in the snap below.
CONTACT ENERGY
Contact energy is coming due to penetrations in the model. So the solver applies a force to remove penetration and this work done results into contact energy.from the results of the contact energy below it is very clear that the contact energy remains constant upto 20th milli sec indicates there is no penetration in the model upto 2oth milli sec and after that penetration occurs in the model to remove the penetration from the model some resistive forces should be applied on the penetration area and solver need to work on that portion and solver need some energy to do that work in order to remove the penetration.
Rigid Wall Forces:
at the start of the simulation there is no rigid wall forces acting on the component because no load is applied to the component intially this can be seen in the graph below ,but after 2milli sec there are some small peaks in the rigid wall force indicates that deformation is taking place in the component and some resistive force is being appid by the rigid wall to the component, the maximum peak in the rigid wall is taking place at 26 mili sec indicates that the component has been crushed fully and lot of resistive force has been devloped upto the full deformation and the component in not going for further crush and hence the rigid wall force comes to 0
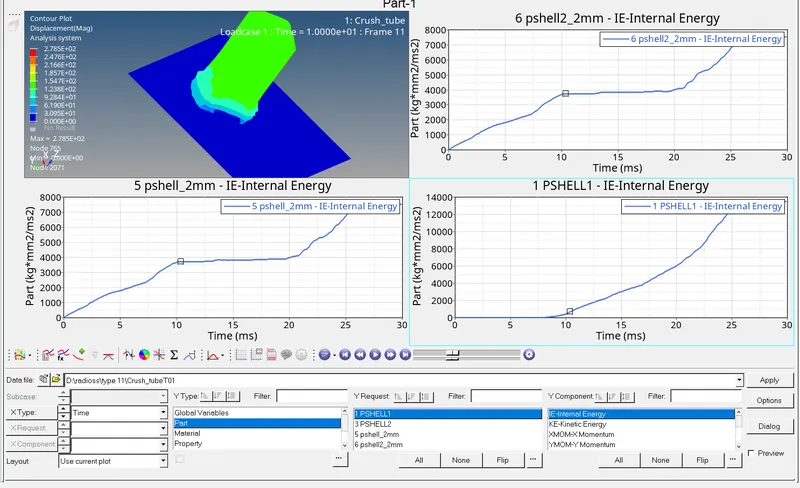
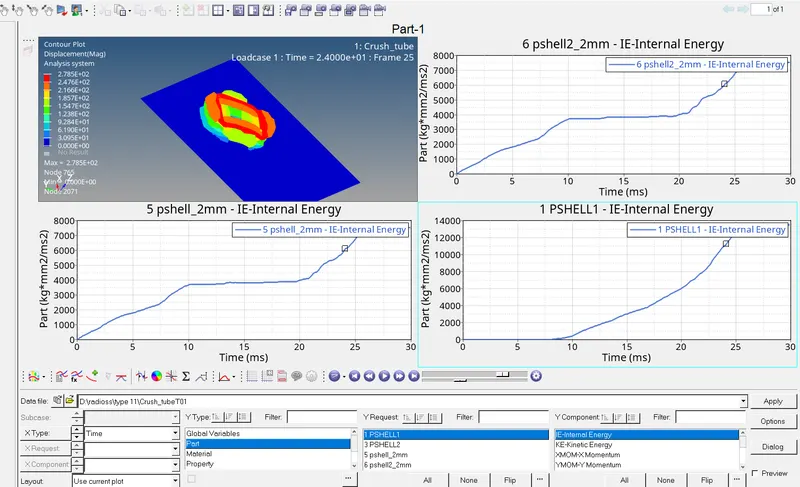
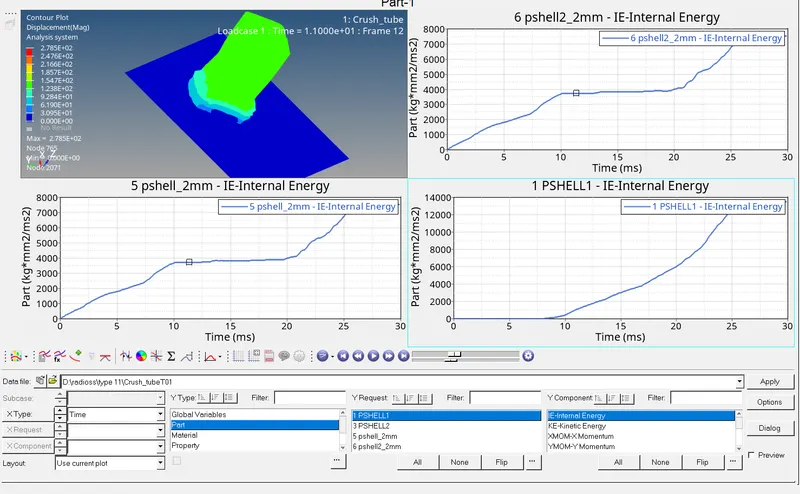
INTERNAL ENERGY of all the 4 components
For the component having thickness of 2mm these two parts are in interface with the rigid wall.in both the parts the internal energy increases from the start of simulation upto 10 mili seconds indicates that the diformation is going to produce in these components the deformation of both these components starts from the notch upto the end of the component ,the component below the notch gets fully crushed in 10 mili sec once it is fully crushed there is no deformation afterward thats why the internal energy of both these components remains constant from 10th mili sec to 20th mili sec.From 10th mili sec the deformation takes place in 3mm components which are above the notch hence the internal energy increases further upto the full cruch of the component
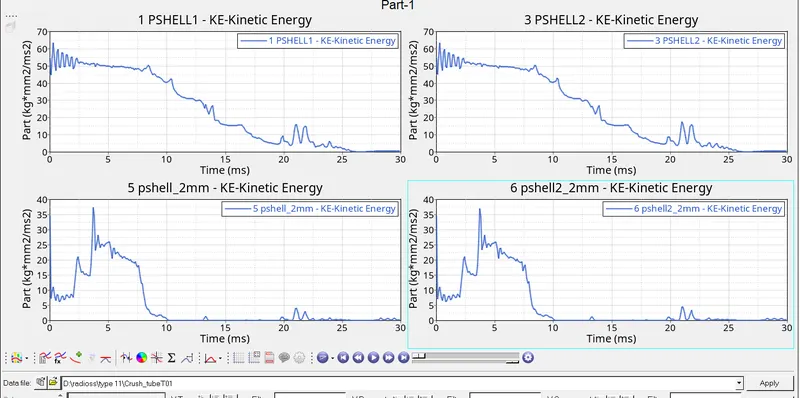
Kinetic Energy plot for 2mm and 3mm shell components
the kinetinec energy needed for both 2mm components is less because they are not too stiff that require high kinetic energy for deformation intiall if we see in the plot below there is sudden drop in the K.E for both the components because the notch portion is in consideration at that time that do not need lot of kinetic energy once the notch is curshed the deformation is going to take place in the plane surface that need more energy for deformation .we can clearly see after 3 ms there is increase in KE THis is due to the plane surface below notch portion.
KE for 3mm starts from 55 since the component thickness is 3mm therefore it is stiff than 2mm that why it need more energy than 2mm
Case 4
Remove both notches and remove boundary condition on rigid body node then run
in this case we need to remove both the notches
procedure to remove notches
click on geometry >select node edit>select node align>now select the 2 refrence nodes from plane surface and select the 3rd node from notch/bend portion which you want to align
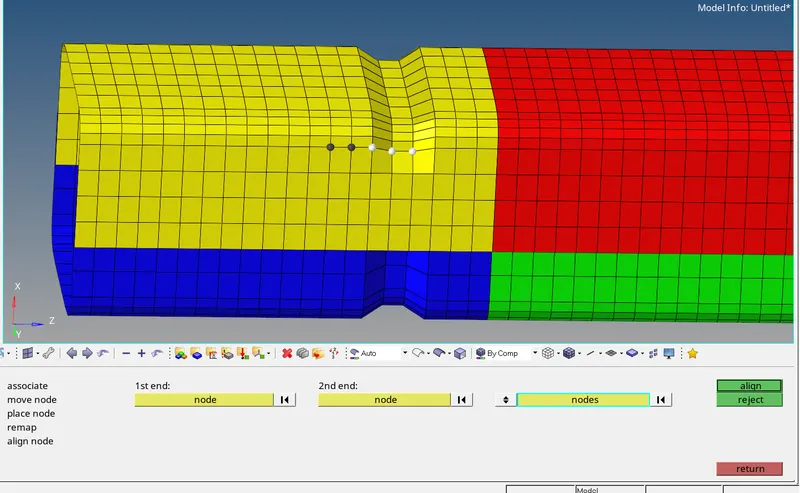
now we have aligned all the nodes and the surface is plane
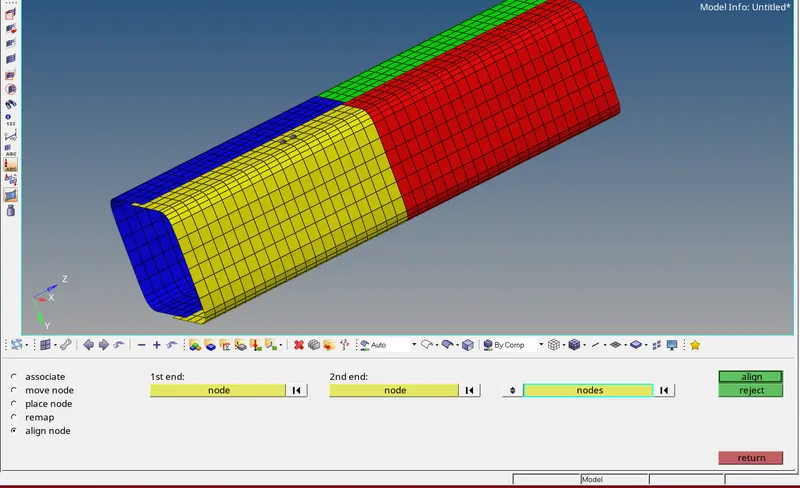
we are going to run the simulation for this case and will analyse the results in hypergraph and hyperview
procedure to run the analysis
click on analysis from the pannel click on radioss set -nt 4 (for 4 core processor) save the model in different directory and click on radioss to run the analysis
once you hit the radioss a consol window will open and the operation /calculation goes start and it will take few seconds to complete the job
CHECK ENERGY AND MASS ERRORS
in order to see whether our analysis is acceptable or not we need to open crash_tube_0001.out file in notepad to check the energy and mass errors, the acceptable range for energy error is -15% to+5% and for mass error the range is 0-2%
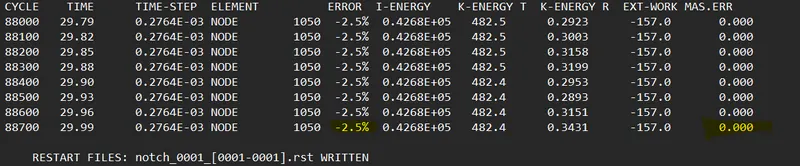
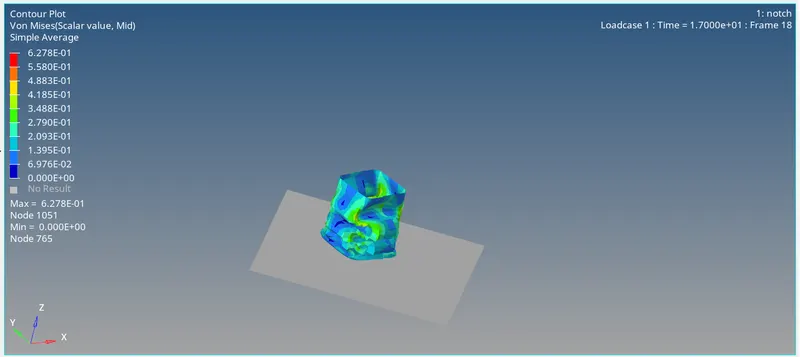
maximum stress reached=6.27E-01
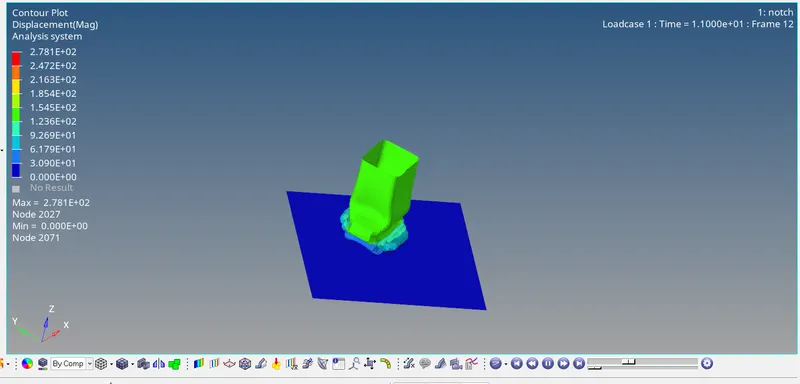
maximum displacement=2.781E+02
hypergraph 2D
in order to view the results in hypergraph 2d we need to select the hypergraph 2d from the client selector ,once the hypergraph window will open we need to input the data file (T01 FILE ) as shown below
internal energy
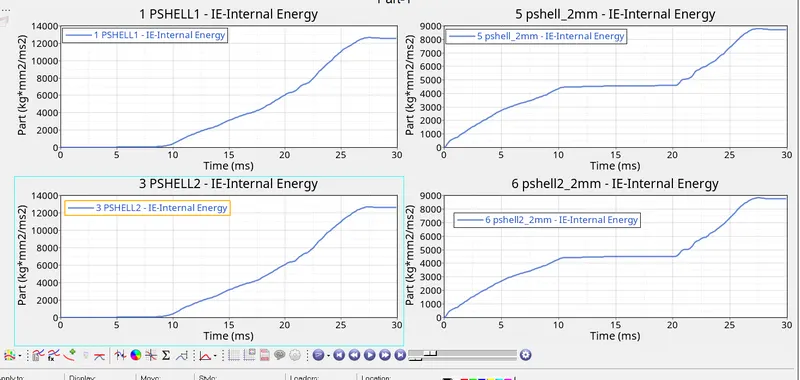
For the component having thickness of 2mm these two parts are in interface with the rigid wall.in both the parts the internal energy increases from the start of simulation upto 10 mili seconds indicates that the deformation take place in these components the deformation of both these components starts from bottom of the component 2mm upto the end of the component (where 3mm component starts) ,the component 2mm gets fully crushed in 10 mili sec once it is fully crushed there is no deformation afterward thats why the internal energy of both these components remains constant from 10th mili sec to 20th mili sec.From 10th mili sec the deformation takes place in 3mm components the surface is plane and the stiffness of this component is more than 2mm hence the internal energy increases further upto the full cruch of the component
in this case the component 2mm stores internal energy=0.85kj
and component 3mm stores =1.3kj
kinetic energy
the kinetic energy in 2mm component starts from 35 units and there is sudden drop in the kinetic energy the drop indicates that the deformation occurs in the component and it didnot require much energy to deform the component the component 2mm gets fully crushed in 10ms and the KE tends to zeo indicates that the component has deformed fully
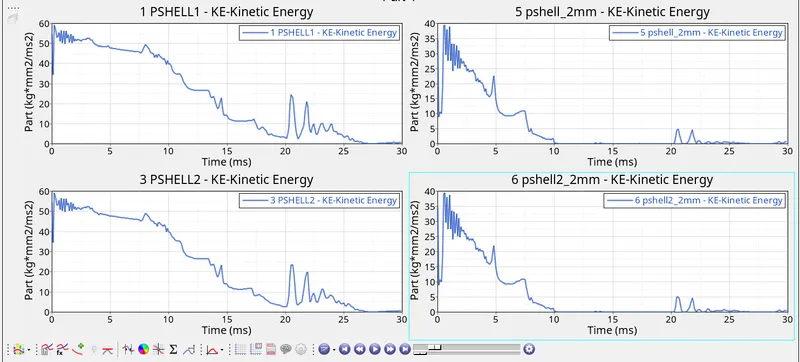
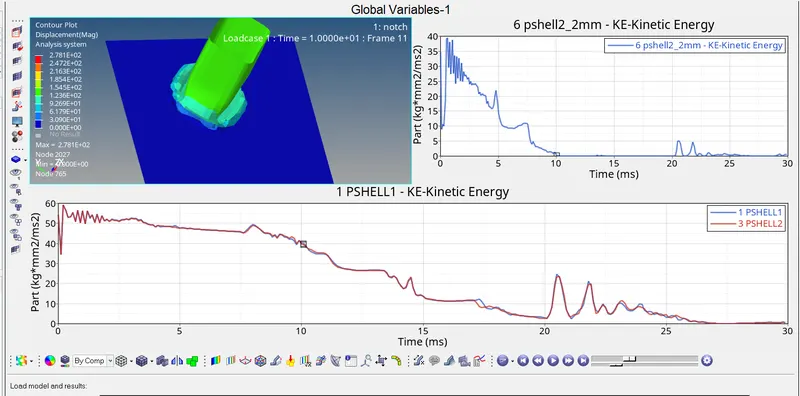
from the above snap is it clearly seen at 1oth mili sec the component having thickness 2mm gets full crushed
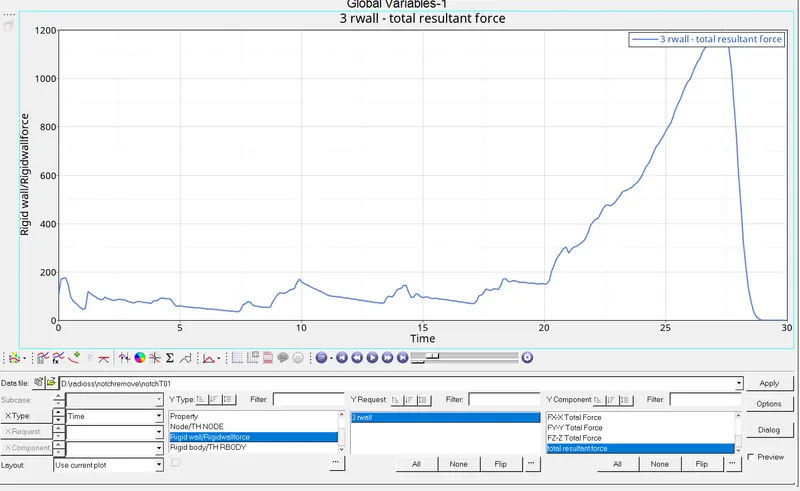
RIGID WALL FORCES
at the start of the simulation there is no rigid wall forces acting on the component because no load is applied to the component intially this can be seen in the graph below ,but after 2milli sec there are some small peaks in the rigid wall force indicates that deformation is taking place in the component and some resistive force is being appid by the rigid wall to the component, the maximum peak in the rigid wall is taking place at 26 mili sec indicates that the component has been crushed fully and lot of resistive force has been devloped upto the full deformation and the component in not going for further crush and hence the rigid wall force comes to 0
contact energy to the above 3 cases
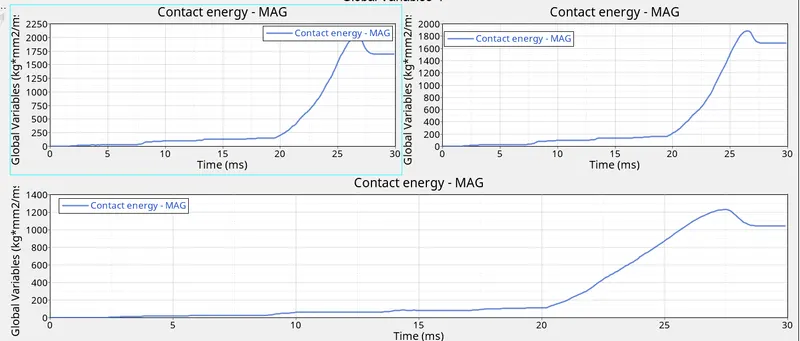
plot 1(top left):type 7 only with notch and boundary condtions available
the contact energy in this case is very high as compared to below cases because it need more energy to oppose the penetration
plot2(top right):type7+type 11 assigned with notch and boundary condtion
with the combination of both type 7 and 11 there is not much force needed to oppose the penetration because type 11 is going to take care of that
plot 3(bottom): type 7+type11 interface assigned ,without notch and boundary condtions
with type 7 and 11 and without the notch the stifness of the component decreases further
case 5
Create a new notch in the middle ,select the whole section and run
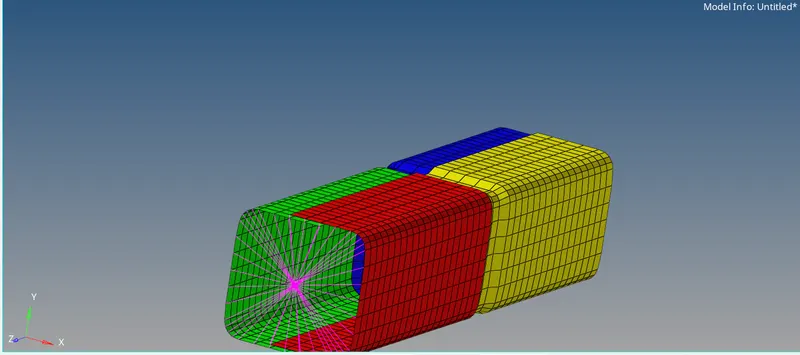
we are going to run the simulation for this case and will analyse the results in hypergraph and hyperview
procedure to run the analysis
click on analysis from the pannel click on radioss set -nt 4 (for 4 core processor) save the model in different directory and click on radioss to run the analysis
CHECK ENERGY AND MASS ERRORS
in order to see whether our analysis is acceptable or not we need to open crash_tube_0001.out file in notepad to check the energy and mass errors, the acceptable range for energy error is -15% to+5% and for mass error the range is 0-2%

MAXIMUM DISPLACEMENT+2.885E+O2
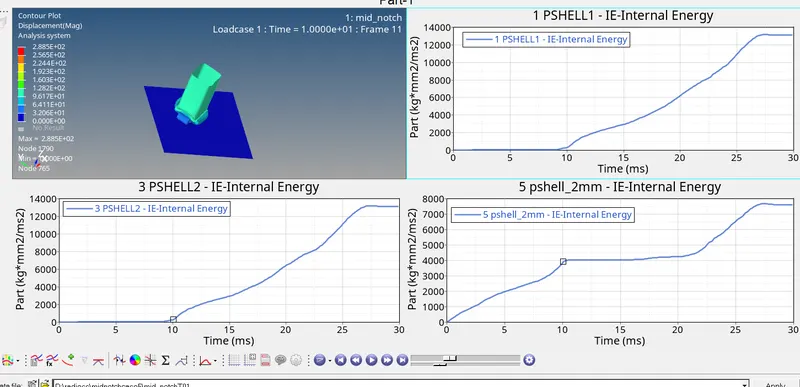
hypergraph 2D
in order to view the results in hypergraph 2d we need to select the hypergraph 2d from the client selector ,once the hypergraph window will open we need to input the data file (T01 FILE ) as shown below
internal energy
For the component having thickness of 2mm these two parts are in interface with the rigid wall.in both the parts the internal energy increases from the start of simulation upto 10 mili seconds indicates that the deformation take place in these components the deformation of both these components starts from bottom of the component 2mm upto the end of the component (where 3mm component starts) ,the component 2mm gets fully crushed in 10 mili sec once it is fully crushed there is no deformation afterward thats why the internal energy of both these components remains constant from 10th mili sec to 20th mili sec.From 10th mili sec the deformation takes place in 3mm components the surface is plane and the stiffness of this component is more than 2mm hence the internal energy increases further upto the full cruch of the component
in this case the component 2mm stores internal energy=0.75kj
and component 3mm stores =1.3kj
MAXIMUM STRESS+6.097E-01
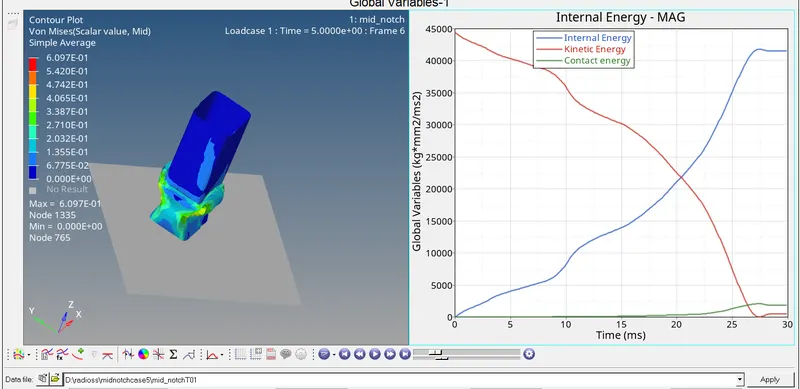
KINETIC ENERGY RESULTS
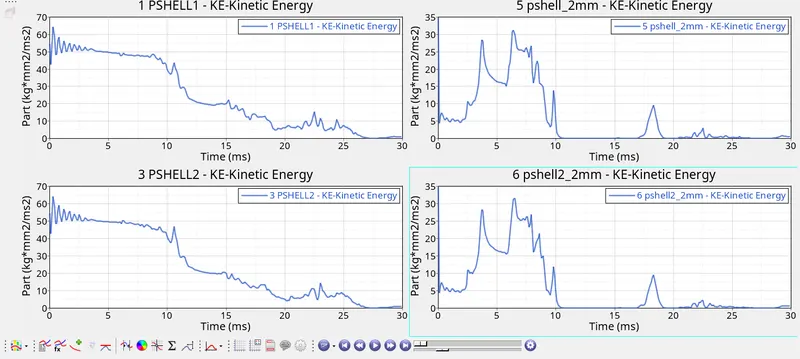
the kinetic energy in 2mm component starts from 35 units and there is sudden drop in the kinetic energy the drop indicates that the deformation occurs in the component and it didnot require much energy to deform the component the component 2mm gets fully crushed in 10ms and the KE tends to zeRO indicates that the component has deformed fully.
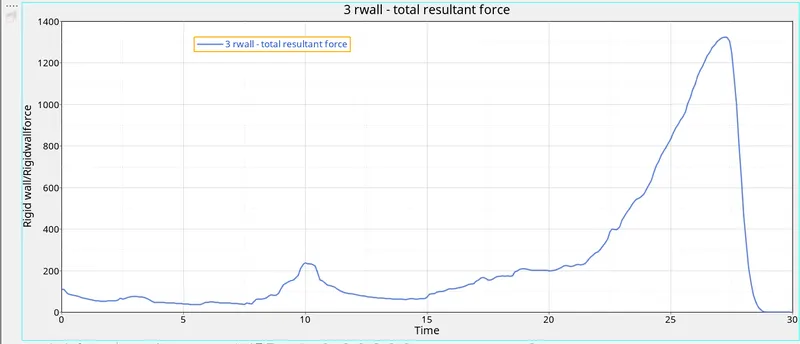
RIGID WALL FORCES
CASE6
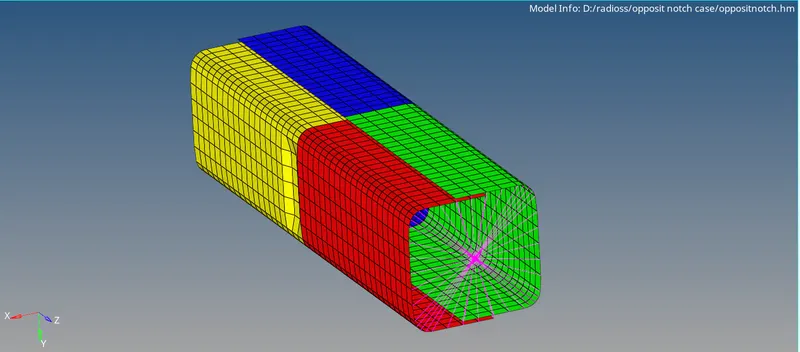
Create a new notch with nodes only from opposing 2 faces and run.
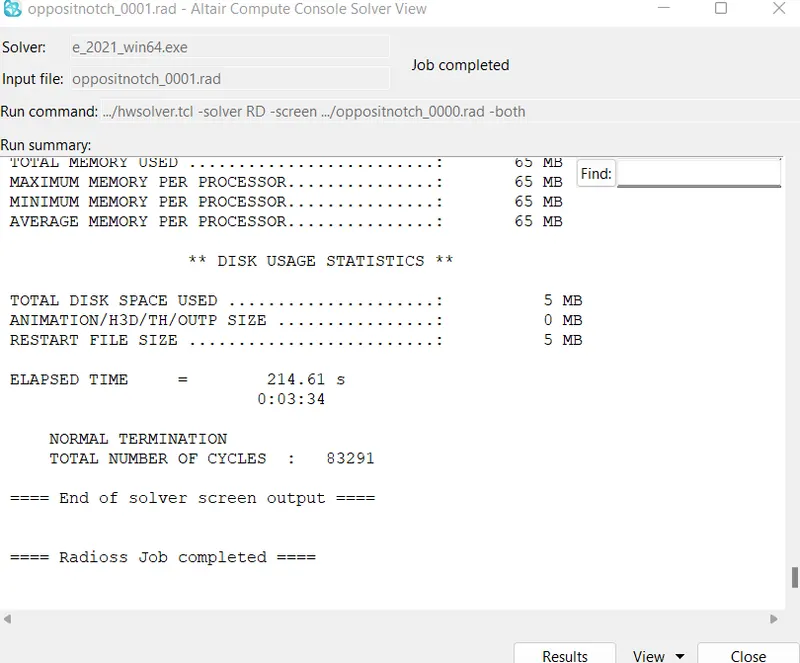
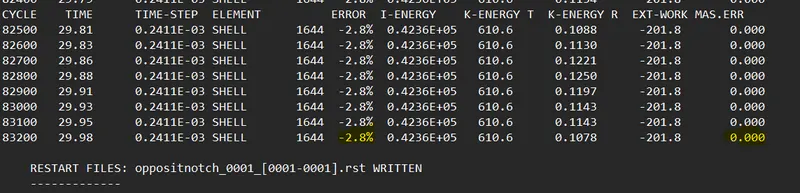
energy and mass error check
maximum displacement=2.796E+02
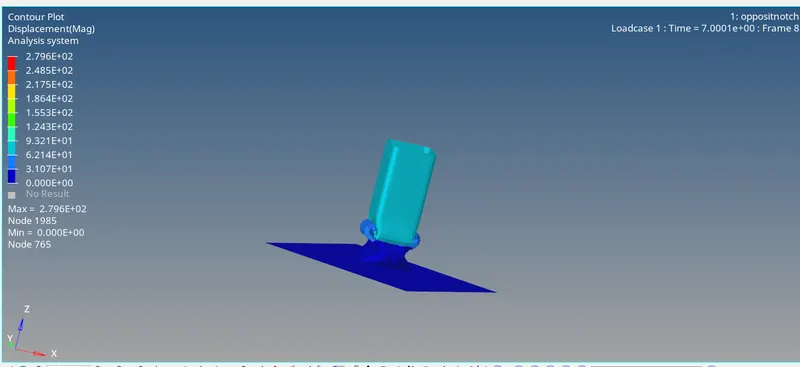
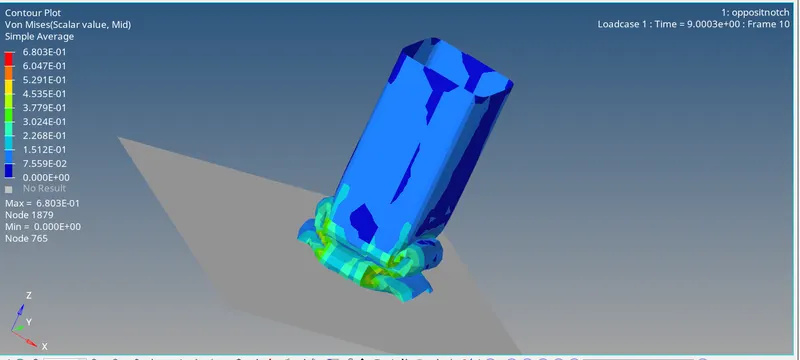
maximum stress=6.803E-01
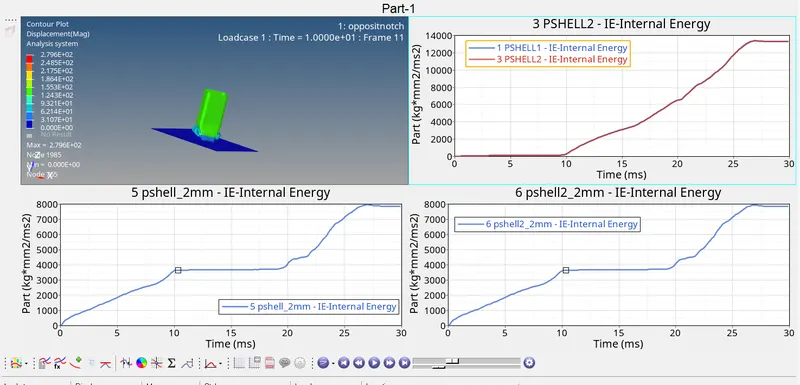
internal energy in different component
for the component having thickness of 2mm these two parts are in interface with the rigid wall.in both the parts the internal energy increases from the start of simulation upto 10 mili seconds indicates that the deformation take place in these components the deformation of both these components starts from notch of the component 2mm upto the bottom of the component ,the component 2mm gets fully crushed in 10 mili sec once it is fully crushed there is no deformation afterward thats why the internal energy of both these components remains constant from 10th mili sec to 20th mili sec.From 10th mili sec the deformation takes place in 3mm components the surface is plane and the stiffness of this component is more than 2mm hence the internal energy increases further upto the full cruch of the component
energy stored in 2mm component 0.8kj where as the component having 3mm thickness stores energy upt 1.35 kj
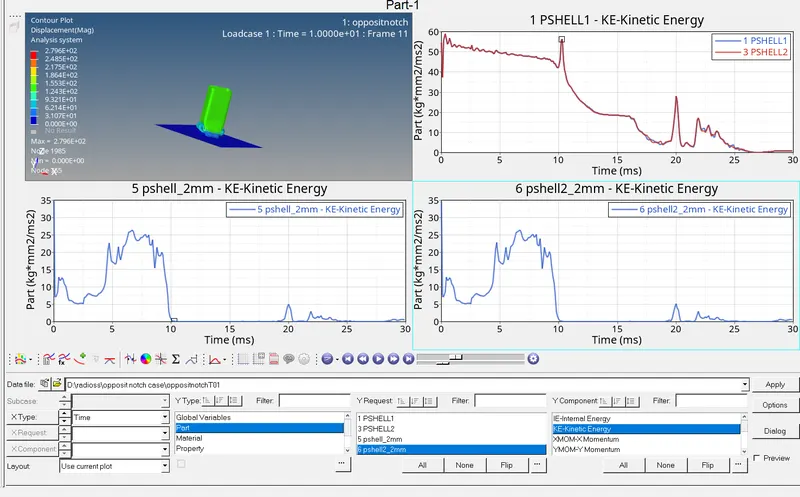
kinetic energy
the kinetic energy required to deform the 2mm component is less than the above case where notchs are not available in 2mm component the KE takes its peak at 7th mili sec and the peak was recorded 28 units ,in the case 5th the KE takes peak at 7th and was recorded to 32 units indicates without notch the kinetic energy required is higher
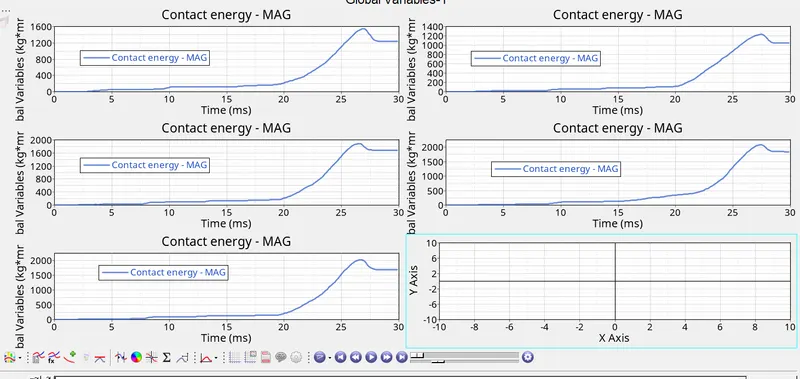
the results of contact energy has been ploted above for all the cases
contact energy in case 6(opposit notch)= the peak was recorded at 1600N
contact energy in case 5(middel notch)=the peak was recorded at 1200N
contact energy in case 4(without notch)=the peak was recorded at 1800N
contact energy in case 6(type 11 withnotch)=the peak was recorded at 2050N
contact energy in case 6(type7 inacti=6 withnotch)=the peak was recorded at 2000N
conclusion
bumper model has been meshed and all the cases has been run succesfully and results has been compared