Project 2 Thermal modeling of battery pack
For a 10 cell series lithium ion battery model, simulate the thermal effects and compare life cycle performance at various temperatures, charge & discharge rates using MATLAB.
For a 10 cell series lithium ion battery model, simulate the thermal effects and compare life cycle performance at various temperatures, charge & discharge rates using MATLAB.
introduction
Lithium-ion batteries are popular because they have a number of important advantages over competing technologies:
- They're generally much lighter than other types of rechargeable batteries of the same size. The electrodes of a lithium-ion battery are made of lightweight lithium and carbon. Lithium is also a highly reactive element, meaning that a lot of energy can be stored in its atomic bonds. This translates into a very high energy density for lithium-ion batteries. Here is a way to get a perspective on the energy density. A typical lithium-ion battery can store 150 watt-hours of electricity in 1 kilogram of battery. A NiMH (nickel-metal hydride) battery pack can store perhaps 100 watt-hours per kilogram, although 60 to 70 watt-hours might be more typical. A lead-acid battery can store only 25 watt-hours per kilogram. Using lead-acid technology, it takes 6 kilograms to store the same amount of energy that a 1 kilogram lithium-ion battery can handle.
temperature is the most important parameter in lithium ion battery .we have to monitor the temperature every time so that the performance and cyclic life will be better .
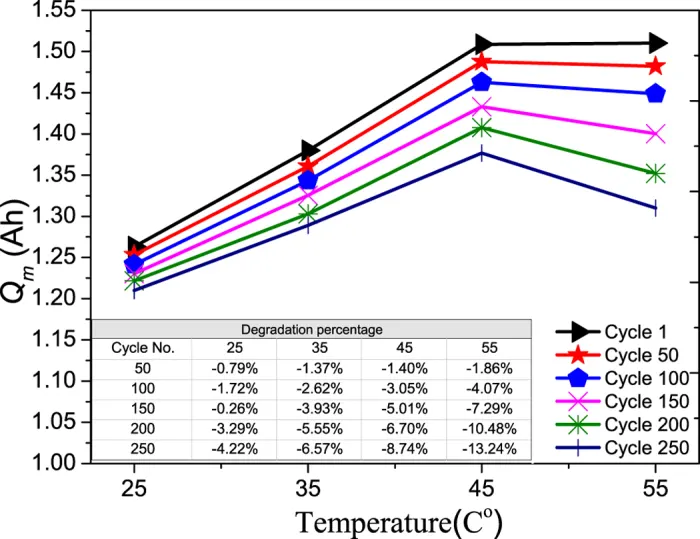
The acceptable temperature region for lithium ion batteries normally is −20 °C ~ 60 °C. Both low temperature and high temperature that are outside of this region will lead to degradation of performance and irreversible damages, such as lithium plating and thermal runaway. Therefore, understanding the temperature effects and accurate measurement of temperature inside lithium-ion batteries are important for the proper battery management.
thermal modeling of battery pack
below is the simulink model of the 10 series battery pack.we have connected 10 lithium ion cells in series.
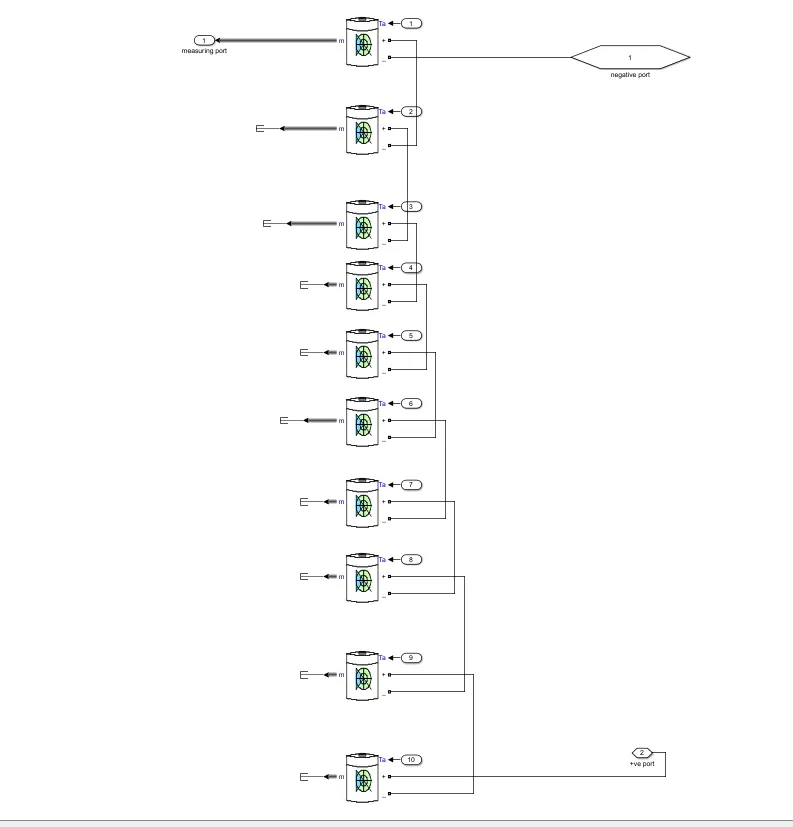
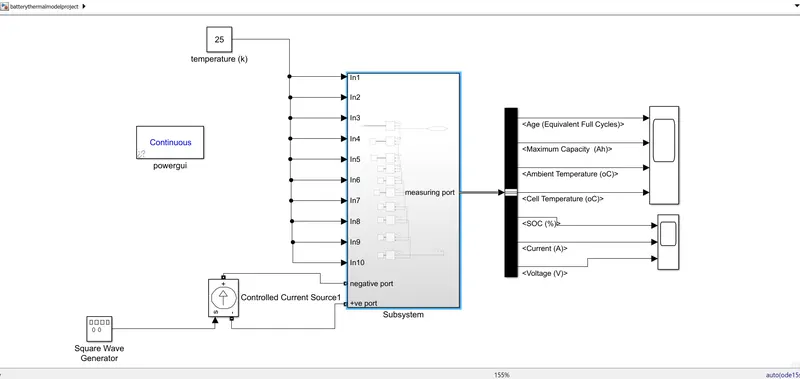
Blocks that has been used in the above model
Generic battery
Implements a generic battery model for most popular battery types. Temperature and aging (due to cycling) effects can be specified for Lithium-Ion battery type.
the intial state of charge of the battery is 0 therefore we are going to charge the battery first to 100% SOC
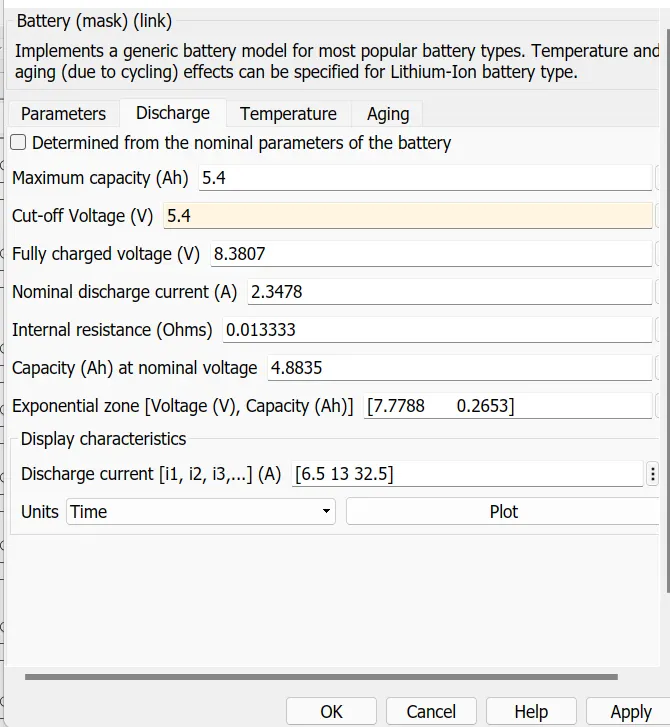
NOMINAL VOLTAGE =7.2V
RATED CAPACITY IS =5.4
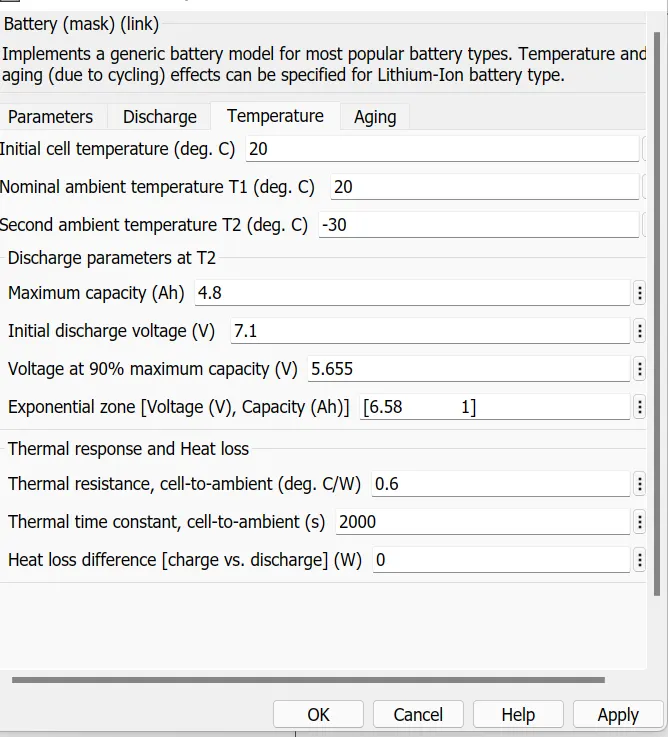
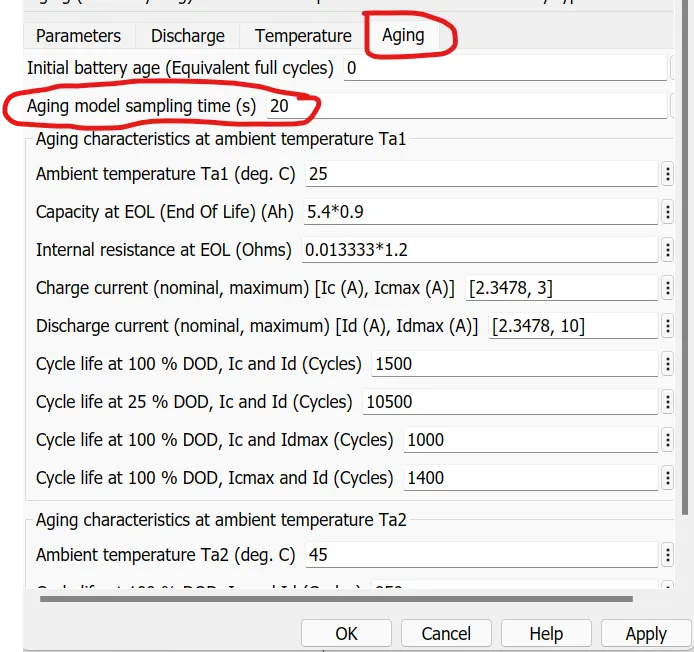
in order to see the effect of temperature and aging effect on battery performance we have to turn on the
(1) simulate temperature effect
(2) simulate aging effect
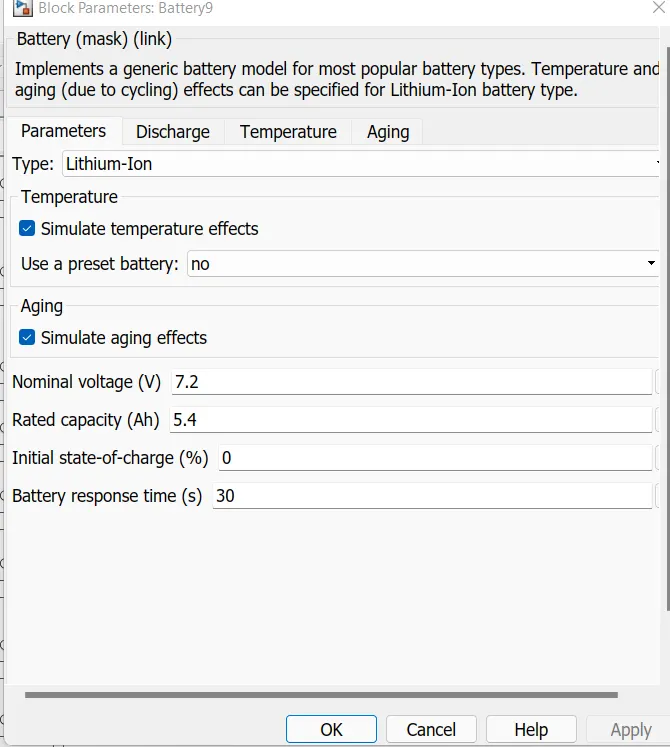
Discharge parameters
Temperature parameters
aging parameters
controlled current source
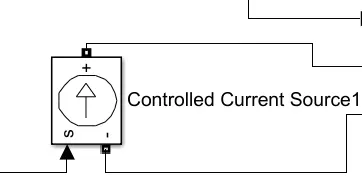
this controlled current source will discharge and charge the battery according the signals recived from the port 'S'
if the +ve port of the battery is connected to the -ve port and -ve port of the battery is connected to the +ve port of the controlled current source then discharge of the battery is possible
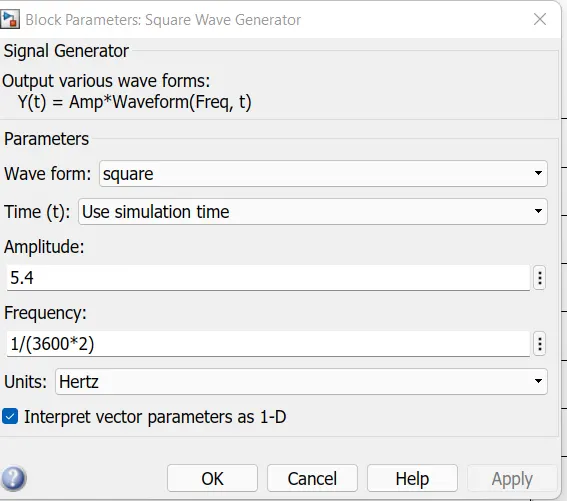
this block represents the charging and discharging rate of the battery .The amplitude of the square wave generator defines the C rate of the battery ,the amplitude of the square wave generator =5.4 and is equal to the amp hour capacity of the battery hence we can say that the battery will charge intially at a rate 0f 5.4A for an hour and after that it will discharge the battery at the same rate 5.4A.therefore charging and discharging of the battery will take 2 hours ,and this can be shown in the frequency that is =1/time =1/2hrs=1/3600*2.
we have 10 no of series connected battery therefore one cycle battery is 7200sec thus for 10 batteries will be equal to 7200*10
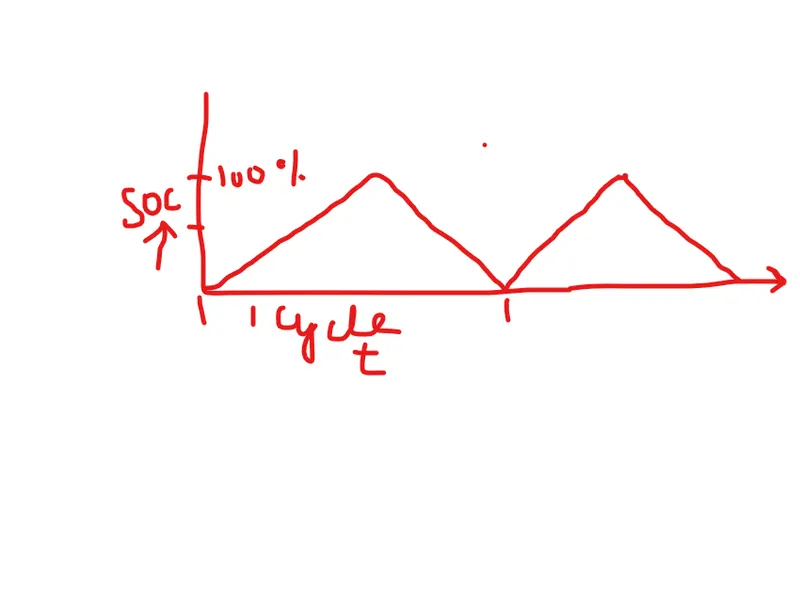
as we already know cycle of the battery this can be represented below
1 full battery cycle=1 charge +1 discharge cycle
constant block:this constant block is used to set the ambient temperature .intially we have set 25deg C
Case 1
simulate the thermal effects and compare life cycle performance at various temperatures, charge & discharge rates
ambient temperature =25 degree C
Charging and discharging rate =5.4
results
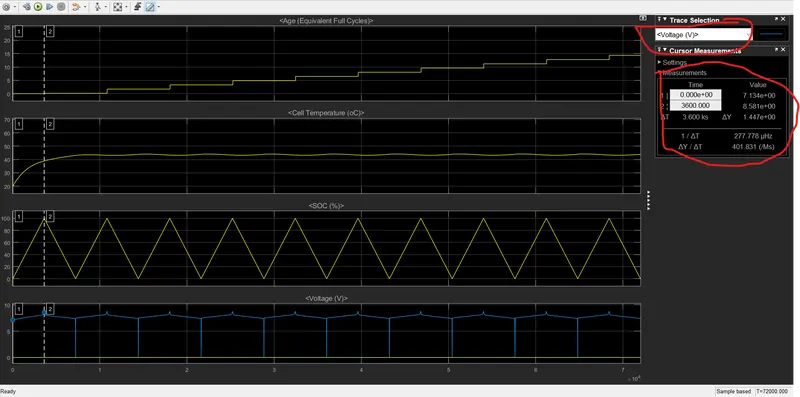
intially the nominal voltage of the battery was 7.13 v ,after charging for an hour the voltage reaches to 8.58V
the intial temperature was recorded to 20 deg c after completion of charge cycle the temperature reaches to almost 38deg C.after an hour the discharging takes place for an hour the cell temperature increases further to 43 deg C.the simulation runs for almost 20 hours the cell temperature was recorded to 44.4 degree C.
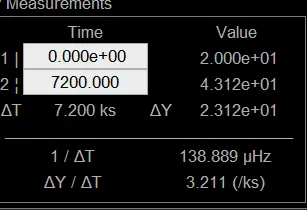
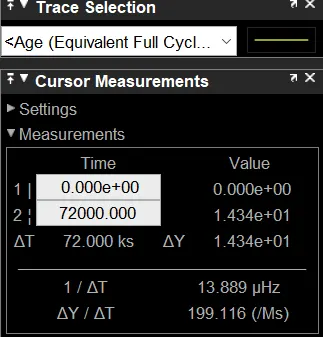
the battery runs for almost 20 hours and completes 10 cycles the battery capacity degrades to 85.66
the aging effect reaches to 14.66 to its equivalent full cycle
CASE 1(b)
temperature 45 deg C
intially the nominal voltage of the battery was 7.13V v ,after charging for an hour the voltage reaches to 8.85V(Max voltage attained)
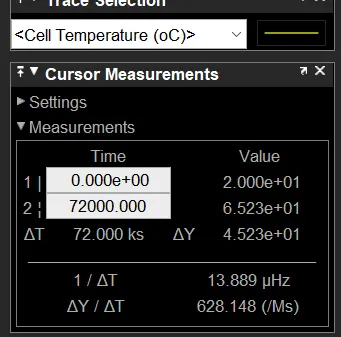
the intial temperature was recorded to 20 deg c after completion of charge cycle the temperature reaches to almost 56deg C.after an hour the discharging takes place for an hour the cell temperature increases further to 63 deg C.the simulation runs for almost 20 hours the cell temperature was recorded to 65.23 degree C.
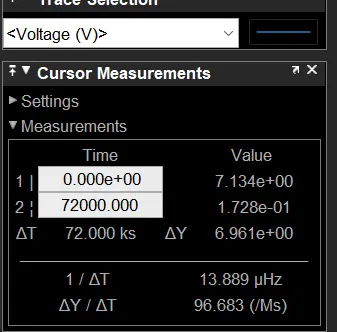
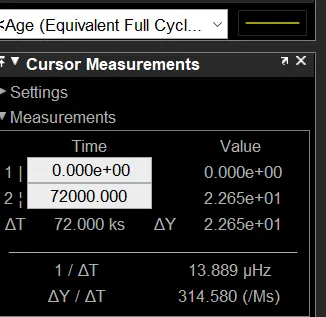
the battery runs for almost 20 hours and completes 10 cycles the battery capacity degrades to78%
the aging effect reaches to22 to its equivalent full cycle
result comparision
|
parameters |
Battery performance at 25 deg C |
Battery performance at 45 deg C |
|
Life cycle |
Life of battery is higher due to less aging effect |
Life of battery is low due to less aging effect |
|
Thermal runaway |
Less possibilities of thermal runaway |
high possibilities of thermal runaway |
|
performance |
Maximum voltage attained 8.58V |
Maximum voltage attained 8.85V |
|
capacity |
Battery degradation is less hence higher capacity is achieved |
Battery degradation is high therefore less capacity will be achieved |
Case 2 (a)
aging effect at various charge and discharge rate (0.5C RATE)
we have to set the amplitude in the square wave generator to 2.7
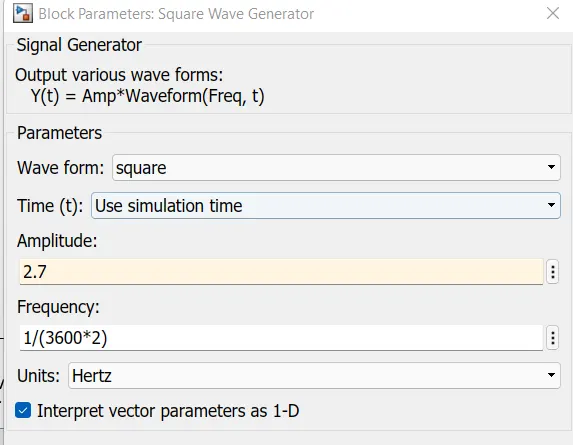
lets analyse the effect of reduced charge and discharge rate
results
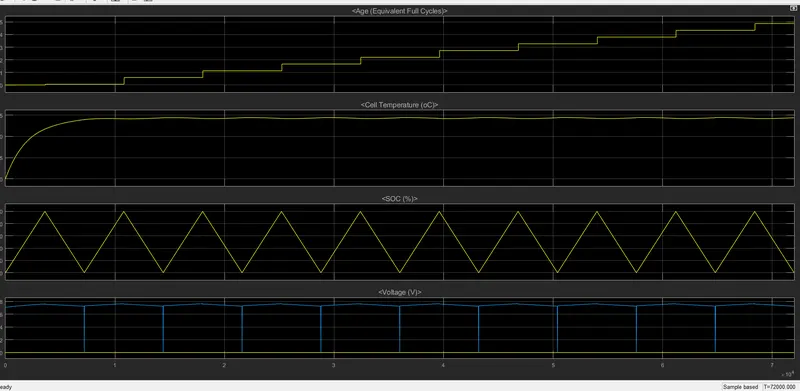
from the results it clear that the battery capacity is reduced only 4.87% this is due to the decreased rate of charge and discharge
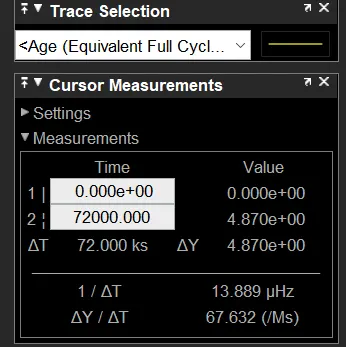
what would be the effect of cell temperature at half C rate
intially the temperature was recorded to 20 degree C ,but when the battery compleates 10 cycles the temperature was recorded 34deg C.thus with rthe decrease in charge and discharge rate the temperature is not going to attain a higher value as in the case 1 where temp was recorded after completion of 10 cycles is 44.4
the results are shown below
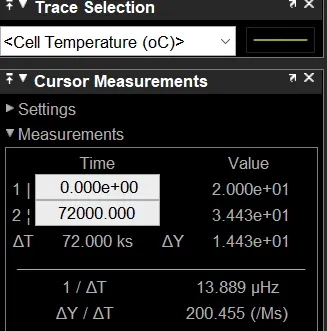
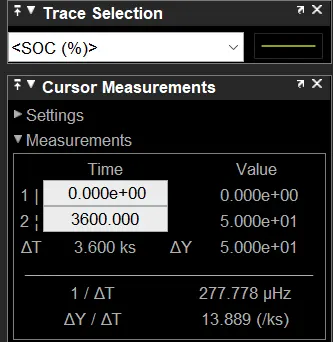
SOC
at a half rate the soc reach to 50% in 3600 because we have reduced the charge rate .though attaining a 50 % SOC the battery life has been increased significantly at half rate
case 2 b
at 10.8 or 2c rate
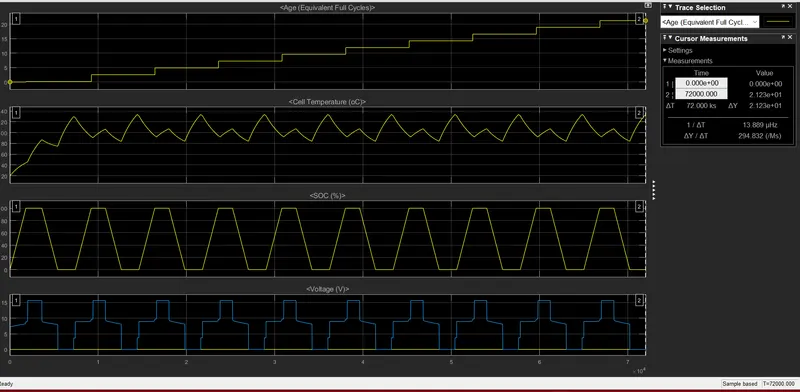
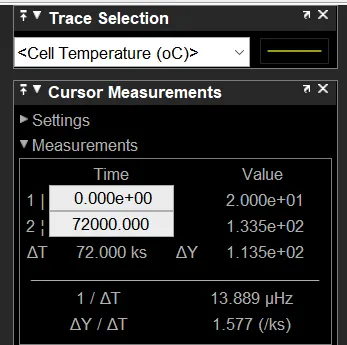
intially the temperature was recorded to 20 degree C ,but when the battery compleates 10 cycles the temperature was recorded 133 deg C.thus with the increase in charge and discharge rate the cell temperature is going to attain a higher value .
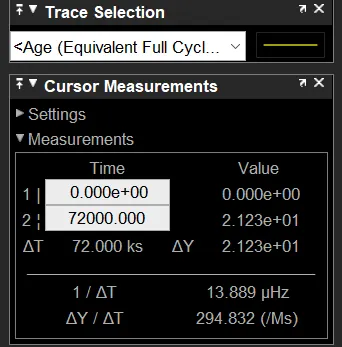
from the results it clear that the battery capacity is reduced only 21% this is due to the increased rate of charge and discharge after completing the 10 cycles the battery capacity remains 79 hens at higher discharge rate the battery capacity has been degraded
conclusion
in this study we have learn thermal and aging effect on battery pack .the parameter like charge and discharge rate have significantely effect the performance on the battery when the rates are higher
temperature has also affected the battery performance like capacity ,at higher temperature the battery has been degraded significantely.